. 2024 Aug 3;9(1):138.
doi: 10.1038/s41541-024-00932-x.

Immunogenicity and biodistribution of lipid nanoparticle formulated self-amplifying mRNA vaccines against H5 avian influenza

Affiliations

Immunogenicity and biodistribution of lipid nanoparticle formulated self-amplifying mRNA vaccines against H5 avian influenza

Xiaole Cui et al. NPJ Vaccines. .

Abstract

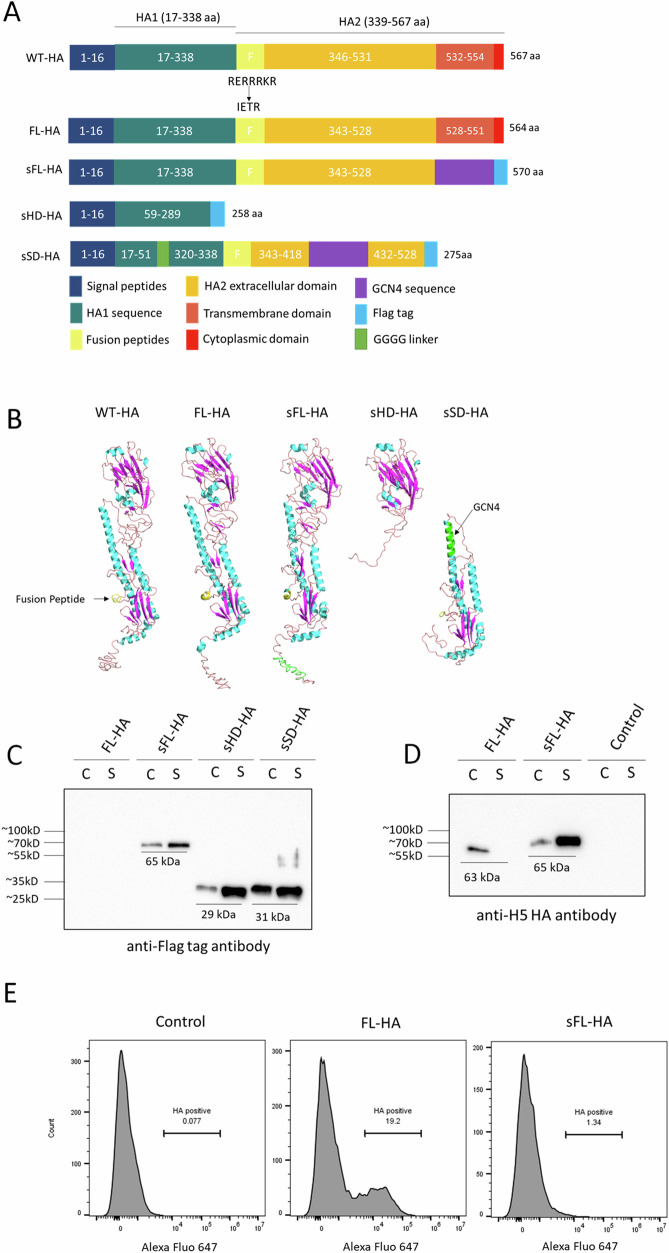
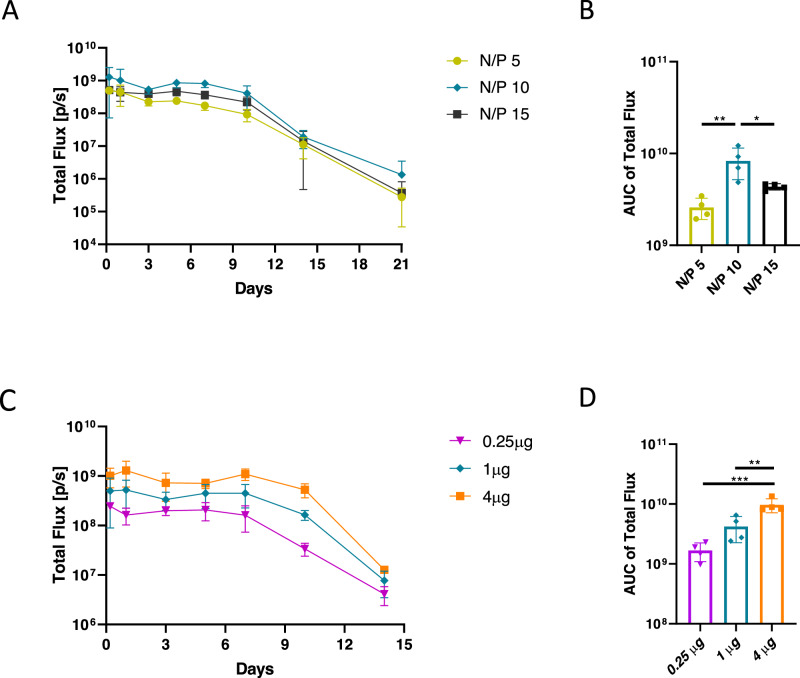
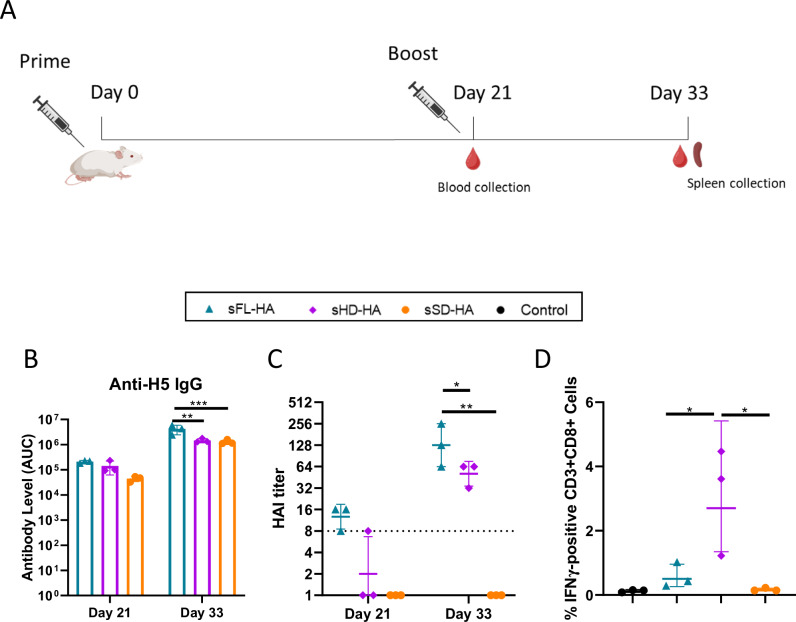
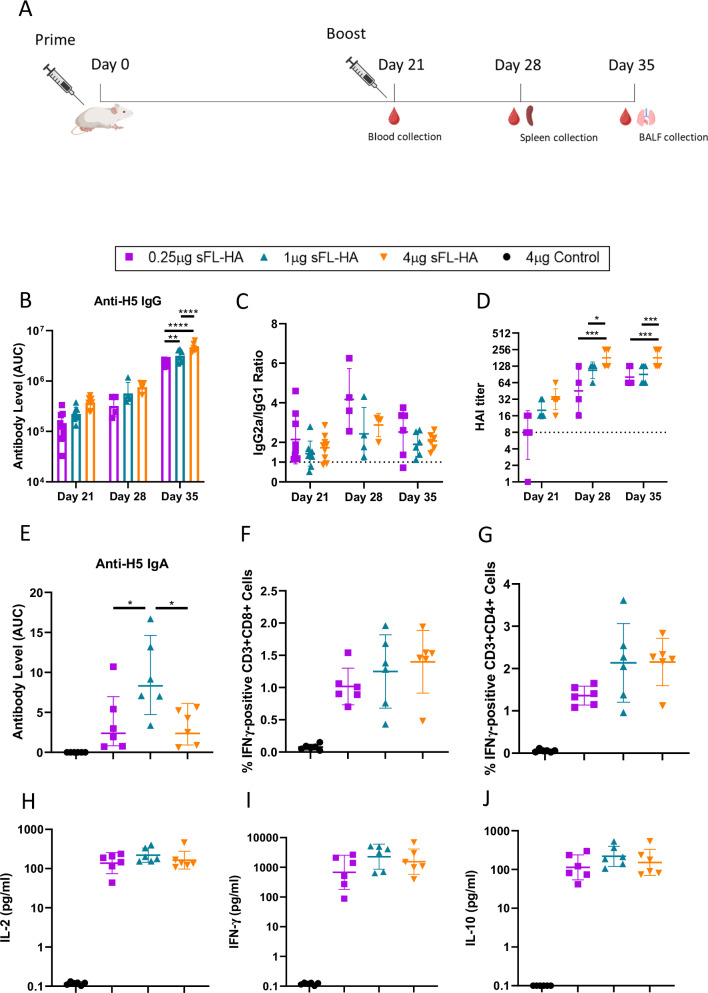
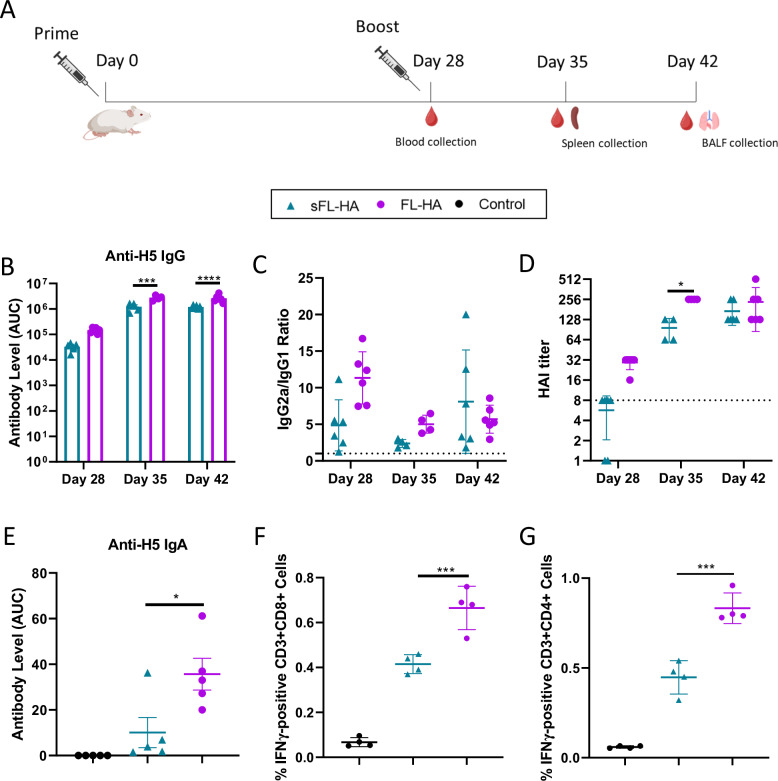
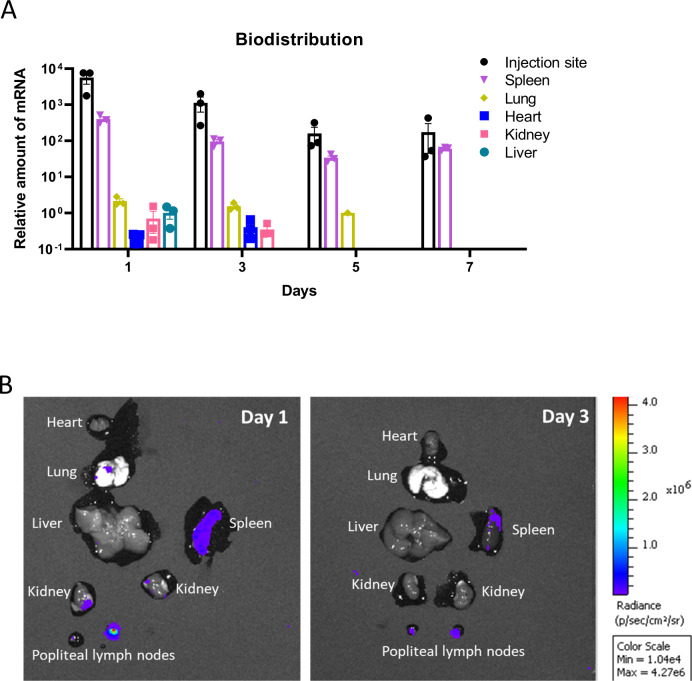
This study reports on the immunogenicity and biodistribution of H5 hemagglutinin (HA)-based self-amplifying (sa) mRNA vaccines in mice. Four sa-mRNA vaccines encoding either a secreted full-length HA, a secreted HA head domain, a secreted HA stalk domain, or a full-length membrane-anchored HA were investigated. All vaccines elicited an adaptive immune response. However, the full-length HA sa-RNA vaccines demonstrated superior performance compared to head and stalk domain vaccines. The antibody titers positively correlated with the vaccine dose. Cellular immune responses and antigen-specific IgA antibodies in the lungs were also observed. The comparison of the sa-mRNA vaccines encoding the secreted and membrane-anchored full-length HA revealed that anchoring of the HA to the membrane significantly enhanced the antibody and cellular responses. In addition to the injection site, the intramuscularly injected sa-mRNA-LNPs were also detected in the draining lymph nodes, spleen, and to a lesser extent, in the lung, kidney, liver, and heart.


Conflict of interest statement

The authors declare no competing interests.

Figures

Fig. 1
Fig. 1. Schematic diagram of the different HA antigens, predicted protein structures, and translation verification of the sa-mRNA vaccines encoding different types of HA using either western blotting or flow cytometry.
A Schematic overview of the wild type HA and the engineered HA antigens that are encoded by the sa-mRNA vaccines. The numbers within the rectangles indicate the original position of amino acids in the WT-HA sequence. The multi-basic cleavage site (RERRRKR) at the start of the fusion peptide (F) was mutated to IETR in all sa-mRNA vaccine constructs, except sHD-HA. In sFL-HA, the transmembrane domain and cytoplasmic domain were replaced by GCN4 leucine zipper (GCN4), followed by a Flag tag (Tag) sequence (DYKDDDDK). In sHD-HA, amino acids 17–58 and 290–567 were excluded and a Flag tag was added to its C-terminal. In sSD-HA, the amino acids 52–319 of the head domain were replaced by a short linker and amino acids 422–434 were substituted by GCN4. The transmembrane domain and cytoplasmic domain were replaced by a Flag tag. B The structures of the HA proteins as predicted by I-TASSER (available at https://zhanggroup.org/I-TASSER/), in which the fusion peptide is shown in yellow, GCN4 in green, α-helix in cyan and β sheet in purple. C, D BHK-21 cells were transfected with 1 µg sa-mRNAs encoding different types of HA using Lipofectamine® MessengerMAX™. After 24 h, the HA proteins in cell lysate (c) and supernatant (s) were analyzed by western blot. To detect the HAs, an anti-Flag tag antibody (C) or anti-H5 HA antibody (D) was used. E Flow cytometric detection of surface-exposed HA after transfection of BHK cells with sa-mRNAs encoding luciferase (control), FL-HA or sFL-HA. Surface-exposed HA was visualized 24 h after transfection using an Alexa Fluor-647 conjugated H5N1 HA antibody. The size markers can be found on the uncropped and unprocessed images (Supplementary Fig. S7) used to generate Fig. 1C, D.
Fig. 2
Fig. 2. Optimization of sa-mRNA-LNP formulation and dosage.
Balb/c mice were injected (IM) with (A and B) 1 µg luciferase encoding sa-mRNA-LNPs prepared at different N/P ratios (5, 10 or 15), or (C and D) with different doses of sa-mRNA-LNPs (0.25 µg, 1 µg or 4 µg) prepared at N/P ratio 10. The bioluminescence was monitored with an IVIS imaging system from 6 h to day 21 (A, B) or to day 14 (C, D). Total flux (photon/s) reflect the radiance integrated over the area of interest. Bar charts B and D show the area under the curve (AUC) of the curves in A and C. Each group contained 4 mice. The significance level (n = 4; *p < 0.05; **p < 0.01; ***p < 0.001) was calculated using one-way ANOVA with Tukey’s multiple comparisons test (B and D). Mean values are shown and error bars represent SD.
Fig. 3
Fig. 3. Immunogenicity data of the sa-mRNA vaccines encoding secreted H5 HA antigens.
A Vaccination schedule. Mice were vaccinated (IM) with 1 µg sa-mRNA-LNPs encoding sFL-HA, sHD-HA, sSD-HA or luciferase (control group) using a prime-boost schedule with a 21-day interval. Blood samples were collected three weeks after the prime (day 21) and twelve days (day 33) after the boost. Spleens were collected twelve days (day 33) after the boost. B Serum antibody levels were measured by ELISA and the data are reported as the area under the ELISA absorbance curve (AUC) for each group. No antibody titers were detected in the control group. C HAI titers in sera collected three weeks after the prime (day 21) and 12 days (day 33) after the boost. The detection limit is 8 and indicated as a dashed line, and titers below this threshold are considered as undetectable titers and shown as 1. D Spleens were harvested 12 days after the boost and stimulated with a peptide pool of a HA from a vaccine-mismatched clade (A/Indonesia/CDC835/2006(H5N1)). Subsequently, the percentage of IFN-γ positive CD3+CD8+ T cells was assessed by flow cytometry. The significance level (n = 3; *p < 0.05; **p < 0.01; ***p < 0.001) was calculated using two-way ANOVA (B and C) or one-way ANOVA (D) with Tukey’s multiple comparisons test. Bars and lines represent the geometric means (B and C) or arithmetic means. Error bars represent the SD. Figure A was created with BioRender.com.
Fig. 4
Fig. 4. Dose-dependent and mucosal immune responses induced by the sFL-HA sa-mRNA-LNP vaccine.
A Vaccination schedule. Mice (n = 12) were intramuscularly vaccinated with 0.25 µg, 1 µg or 4 µg of sFL-HA sa-mRNA-LNPs using a prime-boost schedule with a 21-day interval. The control mice received 4 µg of a luciferase encoding sa-mRNA-LNP. B Serum anti-H5 IgG antibody levels measured three weeks after the prime (day 21 n = 9), and one and two weeks after the boost (day 28 n = 4 and day35 n = 6). Antibody levels are shown as the area under the ELISA absorbance curve (AUC). C The IgG2a/IgG1 ratio calculated by dividing the AUC of IgG2a by the AUC of IgG1. Dashed line indicates a value of 1. D HAI titers in serum samples taken three weeks after the prime (day 21), and one (day 28) and two weeks (day 35) after the boost. The detection limit is 8 and indicated as dashed line. The value 1 indicated an undetectable titer. No antibodies were detected in the control group. E depicts the anti-H5 IgA antibodies in the bronchoalveolar lavage fluid two weeks after the boost. F and G show the elicited cellular immune responses. Spleens were collected one week after the boost and splenocytes were isolated and stimulated with the HA peptide pool from A/Indonesia/CDC835/2006(H5N1). The percentage of IFN-γ positive CD3+CD8+ T cells (F) and CD3+CD4+ T cells (G) was measured by flow cytometry. The concentrations of IL-2 (H), IFN-γ (I) and IL-10 (J) in the supernatant of stimulated splenocytes was measured by quantitative ELISA. The significance level (*p < 0.05; **p < 0.01: ***p < 0.001; ****p < 0.0001) was calculated using two way ANOVA (B and D) or one-way ANOVA (EJ) (day 21 n = 9, day 28 n = 4, day 35 n = 6) with Tukey’s multiple comparisons test. Data are represented as geometric means (B and D) or arithmetic means. Error bars represent the SD. Figure A was created with BioRender.com.
Fig. 5
Fig. 5. Comparison of the vaccination efficacy of sa-mRNA-LNP vaccines encoding either secreted HA or membrane anchored HA.
A Vaccination schedule with 28-day (4-week) prime-boost interval. Mice (n = 10) were intramuscularly vaccinated with 1 µg sa-mRNA-LNP vaccines encoding sFL-HA or FL-HA. Mice injected with sa-mRNA-LNPs encoding luciferase served as control. B Serum anti-H5 IgG antibody levels against HA measured by ELISA 4 weeks after the prime (day 28 n = 6), one week (day 35 n = 4) and two weeks (day 42 n = 6) after the boost and shown as area under the ELISA absorbance curve (AUC). C The IgG2a/IgG1 ratios calculated by dividing the AUC of IgG2a by the AUC of IgG1. Dashed line indicates a value of 1. D HAI titers in serum samples taken four weeks after the prime (day 28), and one (day 35) and two weeks (day 42) after the boost. The detection limit is 8 and indicated as dashed line. Value sets at 1 indicate undetectable titer. E Anti-H5 IgA antibodies in BALFs collected two weeks after the boost. F and G depict the elicited cellular immune responses. Spleens were collected one week after the boost and splenocytes were isolated and stimulated with a HA peptide pool from A/Indonesia/CDC835/2006(H5N1). The percentage of IFN-γ positive CD3+CD8+ T cells (F) and CD3+CD4+ T cells (G) in the splenocytes were measured by flow cytometry. The significance levels in panels EG (*p < 0.05; **p < 0.01; ***p < 0.001; ****p < 0.0001) were calculated by two-way ANOVA (B and D) or one-way ANOVA with Tukey’s multiple comparisons test. Data are represented as geometric means (B, D and E) or arithmetic means, Error bars represent the standard deviation. Figure A was created with BioRender.com.
Fig. 6
Fig. 6. The biodistribution of the sa-mRNA-LNP vaccines in mice after intramuscular administration.
A Mice were intramuscularly injected with 4 µg of LNP formulated sa-mRNA encoding sFL-HA. Subsequently at each time point, 3 mice were euthanized and the injection site, spleen, lung, heart, kidney, liver and brain were harvested. The presence of sFL-HA sa-mRNA in these organs was detected by RT-qPCR. The data are shown as the relative sa-mRNA level normalized to the reference gene GAPDH and the normalized sFL-HA sa-mRNA level in the liver on day 1 was set as 1. B Mice (n = 2) were intramuscularly injected with 4 µg of LNP formulated sa-mRNA encoding luciferase. The heart, lung, liver, spleen, kidney, and lymph nodes were harvested on day 1 and 3, and the bioluminescence was measured by the IVIS system.

Similar articles

Cited by

References

    1. Villanueva-Cabezas, J. P., Coppo, M. J. C., Durr, P. A. & McVernon, J. Vaccine efficacy against Indonesian Highly Pathogenic Avian Influenza H5N1: systematic review and meta-analysis. Vaccine35, 4859–4869 (2017). 10.1016/j.vaccine.2017.07.059 - DOI - PubMed
    1. Chen, H. & Bu, Z. Development and application of avian influenza vaccines in China. Curr. Top. Microbiol. Immunol.333, 153–162 (2009). - PubMed
    1. Kim, S. H. Challenge for One Health: Co-Circulation of Zoonotic H5N1 and H9N2 Avian Influenza Viruses in Egypt. Viruses10. 10.3390/v10030121 (2018). - PMC - PubMed
    1. Pittman, M. & Laddomada, A. Legislation for the control of avian influenza in the European union. Zoonoses Public Health55, 29–36 (2008). 10.1111/j.1863-2378.2007.01087.x - DOI - PubMed
    1. Polack, F. P. et al. Safety and Efficacy of the BNT162b2 mRNA Covid-19 Vaccine. N. Engl. J. Med.383, 2603–2615 (2020). 10.1056/NEJMoa2034577 - DOI - PMC - PubMed

LinkOut - more resources