. 2024 Aug 3;24(1):951.
doi: 10.1186/s12885-024-12737-1.

Beyond tobacco: genomic disparities in lung cancer between smokers and never-smokers

Affiliations

Beyond tobacco: genomic disparities in lung cancer between smokers and never-smokers

Javiera Garrido et al. BMC Cancer. .

Abstract

Background: Tobacco use is one of the main risk factors for Lung Cancer (LC) development. However, about 10-20% of those diagnosed with the disease are never-smokers. For Non-Small Cell Lung Cancer (NSCLC) there are clear differences in both the clinical presentation and the tumor genomic profiles between smokers and never-smokers. For example, the Lung Adenocarcinoma (LUAD) histological subtype in never-smokers is predominately found in young women of European, North American, and Asian descent. While the clinical presentation and tumor genomic profiles of smokers have been widely examined, never-smokers are usually underrepresented, especially those of a Latin American (LA) background. In this work, we characterize, for the first time, the difference in the genomic profiles between smokers and never-smokers LC patients from Chile.

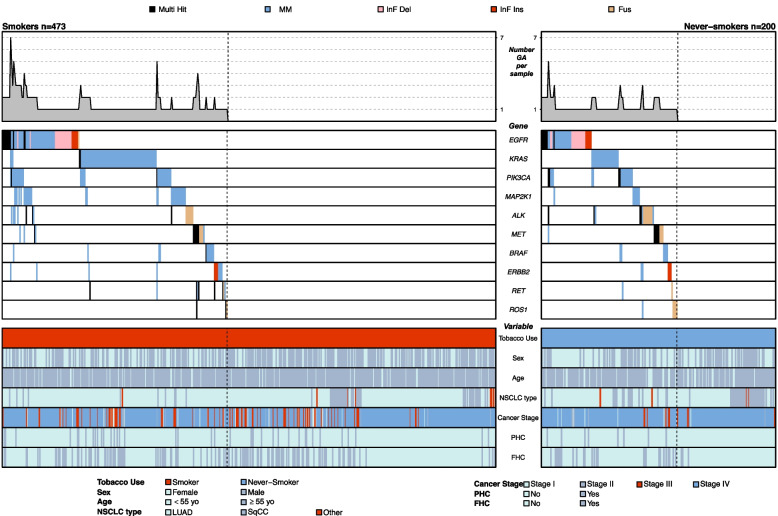
Methods: We conduct a comparison by smoking status in the frequencies of genomic alterations (GAs) including somatic mutations and structural variants (fusions) in a total of 10 clinically relevant genes, including the eight most common actionable genes for LC (EGFR, KRAS, ALK, MET, BRAF, RET, ERBB2, and ROS1) and two established driver genes for malignancies other than LC (PIK3CA and MAP2K1). Study participants were grouped as either smokers (current and former, n = 473) or never-smokers (n = 200) according to self-report tobacco use at enrollment.

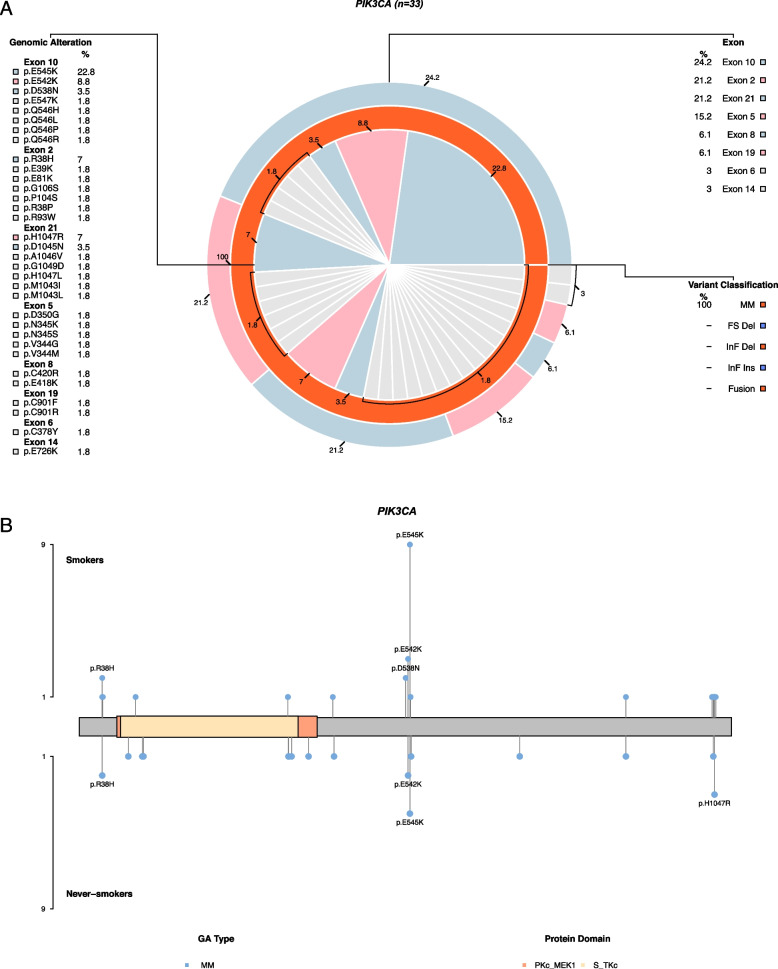
Results: Our findings indicate a higher overall GA frequency for never-smokers compared to smokers (58 vs. 45.7, p-value < 0.01) with the genes EGFR, KRAS, and PIK3CA displaying the highest prevalence while ERBB2, RET, and ROS1 the lowest. Never-smokers present higher frequencies in seven out of the 10 genes; however, smokers harbor a more complex genomic profile. The clearest differences between groups are seen for EGFR (15.6 vs. 21.5, p-value: < 0.01), PIK3CA (6.8 vs 9.5) and ALK (3.2 vs 7.5) in favor of never-smokers, and KRAS (16.3 vs. 11.5) and MAP2K1 (6.6 vs. 3.5) in favor of smokers. Alterations in these genes are comprised almost exclusively by somatic mutations in EGFR and mainly by fusions in ALK, and only by mutations in PIK3CA, KRAS and MAP2K1.

Conclusions: We found clear differences in the genomic landscape by smoking status in LUAD patients from Chile, with potential implications for clinical management in these limited-resource settings.

Keywords: Cancer disparities; Chilean; EGFR mutation; KRAS; Latin American populations; Lung Adenocarcinoma; MAP2K1; Tobacco consumption.


Conflict of interest statement

GS, AB, RA, RAC, MF, LR, DA, RL, JC and PP were Pfizer Chile employees. HF, EDN, DNN, GPB, MGA, CF, TFB, JF, MA, SC, OA, MLS, GR, CS, KM and SR received a grant and non-financial support for to perform this work for CEMP Pfizer Chile. Outside this work, HF discloses personal fees and non- financial support from Pfizer and BMS and non-financial support from AstraZeneca and Roche. RA declares honoraria for conferences, advisory boards, and educational activities from Roche, grants, and support for scientific research from Illumina, Pfizer, Roche & Thermo Fisher Scientific, and honoraria for conferences from Thermo Fisher Scientific, Janssen & Tecnofarma. The other authors declare that they have no competing interests. The funders had no role in the design of the study; in the collection, analyses, or interpretation of data; in the writing of the manuscript; or in the decision to publish the results.

Figures

Fig. 1
Fig. 1
Genomic landscape of the study population by smoking status. Left panel figures represent smokers (n = 473) and right panel figures never-smokers (n = 200). Top panels display the absolute number of GA per tumor sample. Middle panels are the oncoprint plots for each group of participants. Bottom panels indicate the characteristics of the patients for the studied clinical variables. Dashed vertical lines separate the set of samples with at least one GA from the those without GAs. GA: Genomic Alteration, MM: Missense Mutation, InF Del: In-Frame Deletion, InF Ins: In-Frame Insertion, Fus: Fusion, LUAD: Lung Adenocarcinoma, SqCC: Squamous Cell Carcinoma
Fig. 2
Fig. 2
Prevalence of GAs for the 10 driver genes under study by smoking status. Genes are ordered by decreasing overall prevalence. Absolute and relative frequencies are specified for each group at the top of each bar. Prevalence values for the complete population are shown in grey rectangles. p-value for difference in proportions between groups was calculated using either the chi-squared test or the fisher exact test for small expected counts. Top panel displays the overall prevalence for smokers and never-smokers including both somatic mutations and structural variants. Bottom panels display relative frequencies separately for somatic mutations (left) and structural variants (right). (*) represents statistically significant difference. (*: p-value < 0.05, **: p-value < 0.01, ***: Bonferroni adjusted p-value < 0.001). GA: Genomic Alteration
Fig. 3
Fig. 3
Distribution and type of GAs per gene. For each plot, smokers are shown in the left and never-smokers in the right. Top panel includes all tumor samples with at least one GA and the distribution of samples with only one or more than one GA for each gene is shown. Bottom left panel includes samples with only one GA and the proportion of the different types of GA for each gene is shown. Bottom right panel includes samples with more than one GA and the proportion of the different types of GA for each gene is shown. In each panel, the number of tumor samples included in the analysis for each group of patients is specified at the top. Absolute and relative frequencies for the distribution and type GA are specified inside bars. GA: Genomic Alteration
Fig. 4
Fig. 4
Matrices of co-occurrences and exclusions of GA grouped by genes. The group of smokers are shown in the left and never-smokers in the right. Lower triangles of the matrices represent Kendall correlation coefficients, with negative correlation (exclusion) coloured in red and positive correlation (co-occurrence) in blue. (*) represents statistically significant correlations at a 5% level. Upper triangles of the matrices represent the actual number of co-occurrences, with bigger and redder circles representing higher absolute number of co-occurrences. GA: Genomic Alteration
Fig. 5
Fig. 5
Matrices of co-occurrences and exclusions of the top 30 GA with the highest coefficients. The group of smokers are shown in the left and never-smokers in the right. Matrices display the first 30 GAs with the highest sum of the absolute values of all pair-wise coefficients. GAs are coloured and ordered by the genes to which they belong. Negative correlations (exclusions) are coloured in red and positive correlation (co-occurrences) in blue. (*) represents statistically significant correlations at a 5% level. GA: Genomic Alteration
Fig. 6
Fig. 6
Characterization of individual GA identified in the gene EGFR (n = 48). Panel A: pie chart displaying the relationship between the frequency of individual GAs (inner circle), type of GA (middle circle), and exon number to which individual GAs belong (outer circle). For all circles, grey color represents GA present only once (n = 1). Panel B: lolliplot specifying the location and counts of individual GAs for the group of smokers (top) and never-smokers (bottom). For more details see Additional File 2: Table S3
Fig. 7
Fig. 7
Characterization of individual GA identified in the gene PIK3CA (n = 33). Panel A: pie chart displaying the distribution and relationship between the frequency of individual GAs (inner circle), type of GA (middle circle), and exon number to which individual GAs belong (outer circle). For all circles, grey color represents GA present only once (n = 1). Panel B: lolliplot specifying the location and counts of individual GAs for the group of smokers (top) and never-smokers (bottom). For more details see Additional File 2: Table S4

References

    1. Piñeros M, Laversanne M, Barrios E, de Camargo Cancela M, de Vries E, Pardo C, Bray F. An updated profile of the cancer burden, patterns and trends in Latin America and the caribbean. Lancet Reg Health Am. 2022;13:1–14. 10.1016/j.lana.2022.100294. 10.1016/j.lana.2022.100294 - DOI - PMC - PubMed
    1. Wakelee HA, Chang ET, Gomez SL, Keegan THM, Feskanich D, Clarke CA, Holmberg L, Yong LC, Kolonel LN, Gould MK, et al. Lung cancer incidence in never-smokers. J Clin Oncol. 2007;25:472–8. 10.1200/JCO.2006.07.2983. 10.1200/JCO.2006.07.2983 - DOI - PMC - PubMed
    1. Field RW, Withers BL. Occupational and environmental causes of lung cancer. Clin Chest Med. 2012;33:681–703. 10.1016/j.ccm.2012.07.001. 10.1016/j.ccm.2012.07.001 - DOI - PMC - PubMed
    1. Siegel RL, Miller KD, Jemal A. Cancer statistics, 2020. CA Cancer J Clin. 2020;70:7–30. 10.3322/caac.21590. 10.3322/caac.21590 - DOI - PubMed
    1. Pinheiro PS, Callahan KE, Medina HN, Koru-Sengul T, Kobetz EN, Gomez SL, de Lima Lopes G. Lung cancer in never smokers: distinct population-based patterns by age, sex, and race/ethnicity. Lung Cancer. 2022;174:50–6. 10.1016/j.lungcan.2022.10.009. 10.1016/j.lungcan.2022.10.009 - DOI - PubMed