. 2024 Aug 3;21(1):194.
doi: 10.1186/s12974-024-03173-w.

PPARγ activation ameliorates cognitive impairment and chronic microglial activation in the aftermath of r-mTBI

Affiliations

PPARγ activation ameliorates cognitive impairment and chronic microglial activation in the aftermath of r-mTBI

Andrew Pearson et al. J Neuroinflammation. .

Abstract

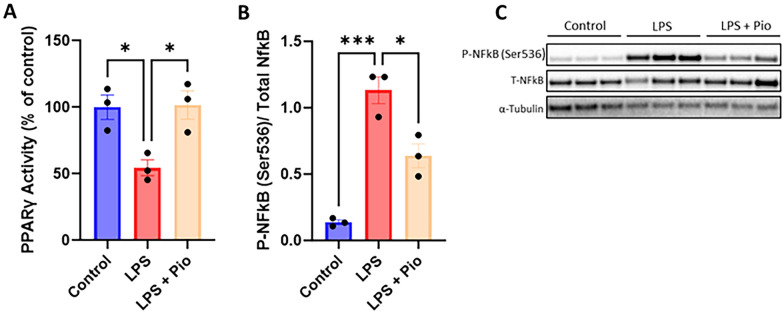
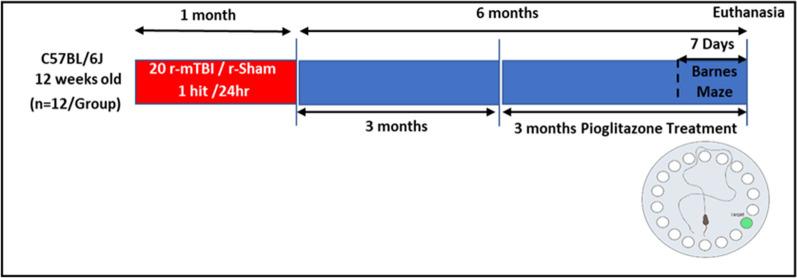
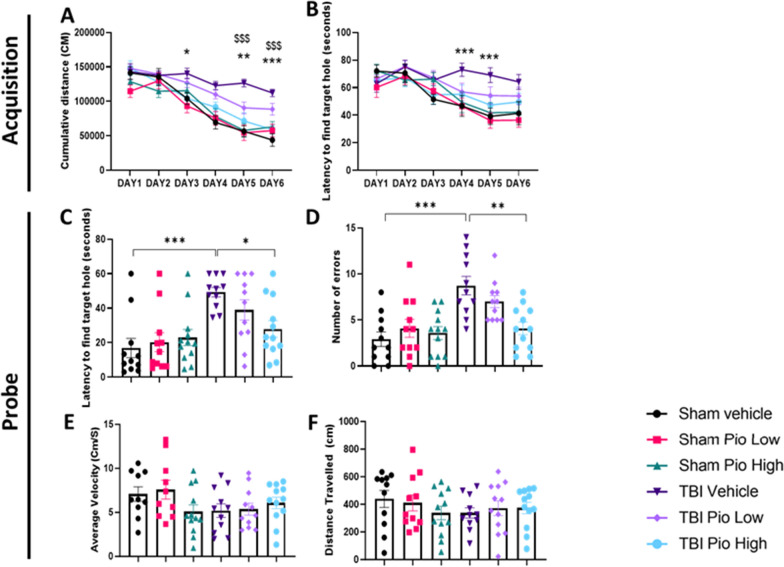
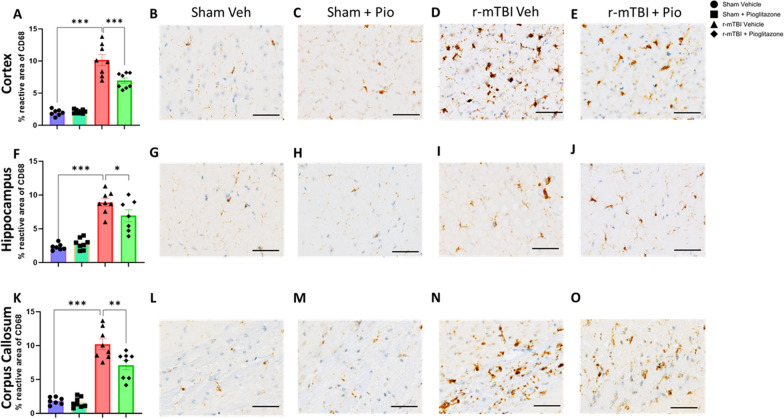
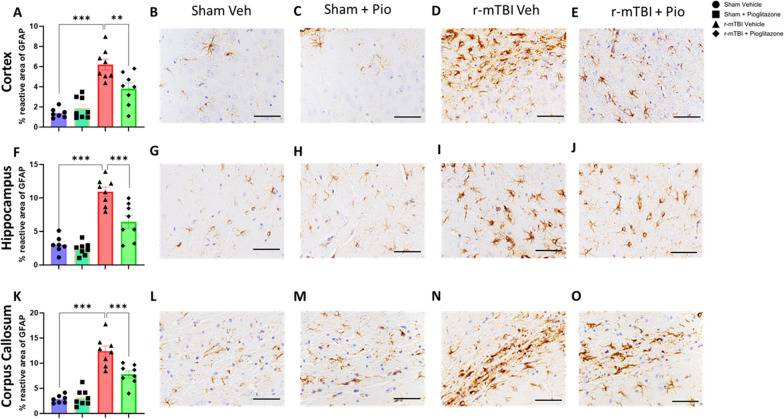
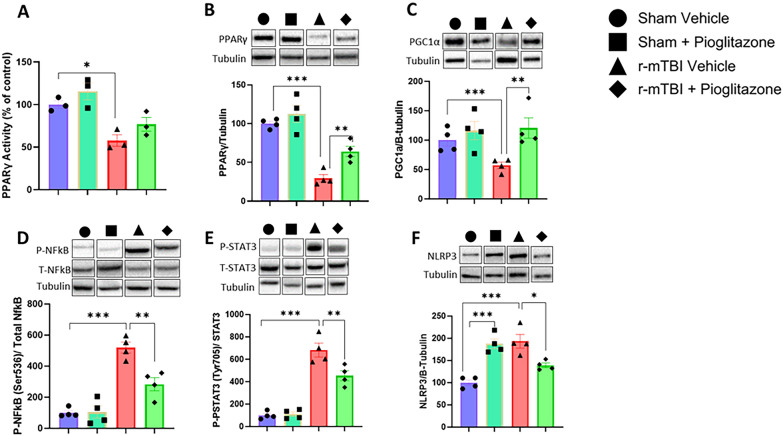
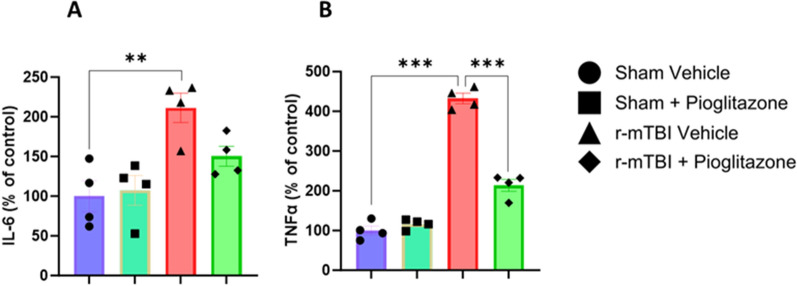
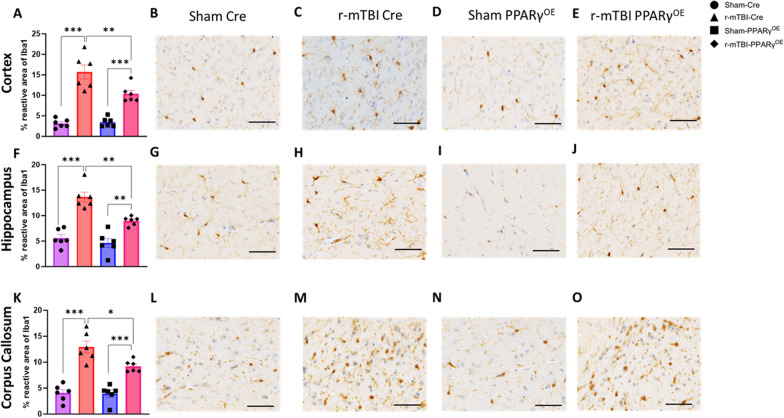
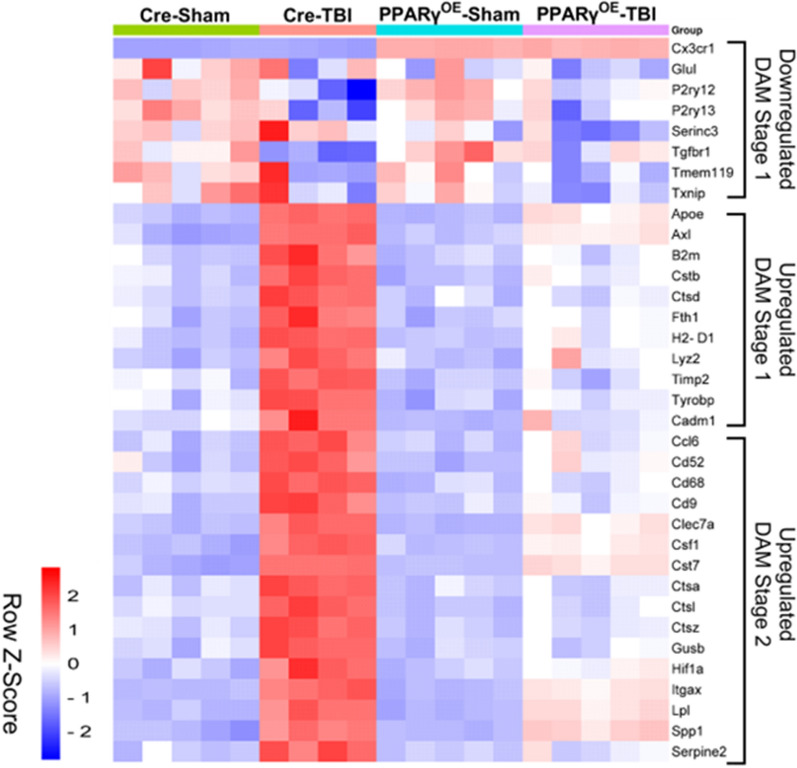
Chronic neuroinflammation and microglial activation are key mediators of the secondary injury cascades and cognitive impairment that follow exposure to repetitive mild traumatic brain injury (r-mTBI). Peroxisome proliferator-activated receptor-γ (PPARγ) is expressed on microglia and brain resident myeloid cell types and their signaling plays a major anti-inflammatory role in modulating microglial responses. At chronic timepoints following injury, constitutive PPARγ signaling is thought to be dysregulated, thus releasing the inhibitory brakes on chronically activated microglia. Increasing evidence suggests that thiazolidinediones (TZDs), a class of compounds approved from the treatment of diabetes mellitus, effectively reduce neuroinflammation and chronic microglial activation by activating the peroxisome proliferator-activated receptor-γ (PPARγ). The present study used a closed-head r-mTBI model to investigate the influence of the TZD Pioglitazone on cognitive function and neuroinflammation in the aftermath of r-mTBI exposure. We revealed that Pioglitazone treatment attenuated spatial learning and memory impairments at 6 months post-injury and reduced the expression of reactive microglia and astrocyte markers in the cortex, hippocampus, and corpus callosum. We then examined whether Pioglitazone treatment altered inflammatory signaling mechanisms in isolated microglia and confirmed downregulation of proinflammatory transcription factors and cytokine levels. To further investigate microglial-specific mechanisms underlying PPARγ-mediated neuroprotection, we generated a novel tamoxifen-inducible microglial-specific PPARγ overexpression mouse line and examined its influence on microglial phenotype following injury. Using RNA sequencing, we revealed that PPARγ overexpression ameliorates microglial activation, promotes the activation of pathways associated with wound healing and tissue repair (such as: IL10, IL4 and NGF pathways), and inhibits the adoption of a disease-associated microglia-like (DAM-like) phenotype. This study provides insight into the role of PPARγ as a critical regulator of the neuroinflammatory cascade that follows r-mTBI in mice and demonstrates that the use of PPARγ agonists such as Pioglitazone and newer generation TZDs hold strong therapeutic potential to prevent the chronic neurodegenerative sequelae of r-mTBI.


Conflict of interest statement

The authors declare they have no competing interests.

Figures

Fig. 1
Fig. 1
PPARγ activation reduces the LPS-induced inflammatory response in microglia. Immortalised microglia (IMG) were exposed to LPS (10 ng/ml) or LPS (10 ng/ml) and Pioglitazone (10 µM) for 24 h before harvesting. A Assessment of PPARγ transcriptional activity in IMG cells following control, LPS, or LPS + Pioglitazone treatment. B Quantification of the Phosphorylated NFκB (Ser536) to total NFκB ratio in microglial cell lysates following exposure to control, LPS, or LPS + Pioglitazone treatment for 24 h. C Representative immunoblot image showing the protein expression of Phospho and total NFκB in microglia. α-Tubulin served as a loading control. Data were analyzed by a one-way ANOVA followed by Tukey’s correction for multiple comparisons (n = 3/group). Asterisks denote statistical significance as follows: *p < 0.05, ***p < 0.001
Fig. 2
Fig. 2
Schematic representation of the experimental timeline. At 12 weeks of age, male C57BL6/J mice were exposed to our 20-hit r-mTBI paradigm consisting of five injuries per week for four weeks. Injuries were separated by 24 h. At three months post-last injury, sham and injured mice were randomly selected for low or high dose Pioglitazone treatment for three months. At one week prior to the end of treatment, spatial memory and learning function was assessed using the Barnes maze
Fig. 3
Fig. 3
PPARγ activation ameliorates r-mTBI associated memory and learning deficits. Acquisition data shows learning across the six acquistion phase by the mean cumulative distance to the target hole in cm (A), and the mean latency to find the target hole (B). Probe data shows the mean latency to find the target hole (C), number of errors (D), average velocity (E), and total distance traveled (F). Acquisition trials (A, B) were analyzed using a repeated measures three-way ANOVA followed by Tukey’s correction for multiple comparisons (n = 10–12/group). Probe data (C-F) were analyzed using a two-way ANOVA followed by by Tukey’s correction for multiple comparisons. Asterisks denote statistical significance between TBI vehicle and sham vehicle treated mice as follows: *p < 0.05, **p < 0.01, ***p < 0.001. $ denote statistical significance between TBI High dose and TBI vehicle treated mice as follows: $p < 0.05, $$p < 0.01, $$$p < 0.001. Values are expressed as mean ± SEM
Fig. 4
Fig. 4
Effect of PPARγ activation by Pioglitazone on microglial activation (Ionized calcium binding adaptor molecule 1 [Iba1]) at 6 months post r-mTBI. Quantitation and representative microscope images of Iba1+ve immunoreactive area in the cortex (AE), hippocampus (FJ), and Corpus Callosum (KO) (n = 7/8 per group). Data were analyzed using a two-way ANOVA followed by Tukey’s correction for multiple comparisons. All data are expressed as mean ± SEM percentage reactive area
Fig. 5
Fig. 5
Effect of PPARγ activation by Pioglitazone on microglial activation (Cluster of differentiation 68 [CD68]) at six months post r-mTBI. Quantitation and representative microscope images of CD68+ve immunoreactive area in the cortex (AE), hippocampus (FJ), and Corpus Callosum (K–O) (n = 7/8 per group). Data were analyzed using a two-way ANOVA followed by Tukey’s correction for multiple comparisons. All data are expressed as mean ± SEM percentage reactive area
Fig. 6
Fig. 6
Effect of PPARγ activation by Pioglitazone on astrocyte activation (Glial fibrillary acid protein [GFAP]) at six months post r-mTBI. Quantitation and representative microscope images of GFAP+ve immunoreactive area in the cortex (AE), hippocampus (FJ), and Corpus Callosum (K–O) (n = 7/8 per group). Data were analyzed using a two-way ANOVA followed by Tukey’s correction for multiple comparisons. All data are expressed as mean ± SEM percentage reactive area
Fig. 7
Fig. 7
Pioglitazone treatment rescues microglial PPARγ signaling and reduces inflammatory signaling. A Quantitation of PPARγ transcriptional activity in isolated microglia. Quantitation and representative immunoblots of PPARγ (B), PGC1α (C), Phospho NFκB (Ser536) (D), Phospho STAT3 (Tyr705) (E), and NLRP3 (F) in microglia isolated at six months post last injury from sham and injured mice who received Pioglitazone or vehicle treatment (n = 4/group). (B) (n = 3/group). Data were analyzed using a two-way ANOVA followed by Tukey’s correction for multiple comparisons. All data are expressed as mean ± SEM percentage of control
Fig. 8
Fig. 8
PPARγ activation reduces chronic microglial pro-inflammatory cytokine production following exposure to r-mTBI. Microglia were isolated from sham and injured mice who received Pioglitazone (50ppm chow) or vehicle treatment and the concentrations of IL-6 (A) and TNFα (B) in cell lysates were assessed using the MSD multiplex cytokine array (n = 4/group). Data were analyzed using a two-way ANOVA followed by Tukey’s correction for multiple comparisons. All data are expressed as mean ± SEM percentage of control
Fig. 9
Fig. 9
Generation of a tamoxifen inducible microglial-specific PPARγ overexpression mouse line. A, B Graphic showing the generation of conditional PPARγ overexpressing mice and how tamoxifen treatment induces cre recombination in mcgPPARγOE mice. C To validate that tamoxifen treatment was able to induce cre-recombination, non-injured mcgPPARγOE mice received Tamoxifen (50mg/kg) or vehicle treatment for 5 days and the transcriptional activity of PPARγ in isolated microglia was assessed. D Quantitation and representative immunoblot of PPARγ expression in microglia isolated from vehicle and Tamoxifen treated mice (n = 5–11/group) E Graphic showing the experimental schedule. After validating that our treatment paradigm was sufficient to induce microglial PPARγ overexpression, 8 week old mcgPPARγOE and CX3CR1CreERt2+/+ (Cre) mice received Tamoxifen for 5 days. At 12 weeks old, mice were exposed to our 20-hit r-mTBI paradigm or sham procedure. At 30 days post last injury all mice were euthanised and the brain tissue was processed for histopathology or microglia were isolated from the brain tissue for RNA sequencing
Fig. 10
Fig. 10
Microglial-specific PPARγ overexpression reduces microglial Iba1 immunoreactivity at one month post r-mTBI. Quantitation and representative microscope images of Iba1+ve immunoreactive area in the cortex (AE), hippocampus (FJ), and Corpus Callosum (K–O) of mcg-PPARγOE and CX3CR1CreERt2+/+ (Cre) (n = 6 per group). Data were analyzed using a two-way ANOVA followed by Tukey’s correction for multiple comparisons. All data are expressed as mean ± SEM percentage reactive area
Fig. 11
Fig. 11
Microglial-specific PPARγ overexpression reduces microglial CD68 immunoreactivity at one month post r-mTBI. Quantitation and representative microscope images of CD68+ve immunoreactive area in the cortex (AE), hippocampus (FJ), and Corpus Callosum (K–O) of mcg-PPARγOE and CX3CR1CreERt2+/+ (Cre) (n = 6 per group). Data were analyzed using a two-way ANOVA followed by Tukey’s correction for multiple comparisons. All data are expressed as mean ± SEM percentage reactive area
Fig. 12
Fig. 12
Microglial-specific PPARγ overexpression reduces astrocyte GFAP immunoreactivity at one month post r-mTBI. Quantitation and representative microscope images of GFAP+ve immunoreactive area in the cortex (AE), hippocampus (FJ), and Corpus Callosum (K–O) of mcg-PPARγOE and CX3CR1CreERt2+/+ (Cre) (n = 6 per group). Data were analyzed using a two-way ANOVA followed by Tukey’s correction for multiple comparisons. All data are expressed as mean ± SEM percentage reactive area
Fig. 13
Fig. 13
PPARγ overexpression modifies the microglial response to r-mTBI. Volcano plots of injury-induced differential gene expression and histograms showing IPA gene enrichment of altered biological pathways in isolated microglia between injured and sham CX3CR1CreERt2+/+- VP16-PPARγWT/WT (Cre) mice (A, B), injured and sham mcgPPARγOE mice (C, D), and injured mcgPPARγOE vs injured CX3CR1CreERt2+/+ mice (E, F), respectively (n = 4–5/group). Histograms show activation and inhibition of biological pathways by Z-score, corresponding heatmaps show the significance of pathway enrichement as − Log10 pValue
Fig. 14
Fig. 14
Microglial PPARγ overexpression prevents the adoption of a disease associated microglia-like (DAM-like) phenotype at 30 days post r-mTBI. Heatmap depicting the expression of DAM genes (rows) across CX3CR1CreERt2+/+ (Cre) and mcgPPARγOE mice (n = 4–5/group) who received r-mTBI or sham procedures (columns). Data are expressed as row z-score (red corresponds to gene upregulation and blue to downregulation)

References

    1. Afgan E, Baker D, Batut B, van den Beek M, Bouvier D, Čech M, Chilton J, Clements D, Coraor N, Grüning BA, Guerler A, Hillman-Jackson J, Hiltemann S, Jalili V, Rasche H, Soranzo N, Goecks J, Taylor J, Nekrutenko A, Blankenberg D. The Galaxy platform for accessible, reproducible and collaborative biomedical analyses: 2018 update. Nucleic Acids Res. 2018;46(W1):W537–44. 10.1093/nar/gky379. 10.1093/nar/gky379 - DOI - PMC - PubMed
    1. Afonina IS, Zhong Z, Karin M, Beyaert R. Limiting inflammation—the negative regulation of NF-κB and the NLRP3 inflammasome. Nat Immunol. 2017;18(8):861–9. 10.1038/ni.3772. 10.1038/ni.3772 - DOI - PubMed
    1. Andrews S. FastQC: A quality control tool for High-Throughput sequence data. 2010. http://www.bioinformatics.babraham.ac.uk/Projects/Fastqc/. Accessed 19 Nov 2023.
    1. Apolloni S, Milani M, D’Ambrosi N. Neuroinflammation in Friedreich’s ataxia. Int J Mol Sci. 2022;23(11):6297. 10.3390/ijms23116297. 10.3390/ijms23116297 - DOI - PMC - PubMed
    1. Bai H, Yang B, Yu W, Xiao Y, Yu D, Zhang Q. Cathepsin B links oxidative stress to the activation of NLRP3 inflammasome. Exp Cell Res. 2018;362(1):180–7. 10.1016/j.yexcr.2017.11.015. 10.1016/j.yexcr.2017.11.015 - DOI - PubMed

LinkOut - more resources