. 2024 Dec;82(4):3763-3780.
doi: 10.1007/s12013-024-01463-x. Epub 2024 Aug 4.

Iron Overloading Potentiates the Antitumor Activity of 5-Fluorouracil by Promoting Apoptosis and Ferroptosis in Colorectal Cancer Cells

Affiliations

Iron Overloading Potentiates the Antitumor Activity of 5-Fluorouracil by Promoting Apoptosis and Ferroptosis in Colorectal Cancer Cells

Bilal Rah et al. Cell Biochem Biophys. 2024 Dec.

Abstract

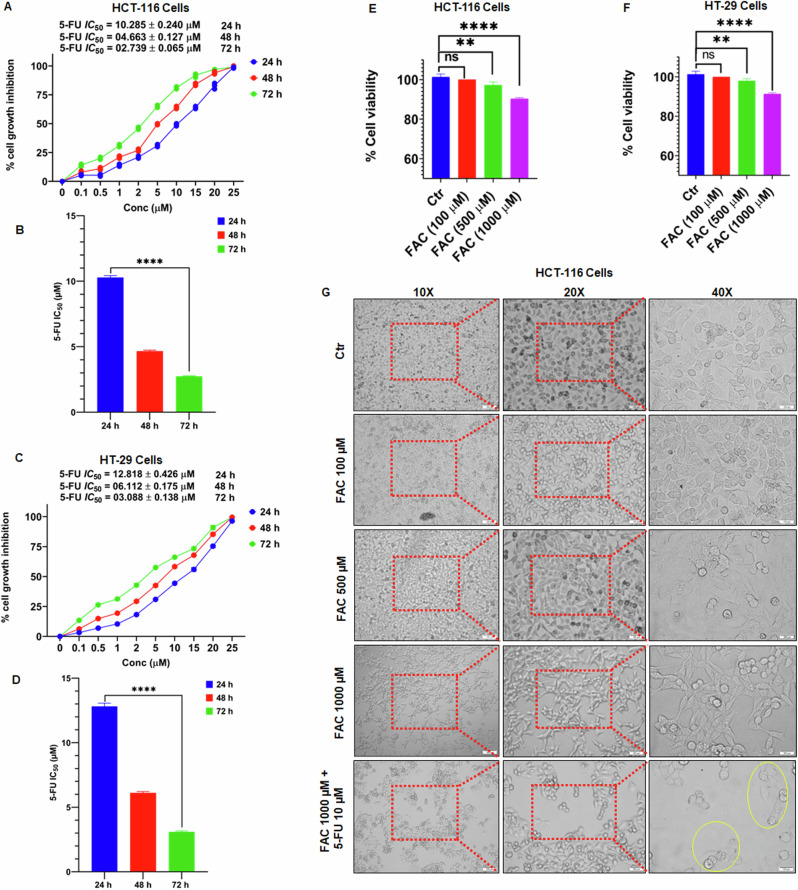
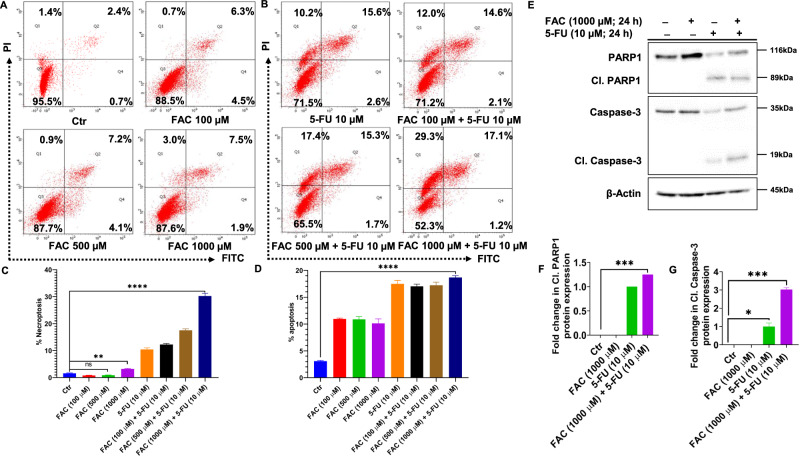
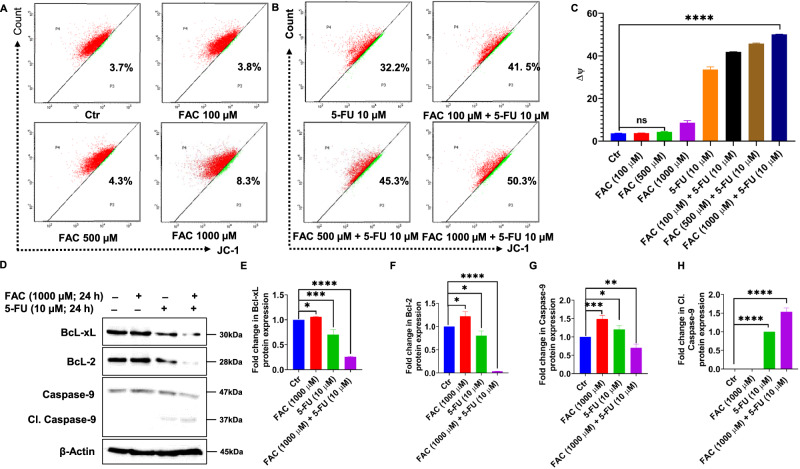
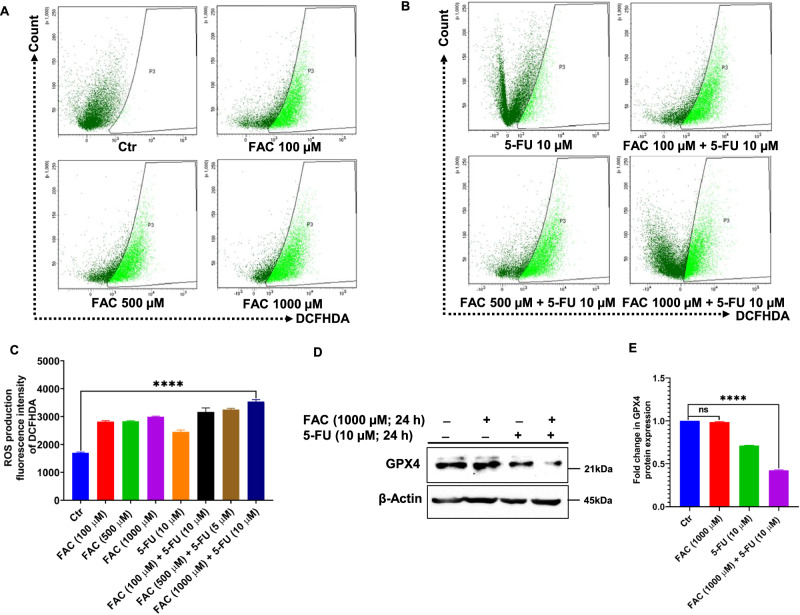
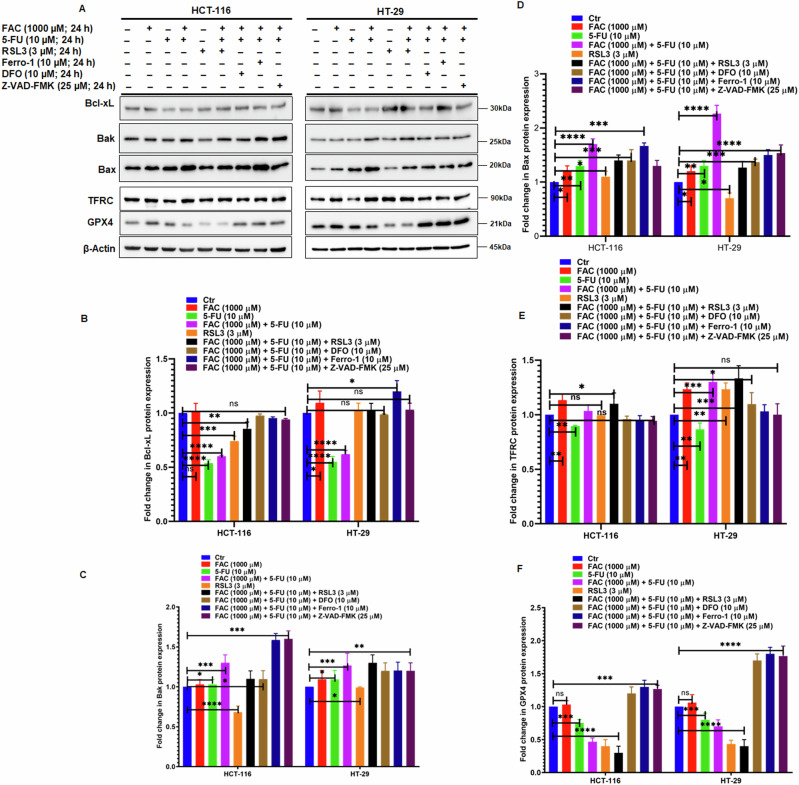
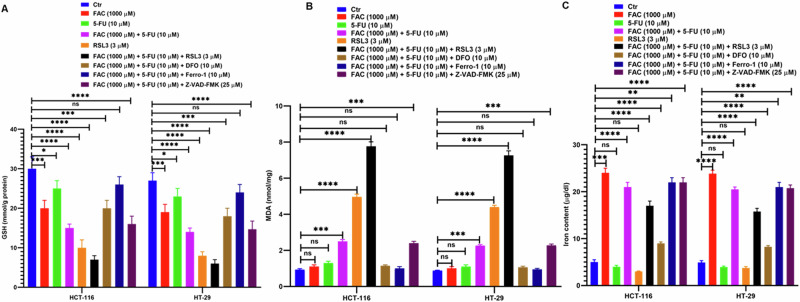
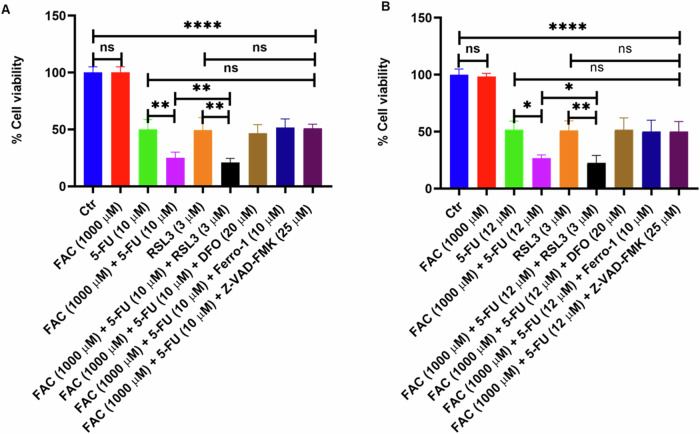
Resistance to 5-fluorouracil (5-FU) remains a significant challenge in colorectal cancer (CRC) treatment. Ferric ammonium citrate (FAC) is commonly used as an iron supplement due to its food-fortification properties; however, its potential role as a chemosensitizer in cancer therapy has not been studied. In this study, we explored the ability of FAC to sensitize CRC cells and increase their susceptibility to 5-FU-mediated anticancer effects. We assessed cell viability, cell cycle progression, apoptosis, mitochondrial membrane potential (MMP), reactive oxygen species (ROS) levels, ferroptosis, and iron metabolism-related protein expression using two CRC cell lines. Additionally, we conducted in silico analyses to compare iron markers in normal colon and CRC tumor tissues. Compared to controls, CRC cells pretreated with FAC and then treated with 5-FU exhibited significantly reduced growth and viability, along with increased ROS-mediated ferroptosis. Mechanistically, FAC-pretreated then 5-FU-treated CRC cells showed enhanced apoptosis, increased Bak/Bax expression, MMP depolarization, and decreased antiapoptotic protein levels (Bcl-2 and Bcl-xL). This combined treatment also led to G2/M cell cycle arrest, upregulation of p21 and p27, and downregulation of cyclin D1, c-Myc, survivin, and GPX4. Analysis of human colon tumor tissue revealed decreased expression of IRP-1, HMOX-1, and FTH1 but increased HAMP expression. In contrast, FAC-pretreated/5-FU-treated CRC cells exhibited a reverse pattern, suggesting that FAC-induced chemosensitization enhances 5-FU-mediated anticancer activity in CRC by disrupting iron homeostasis. These findings highlight the potential of iron overload as a chemosensitization strategy for improving CRC chemotherapy.

Keywords: Apoptosis; Chemosensitivity; Colorectal cancer; Ferric ammonium citrate; Ferroptosis; Iron overload.


Conflict of interest statement

Compliance with ethical standards Conflict of interest The authors declare no competing interests.

Figures

Fig. 1
Fig. 1
Antiproliferative effects of 5-FU and FAC in HCT-116 and HT-29 cells. Dose and time-dependent cell viability in 5-FU-treated (A) HCT-116 and (C) HT-29 cells at 24, 48, and 72 h. Bar diagram of 5-FU IC50 values at 24, 48, and 72 h in (B) HCT-116 and (D) HT-29 cells. Cell viability of (E) HCT-116 and (F) HT-29 cells treated with 100, 500, or 1000 μM FAC for 24 h. G Representative phase-contrast micrographs taken at 10X, 20X, and 40X of HCT-116 treated with 5-FU, FAC for 24 h. Data represent the mean value ± SE of at least three independent experiments. A significant change from the control is indicated by *p ≤ 0.05, **p ≤ 0.01 and ****p ≤ 0.0001
Fig. 2
Fig. 2
A combination of FAC and 5-FU potentiates the antiproliferative effect in HCT-116 and HT-29 cells. Cell viability determined by MTT assay in (A) HCT-116 and (B) HT-29 cells exposed to FAC (100, 500, 1000 μM) alone, FAC (100, 500, 1000 μM) + 5-FU (10 μM), 5-FU (10 μM) alone for 24 h. C Representative phase-contrast micrographs taken at 10X, 20X, and 40X of HCT-116 treated with FAC (1000 μM), 5-FU (10 μM), (FAC 1000 μM + 5-FU) for 24 h. D Expression status of iron regulatory proteins IRP-1, HMOX-1, hepcidin, and FTH-1 in HCT-116 cell lysates treated with FAC (1000 μM), FAC (1000 μM) + 5-FU(10 μM), 5-FU (10 μM) for 24 h. Fold change in the expression of (E) IRP-1, (F) HMOX-1, (G) hepcidin, and (H) FTH-1 protein in HCT-116 cells treated with FAC (1000 μM), FAC (1000 μM) + 5-FU(10 μM), 5-FU (10 μM) for 24 h. (I) Analysis of TCGA database for the expression of IRP-1, HMOX-1, FTH1, and HAMP in primary colon adenocarcinoma. Data represents the mean value ± SE of at least three independent experiments. Significant change from the control is indicated by *p ≤ 0.05, **p ≤ 0.01 and ****p ≤ 0.0001
Fig. 3
Fig. 3
FAC pretreatment potentiates 5-FU-mediated cell death via apoptosis and necroptosis in HCT-116 cells. Quantification of apoptotic, necrotic, and normal cells from four different quadrants by Annexin V FITC and PI staining using flowcytometry in HCT-116 cells treated with (A) FAC (100, 500, 1000 μM) for 24 h or (B) FAC (100 μM) + 5-FU (10 μM), FAC (500 μM) + 5-FU (10 μM), FAC (1000 μM) + 5-FU (10 μM), 5-FU (10 μM) for 24 h. Bar diagram showing quantification of apoptotic and necroptotic cells in quadrants of HCT-116 cells treated with (C) FAC (100, 500, 1000 μM) for 24 h, (D) FAC (100 μM) + 5-FU (10 μM), FAC (500 μM) + 5-FU (10 μM), FAC (1000 μM) + 5-FU (10 μM), 5-FU (10 μM) for 24 h. E Immunoblotting of PARP1, caspase-3, and their respective cleaved products of HCT-116 cells treated with FAC (1000 μM), 5-FU (10 μM), FAC (1000 μM) + 5-FU(10 µM) for 24 h. Fold change in the expression protein level of (F) cleaved product of PARP1 and (G) cleaved product of caspase-3 in HCT-116 cells treated with FAC (1000 μM), FAC (1000 μM) + 5-FU (10 µM), 5-FU (10 μM) for 24 h. Data represent the mean value ± SE of at least three independent experiments. Significant change from the control is indicated by *p ≤ 0.05, **p ≤ 0.01 and ****p ≤ 0.0001
Fig. 4
Fig. 4
Combination (FAC + 5-FU) treatment depolarizes mitochondrial membrane potential (MMP) in HCT-116 cells. Quantification of depolarization of mitochondrial membrane potential and normal cells by JC-1 staining using flow cytometry in HCT-116 cells treated with (A) FAC (100, 500, 1000 μM) for 24 h or (B) FAC (1000 μM), FAC (100, 500, 1000 μM) + 5-FU (10 μM), 5-FU (10 μM) for 24 h. C Bar diagram showing quantification of JC-1 positive staining of HCT-116 cells treated with FAC (100, 500, 1000 μM) alone or in a combination of FAC (100, 500, 1000 μM) plus 5-FU (10 μM), 5-FU (10 μM) for 24 h. D Immunoblotting of proapoptotic caspase-9 and antiapoptotic proteins Bcl-2, Bcl-xL expression status in the cell lysates of HCT-116 cells treated with FAC (1000 μM), 5-FU (10 μM), (FAC (1000 μM) plus+ 5-FU(10 µM) for 24 h. Fold change in the expression of (E) Bcl-xL, (F) Bcl-2, (G) caspase-9 or (H) Cleaved caspase-9 protein in HCT-116 cells treated with FAC (1000 μM), FAC (1000 μM) plus+ 5-FU(10 µM), 5-FU (10 μM) for 24 h. Data represent the mean value ± SE of at least three independent experiments; Significant change from the control is indicated by *p ≤ 0.05, **p ≤ 0.01, and ****p ≤ 0.0001
Fig. 5
Fig. 5
FAC pretreatment and 5-FU treatment trigger a G2/M cell cycle arrest in HCT-116 cells. Cell cycle analysis by PI staining using flow cytometry in HCT-116 cells treated with (A) FAC (100, 500, 1000 μM) for 24 h, (B) FAC (100, 500, 1000 μM) + 5-FU (10 μM), 5-FU (10 μM) for 24 h. The bar diagram represents the quantification of (C) subG1, (D) G0-G1, (E) G2-M, and (F) S cells following treatment with FAC (100, 500, 1000 μM), FAC (100, 500, 1000 μM) + 5-FU (10 μM), 5-FU (10 μM) and no treatment for 24 h. Data represent the mean value ± SE of at least three independent experiments; Significant change from the control is indicated by *p ≤ 0.05, **p ≤ 0.01, and ****p ≤ 0.0001
Fig. 6
Fig. 6
FAC + 5-FU treatment modulates cell cycle regulatory and checkpoint proteins in HCT-116 cells. A Expression of checkpoint proteins (p21 and p27) and cell cycle regulatory proteins (cyclin D1, C-Myc, and survivin) in lysates obtained from CRC cells treated with FAC (1000 μM), 5-FU (10 μM), (FAC (1000 μM) + 5-FU (10 μM) and untreated cells left untreated for 24 h. Fold change in the expression of (B) checkpoint protein p21, (C) p27 (D) c-Myc (E) survivin, and (F) cyclin D1 in lysates obtained from CRC cells treated with FAC (1000 μM), 5-FU (10 μM), (FAC (1000 μM) + 5-FU (10 μM) for 24 h and untreated cells. Data represents the mean value ± SE of at least three independent experiments. Significant change from the control is indicated by *p ≤ 0.05, **p ≤ 0.01 and ****p ≤ 0.0001
Fig. 7
Fig. 7
FAC + 5-FU treatment induces oxidative stress-mediated reactive oxygen species (ROS) and ferroptosis in HCT-116 cells. ROS production in CRC cells treated with (A) FAC (100, 500, 1000 μM) alone or (B) FAC (100, 500, 1000 μM) + 5-FU (10 μM), 5-FU (10 μM) for 24 h; ROS production was determined by the DCFHDA staining flow cytometry-based method. C Bar diagram representing DCFHDA staining intensity based on 3 independent experiments as in (A) and (B). (D) Expression of GPX4 in lysates obtained from CRC cells treated with FAC (1000 μM), 5-FU (10 μM), (FAC (1000 μM) + 5-FU (10 μM) for 24 h, and untreated cells. E Fold change in GPX4 expression based on three independent experiments as in D. Significant change from the control is indicated by *p ≤ 0.05, **p ≤ 0.01 and ****p ≤ 0.0001
Fig. 8
Fig. 8
FAC and 5-FU combination promotes both apoptosis and ferroptosis in CRC cells. A Expression of antiapoptotic (Bcl-xL) and apoptotic proteins (Bak and Bax) and ferroptosis associated proteins (GPX4, and TFRC) in lysates obtained from CRC cells (HCT-116 and HT-29) treated with FAC (1000 μM), 5-FU (10 μM), (FAC (1000 μM) + 5-FU (10 μM), RSL3, RSL3 + (FAC (1000 μM) + 5-FU (10 μM), DFO + (FAC (1000 μM) + 5-FU (10 μM), Ferro-1 + (FAC (1000 μM) + 5-FU (10 μM), Z-VAD-FMK + (FAC (1000 μM) + 5-FU (10 μM), and left untreated for 24 h. Fold change in the expression of (B) Bcl-xL, (C) Bak (D) Bax (E) TFRC, and (F) GPX4 in cell lysates obtained from CRC (HCT-116 and HT-29) cells treated with FAC (1000 μM), 5-FU (10 μM), (FAC (1000 μM) + 5-FU (10 μM), RSL3, RSL3 + (FAC (1000 μM) + 5-FU (10 μM), DFO + (FAC (1000 μM) + 5-FU (10 μM), Ferro-1 + (FAC (1000 μM) + 5-FU (10 μM), Z-VAD-FMK + (FAC (1000 μM) + 5-FU (10 μM), and left untreated for 24 h. Data represents the mean value ± SE of at least three independent experiments. Significant change from the control is indicated by *p ≤ 0.05, **p ≤ 0.01 and ****p ≤ 0.0001
Fig. 9
Fig. 9
Determination of GSH, MDA and iron content in FAC and 5-FU combination treated CRC cells. Estimation of (A) GSH, (B) MDA, and (C) Iron content in HCT-116 and HT-29 cells exposed to FAC (1000 μM), 5-FU (10 μM), (FAC (1000 μM) + 5-FU (10 μM), RSL3, RSL3 + (FAC (1000 μM) + 5-FU (10 μM), DFO + (FAC (1000 μM) + 5-FU (10 μM), Ferro-1 + (FAC (1000 μM) + 5-FU (10 μM), Z-VAD-FMK + (FAC (1000 μM) + 5-FU (10 μM), and left untreated for 24 h. Data represents the mean value ± SE of at least three independent experiments. Significant change from the control is indicated by *p ≤ 0.05, **p ≤ 0.01, ***p ≤ 0.001 and ****p ≤ 0.0001
Fig. 10
Fig. 10
Cell viability of CRC cells exposed to ferroptosis and apoptosis inhibitors/activators in combination with FAC and 5-FU in HCT-116 and HT-29 cells. Cell viability determined by MTT assay in (A) HCT-116 and (B) HT-29 cells exposed with to FAC (1000 μM), 5-FU (10 μM), (FAC (1000 μM) + 5-FU (10 μM), RSL3, RSL3 + (FAC (1000 μM) + 5-FU (10 μM), DFO + (FAC (1000 μM) + 5-FU (10 μM), Ferro-1 + (FAC (1000 μM) + 5-FU (10 μM), Z-VAD-FMK + (FAC (1000 μM) + 5-FU (10 μM), and left untreated for 24 h. Data represents the mean value ± SE of at least three independent experiments. Significant change from the control is indicated by *p ≤ 0.05, **p ≤ 0.01 and ****p ≤ 0.0001

References

    1. Sawicki, T., Ruszkowska, M., Danielewicz, A., Niedźwiedzka, E., Arłukowicz, T., & Przybyłowicz, K. E. (2021). A review of colorectal cancer in terms of epidemiology, risk factors, development, symptoms and diagnosis. Cancers, 13, 2025. 10.3390/cancers13092025. - PMC - PubMed
    1. Narayan, S., Raza, A., Mahmud, I., Koo, N., Garrett, T. J., Law, M. E., Law, B. K., & Sharma, A. K. (2022). Sensitization of FOLFOX-resistant colorectal cancer cells via the modulation of a novel pathway involving protein phosphatase 2A. Iscience, 25, 104518. 10.1016/j.isci.2022.104518. - PMC - PubMed
    1. Wu, W., Geng, Z., Bai, H., Liu, T., & Zhang, B. (2021). Ammonium ferric citrate induced ferroptosis in non-small-cell lung carcinoma through the inhibition of GPX4-GSS/GSR-GGT axis activity. International Journal of Medical Sciences, 18, 1899. 10.7150/ijms.54860. - PMC - PubMed
    1. Pandrangi, S. L., Chittineedi, P., Chikati, R., Lingareddy, J. R., Nagoor, M., & Ponnada, S. K. (2022). Role of dietary iron revisited: In metabolism, ferroptosis and pathophysiology of cancer. American Journal of Cancer Research, 12, 974. - PMC - PubMed
    1. Xue, X., Ramakrishnan, S. K., Weisz, K., Triner, D., Xie, L., Attili, D., Pant, A., Győrffy, B., Zhan, M., & Carter-Su, C. (2016). Iron uptake via DMT1 integrates cell cycle with JAK-STAT3 signaling to promote colorectal tumorigenesis. Cell Metabolism, 24, 447–461. 10.1016/j.cmet.2016.07.015. - PMC - PubMed

MeSH terms