. 2024 Aug;30(8):e14836.
doi: 10.1111/cns.14836.

Deciphering the neuroprotective mechanisms of RACK1 in cerebral ischemia-reperfusion injury: Pioneering insights into mitochondrial autophagy and the PINK1/Parkin axis

Affiliations

Deciphering the neuroprotective mechanisms of RACK1 in cerebral ischemia-reperfusion injury: Pioneering insights into mitochondrial autophagy and the PINK1/Parkin axis

Lanqing Zhao et al. CNS Neurosci Ther. 2024 Aug.

Abstract

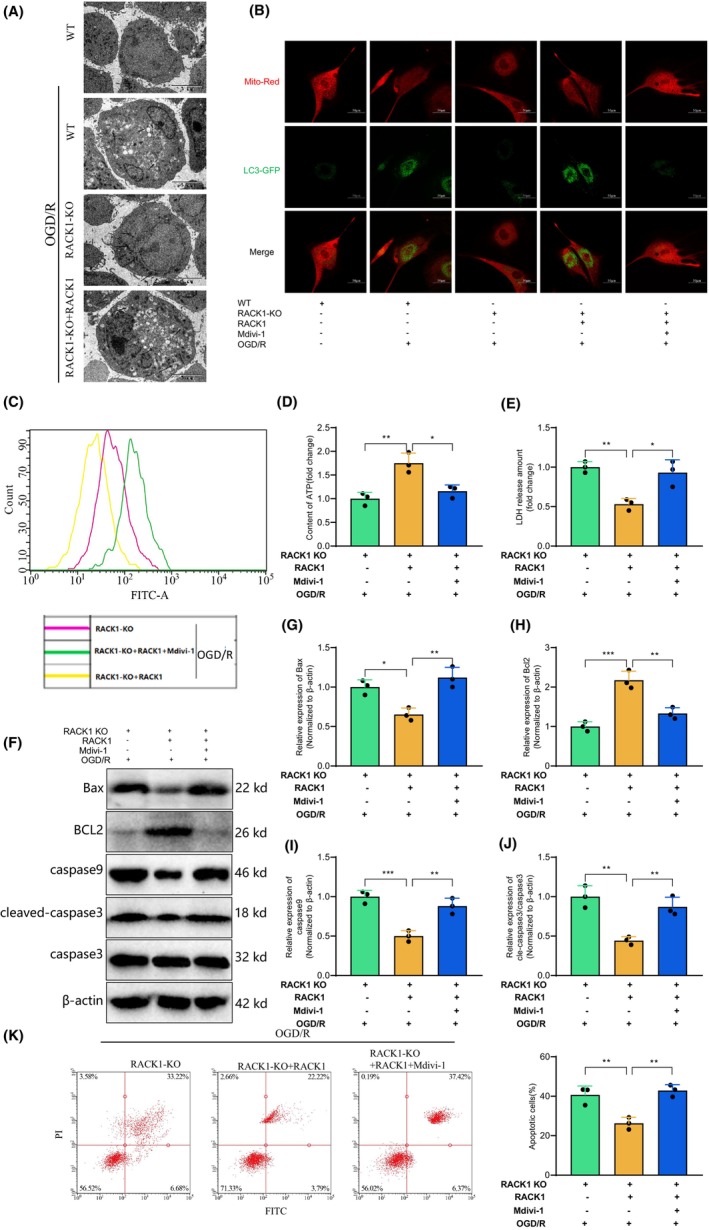
Introduction: Cerebral ischemia-reperfusion injury (CIRI) is a common and debilitating complication of cerebrovascular diseases such as stroke, characterized by mitochondrial dysfunction and cell apoptosis. Unraveling the molecular mechanisms behind these processes is essential for developing effective CIRI treatments. This study investigates the role of RACK1 (receptor for activated C kinase 1) in CIRI and its impact on mitochondrial autophagy.

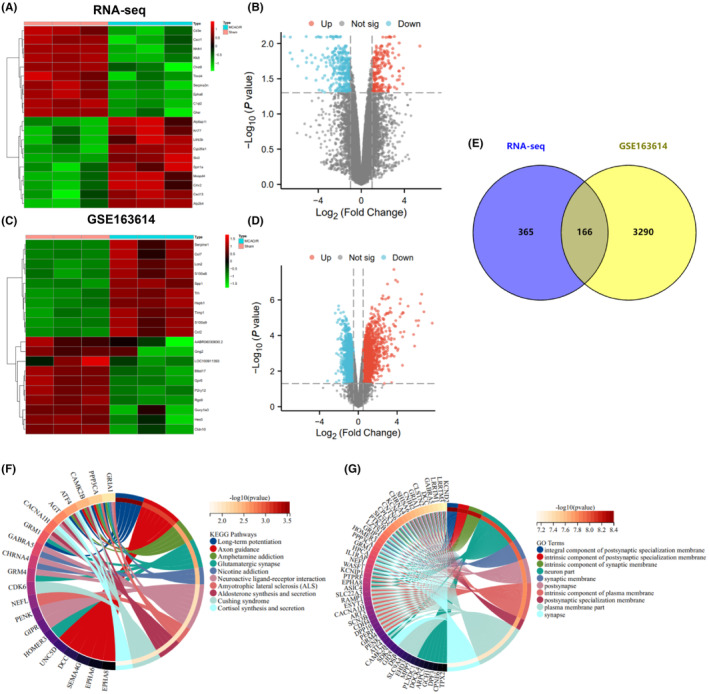
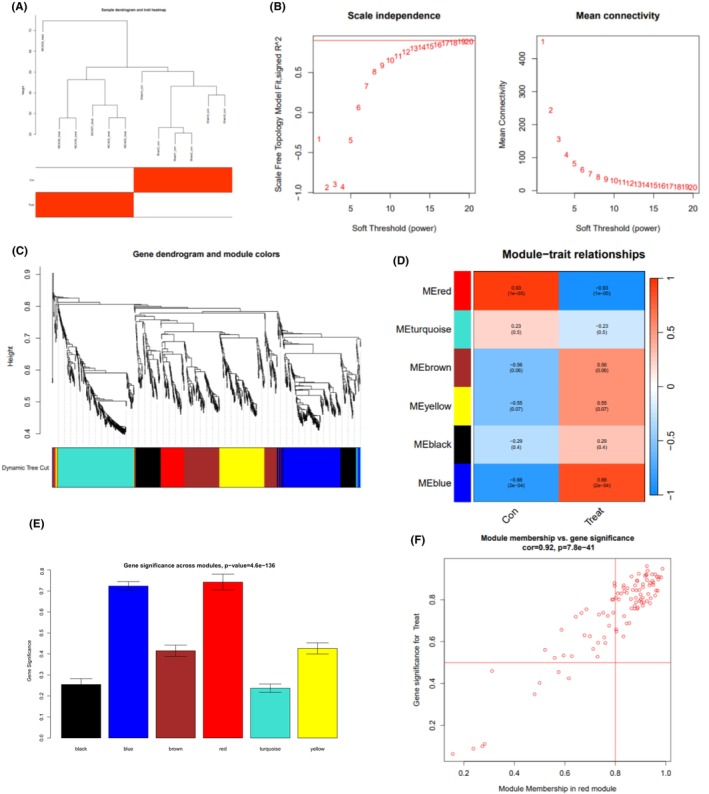
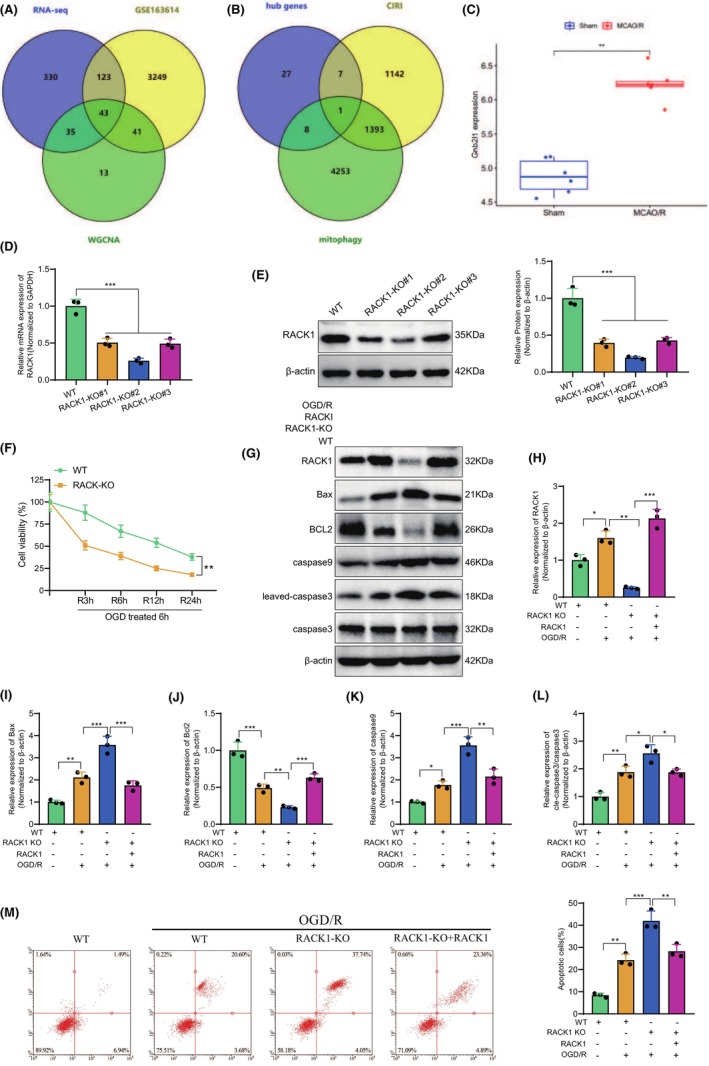
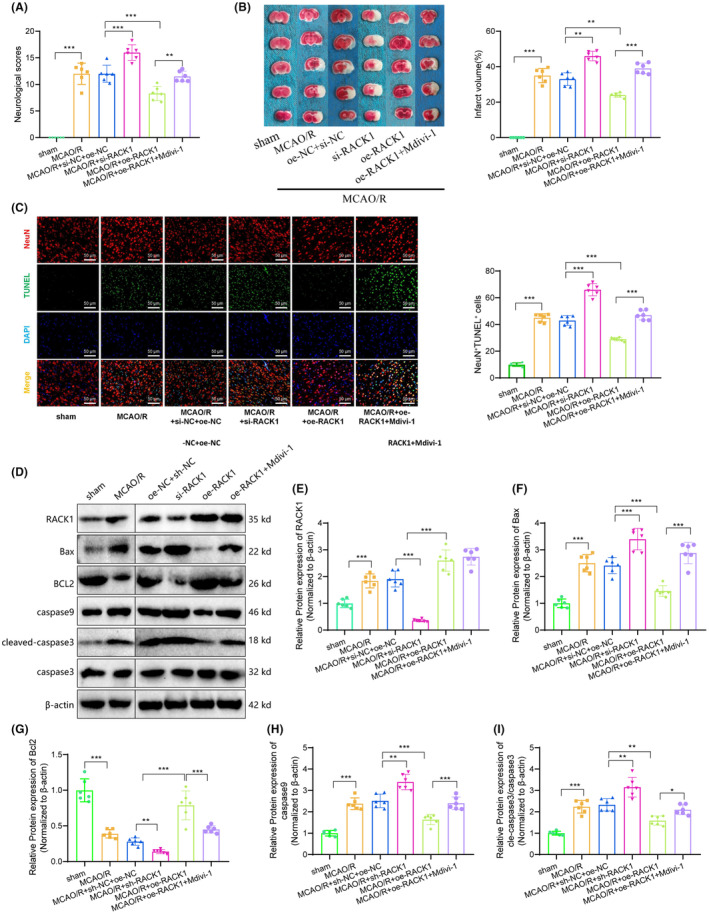
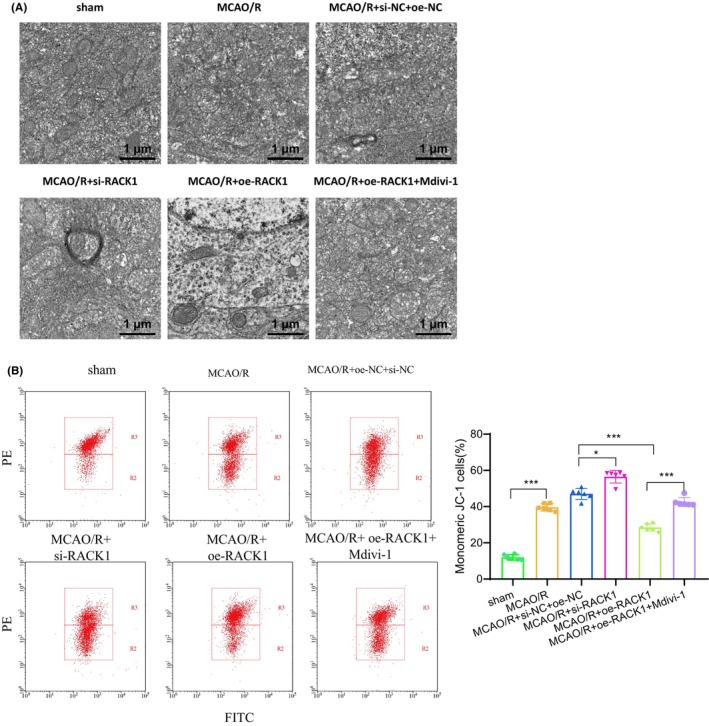
Methods: We utilized high-throughput transcriptome sequencing and weighted gene co-expression network analysis (WGCNA) to identify core genes associated with CIRI. In vitro experiments used human neuroblastoma SK-N-SH cells subjected to oxygen and glucose deprivation (OGD) to simulate ischemia, followed by reperfusion (OGD/R). RACK1 knockout cells were created using CRISPR/Cas9 technology, and cell viability, apoptosis, and mitochondrial function were assessed. In vivo experiments involved middle cerebral artery occlusion/reperfusion (MCAO/R) surgery in rats, evaluating neurological function and cell apoptosis.

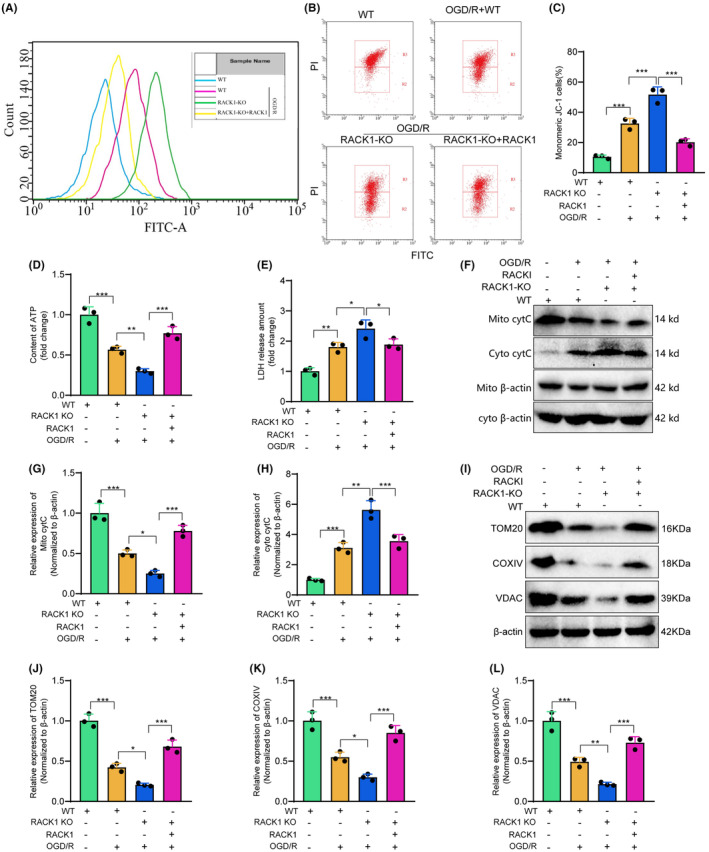
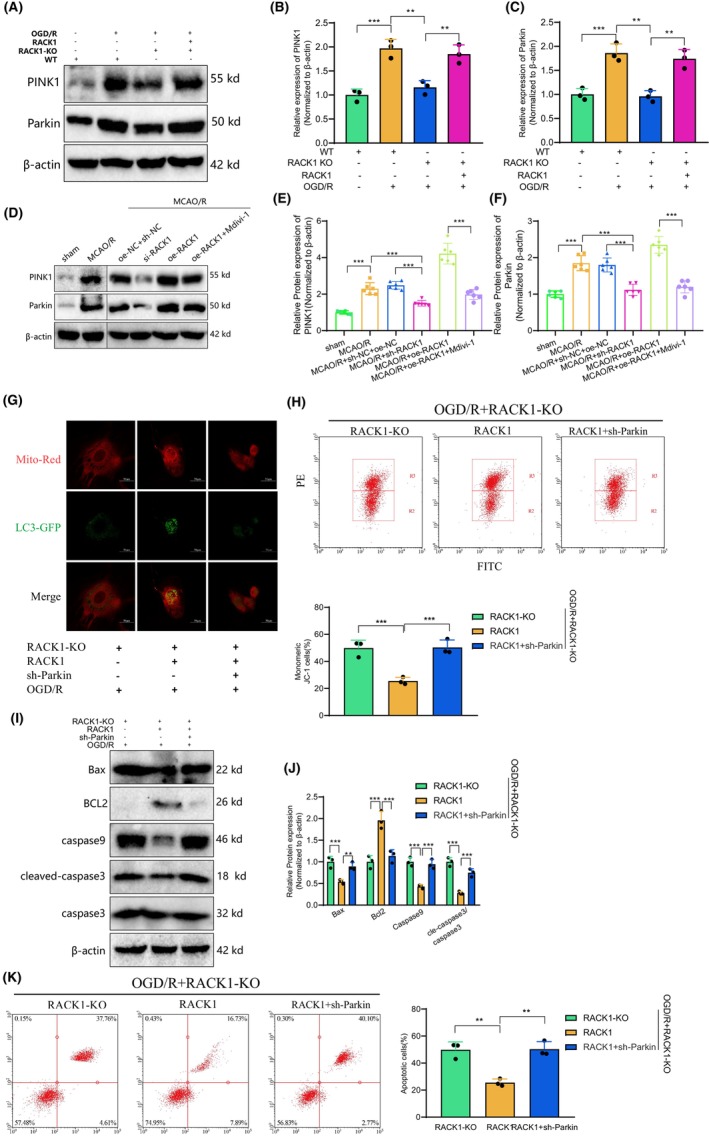
Results: Our findings revealed that RACK1 expression increases during CIRI and is protective by regulating mitochondrial autophagy through the PINK1/Parkin pathway. In vitro, RACK1 knockout exacerbated cell apoptosis, while overexpression of RACK1 reversed this process, enhancing mitochondrial function. In vivo, RACK1 overexpression reduced cerebral infarct volume and improved neurological deficits. The regulatory role of RACK1 depended on the PINK1/Parkin pathway, with RACK1 knockout inhibiting PINK1 and Parkin expression, while RACK1 overexpression restored them.

Conclusion: This study demonstrates that RACK1 safeguards against neural damage in CIRI by promoting mitochondrial autophagy through the PINK1/Parkin pathway. These findings offer crucial insights into the regulation of mitochondrial autophagy and cell apoptosis by RACK1, providing a promising foundation for future CIRI treatments.

Keywords: PINK/Parkin pathway; RACK1; cell apoptosis; cerebral ischemia‐reperfusion injury; mitochondrial autophagy; mitochondrial function; neuroprotection.


Conflict of interest statement

The author declares no conflict of interest.

Figures

FIGURE 1
FIGURE 1
Differential expression and molecular characterization of genes in MCAO/R rats identified by high‐throughput transcriptome sequencing. (A) Heatmap displaying the top 10 highly expressed genes and the top 10 lowly expressed genes based on logFC in the MCAO/R rat brain tissue from high‐throughput transcriptome sequencing; (B) Volcano plot displaying the upregulated and downregulated differentially expressed genes in the MCAO/R rat brain tissue from high‐throughput transcriptome sequencing (sham n = 3, MCAO/R n = 3); (C) Heatmap displaying the top 10 highly expressed genes and the top 10 lowly expressed genes based on logFC in the MCAO/R rat brain tissue from the GSE163614 dataset; (D) Volcano plot displaying the upregulated and downregulated differentially expressed genes in the MCAO/R rat brain tissue from the GSE163614 dataset (sham n = 3, MCAO/R n = 3); (E) Venn diagram showing the intersection of differentially expressed genes between the RNA‐seq data and the GSE163614 dataset; (F) KEGG enrichment analysis of the 166 intersecting differentially expressed genes; (G) GO enrichment analysis of the 166 intersecting differentially expressed genes.
FIGURE 2
FIGURE 2
Co‐expression gene module identification related to CIRI by WGCNA analysis. (A) Sample clustering analysis based on RNA‐seq and GSE163614 datasets; (B) Analysis of the scale‐free fitting index (left) and average connectivity (right) for various soft‐thresholding powers β; (C) Hierarchical clustering dendrogram of co‐expression genes, where each leaf on the dendrogram corresponds to a gene module and each color represents a gene module; (D) Heatmap of the Pearson correlation coefficients between the modules and the HCC phenotype, with each cell containing the corresponding correlation coefficient and p‐value; (E) Significance analysis of gene sets between modules; (F) Scatter plot of gene significance versus module membership (MM) for the genes in the red module.
FIGURE 3
FIGURE 3
The effect of RACK1 on OGD/R‐induced cell apoptosis. (A) Venn diagram showing the intersection of differentially expressed genes from RNA‐seq, GSE163614, and WGCNA analysis for co‐expression module genes; (B) Venn diagram showing the intersection of CIRI‐related genes and mitophagy‐related genes, with further intersection of 43 common genes to obtain the unique intersecting gene RACK1; (C) Expression profiles of RACK1 in the Sham group and the MCAO/R group in the RNA‐seq data and GSE163614 dataset (Sham n = 6, MCAO/R n = 6); (D) qRT‐PCR detection of RACK1 mRNA levels in different groups of cells; (E) Western blot analysis of RACK1 protein expression levels in different groups of cells; (F) CCK8 assay to assess cell viability changes in different groups after OGD/R treatment at different time points; (G) Western blot analysis of RACK1, Bax, Bcl2, caspase‐9, and cleaved‐caspase‐3 protein expression levels in different groups of cells; (H–L) Semi‐quantitative analysis of RACK1, Bax, Bcl2, caspase‐9, and cleaved‐caspase‐3 protein expression levels; (M) Flow cytometry analysis of cell apoptosis in different groups. p < 0.05, p < 0.01, **p < 0.001. The cell experiments were repeated three times.
FIGURE 4
FIGURE 4
The effect of RACK1 on OGD/R‐induced cell apoptosis through mitochondrial function. (A) Measurement of ROS levels in cells of different groups using ROS detection reagent; (B) Measurement of mitochondrial membrane potential in cells of different groups using JC‐1 staining; (C) Quantification of cells with monomeric JC‐1 staining; (D, E) Detection of ATP levels (D) and LDH release (E) in cells of different groups using respective assay kits; (F) Western blot analysis of cytochrome C expression changes in mitochondria and cytosol of cells from different groups; (G) Statistical analysis of mitochondrial cytochrome C changes; (H) Statistical analysis of cytosolic cytochrome C changes; (I) Western blot analysis of TOM20, COXIV, and VDAC expression changes in cells of different groups; (J–L) Semi‐quantitative analysis of TOM20, COXIV, and VDAC expression levels. p < 0.05, *p < 0.01. The cell experiments were repeated three times.
FIGURE 5
FIGURE 5
The effect of RACK1 on mitochondrial function and cell apoptosis through mitophagy. (A) TEM observation of mitochondrial autophagosomes in cells of different groups (bar = 1 μm); (B) Immunofluorescence co‐localization of mitochondria and autophagosomes; (C) Measurement of ROS levels in cells of different groups using ROS detection reagent; (D) Measurement of ATP levels in cells of different groups; (E) Measurement of LDH release in cells of different groups; (F) Western blot analysis of Bax, Bcl2, caspase‐9, and cleaved‐caspase‐3 protein expression levels in cells of different groups; (G–J) Semi‐quantitative analysis of Bax, Bcl2, caspase‐9, and cleaved‐caspase‐3 protein expression levels; (K) Flow cytometry analysis of cell apoptosis in different groups. p < 0.05, *p < 0.01. The cell experiments were repeated three times.
FIGURE 6
FIGURE 6
The effect of RACK1 on cell apoptosis and brain injury induced by MCAO/R. (A) Neurological damage scores of rats in different groups; (B) Measurement of ischemic brain area in rats of different groups using TTC staining; (C) Co‐staining of NeuN and TUNEL for the assessment of neuronal apoptosis; (D) Western blot analysis of RACK1, Bax, Bcl2, caspase‐9, and cleaved‐caspase‐3 protein expression levels in cells of different groups; (E–I) Semi‐quantitative analysis of RACK1, Bax, Bcl2, caspase‐9, and cleaved‐caspase‐3 protein expression levels. p < 0.05, *p < 0.01. Each group consisted of six rats.
FIGURE 7
FIGURE 7
The effect of RACK1 on mitochondrial injury induced by MCAO/R. (A) TEM observation of mitochondrial autophagy in rat brain tissues of different groups (bar = 1 μm); (B) Measurement of mitochondrial membrane potential changes in neurons of rat brain tissues using JC‐1 staining. *p < 0.05. Each group consisted of six rats.
FIGURE 8
FIGURE 8
Regulation of mitophagy by RACK1 through the PINK1/Parkin pathway. (A) Protein expression of PINK1 and Parkin detected by Western blot in each cell group; (B, C) Semi‐quantitative statistical analysis of PINK1 and Parkin protein expression; (D) Protein expression of PINK1 and Parkin detected by Western blot in rat brain tissues of each group; (E‐F) Semi‐quantitative statistical analysis of PINK1 and Parkin protein expression; (G) Immunofluorescence staining showing co‐localization of mitochondria and autophagosomes (bar = 10 μm); (H) JC‐1 staining to observe changes in mitochondrial membrane potential in each cell group; (I) Protein expression levels of Bax, Bcl2, caspase‐9, and cleaved‐caspase‐3 detected by Western blot in each cell group; (J) Semi‐quantitative analysis and statistical charts of Bax, Bcl2, caspase‐9, and cleaved‐caspase‐3; (K) Flow cytometry analysis of apoptosis in each cell group. p < 0.05, *p < 0.01. Animal experiments were performed using six rats. Cell experiments were repeated three times.

Similar articles

Cited by

References

    1. Zeng X, Zhang YD, Ma RY, et al. Activated Drp1 regulates p62‐mediated autophagic flux and aggravates inflammation in cerebral ischemia‐reperfusion via the ROS‐RIP1/RIP3‐exosome axis. Mil Med Res. 2022;9(1):25. doi:10.1186/s40779-022-00383-2 - DOI - PMC - PubMed
    1. Li M, Tang H, Li Z, Tang W. Emerging treatment strategies for cerebral ischemia‐reperfusion injury. Neuroscience. 2022;507:112‐124. doi:10.1016/j.neuroscience.2022.10.020 - DOI - PubMed
    1. Hui XR, Jin Q, He JM, Liu L, Zhao XP. Mechanism of Guanxinning against cerebral ischemia‐reperfusion injury in mice based on transcriptomic analysis. Zhongguo Zhong Yao Za Zhi. 2022;47(11):3015‐3022. doi:10.19540/j.cnki.cjcmm.20220322.402 - DOI - PubMed
    1. Kam W, Holmes DN, Hernandez AF, et al. Association of recent use of non‐vitamin K antagonist oral anticoagulants with intracranial hemorrhage among patients with acute ischemic stroke treated with Alteplase. JAMA. 2022;327(8):760‐771. doi:10.1001/jama.2022.0948 - DOI - PMC - PubMed
    1. Gong L, Tang Y, An R, Lin M, Chen L, Du J. RTN1‐C mediates cerebral ischemia/reperfusion injury via ER stress and mitochondria‐associated apoptosis pathways. Cell Death Dis. 2017;8(10):e3080. doi:10.1038/cddis.2017.465 - DOI - PMC - PubMed

Publication types

MeSH terms

LinkOut - more resources