. 2024 Aug:106:105268.
doi: 10.1016/j.ebiom.2024.105268. Epub 2024 Aug 3.

NR4A3 prevents diabetes induced atrial cardiomyopathy by maintaining mitochondrial energy metabolism and reducing oxidative stress

Affiliations

NR4A3 prevents diabetes induced atrial cardiomyopathy by maintaining mitochondrial energy metabolism and reducing oxidative stress

Hong Peng et al. EBioMedicine. 2024 Aug.

Abstract

Background: Atrial cardiomyopathy (ACM) is responsible for atrial fibrillation (AF) and thromboembolic events. Diabetes mellitus (DM) is an important risk factor for ACM. However, the potential mechanism between ACM and DM remains elusive.

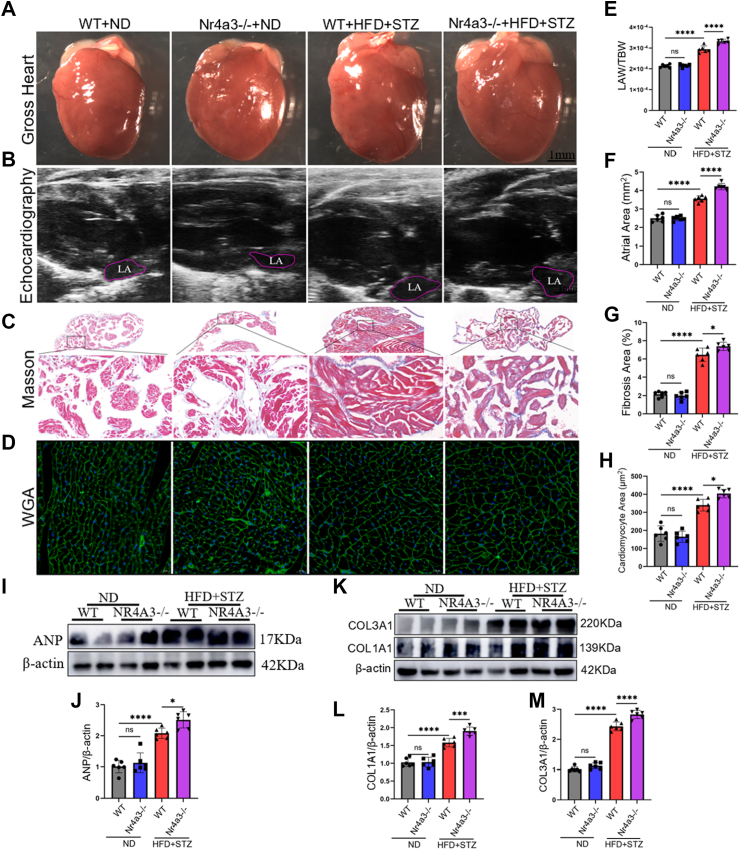
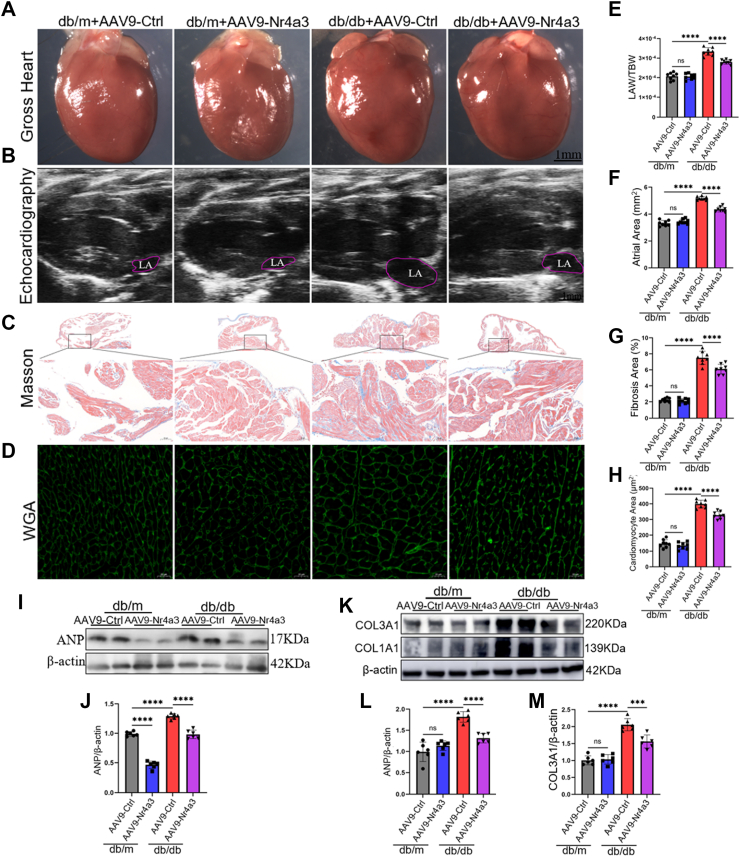
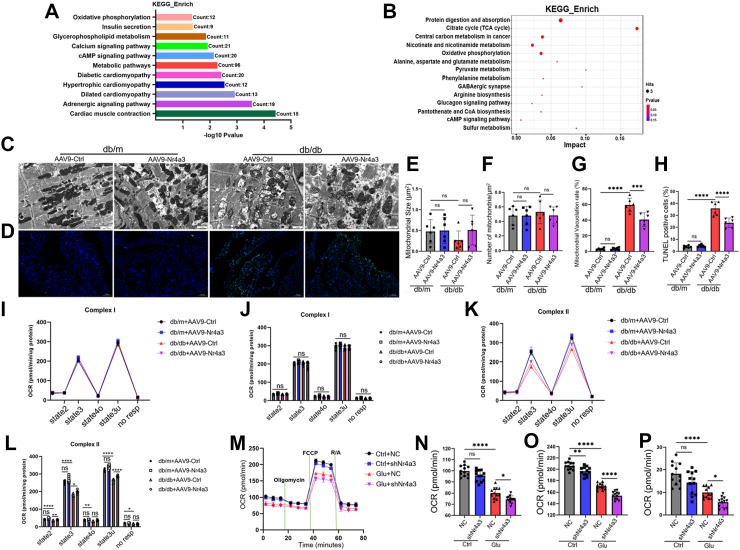
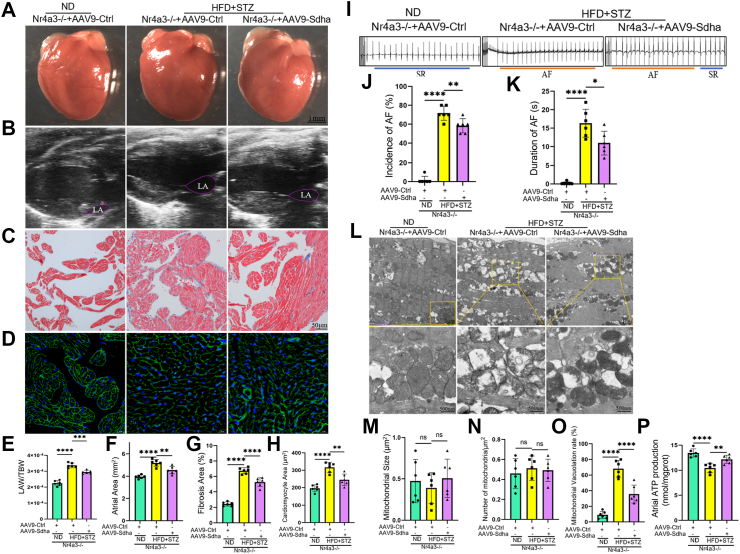
Methods: Atrial tissue samples were obtained from patients diagnosed with AF or sinus rhythm (SR) to assess alterations in NR4A3 expression, and then two distinct animal models were generated by subjecting Nr4a3-/- mice and WT mice to a high-fat diet (HFD) and Streptozotocin (STZ), while db/db mice were administered AAV9-Nr4a3 or AAV9-ctrl. Subsequently, in vivo and in vitro experiments were conducted to assess the impact of NR4A3 on diabetes-induced atrial remodeling through electrophysiological, biological, and histological analyses. RNA sequencing (RNA-seq) and metabolomics analysis were employed to unravel the downstream mechanisms.

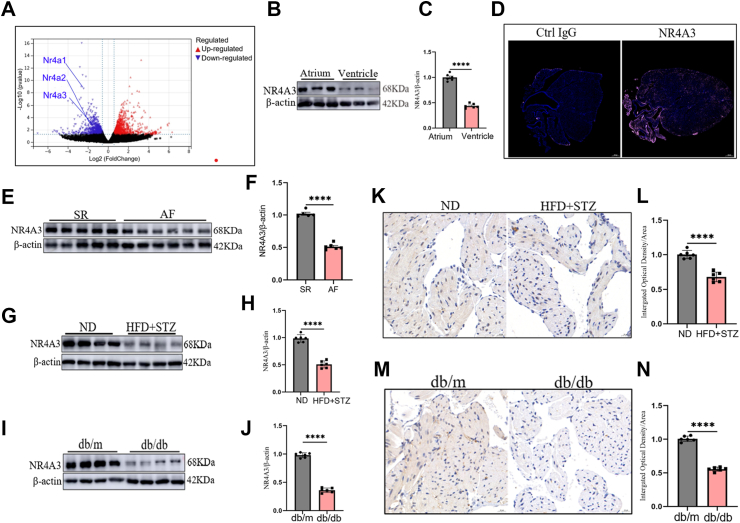
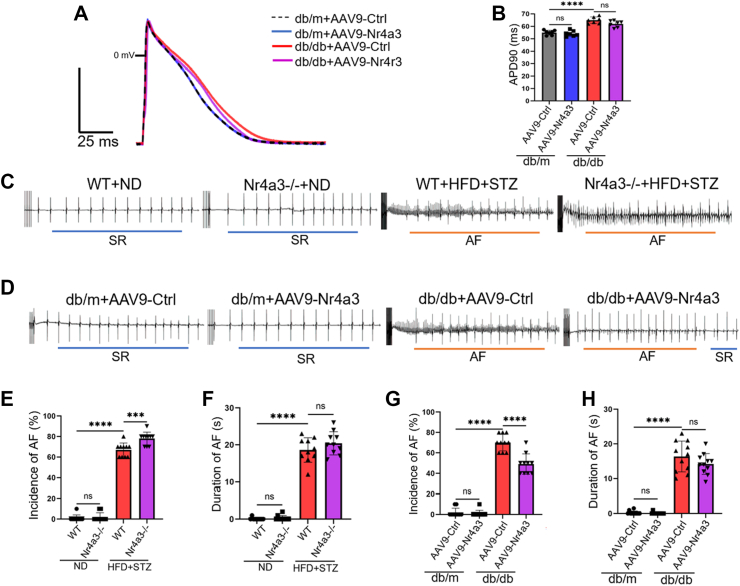
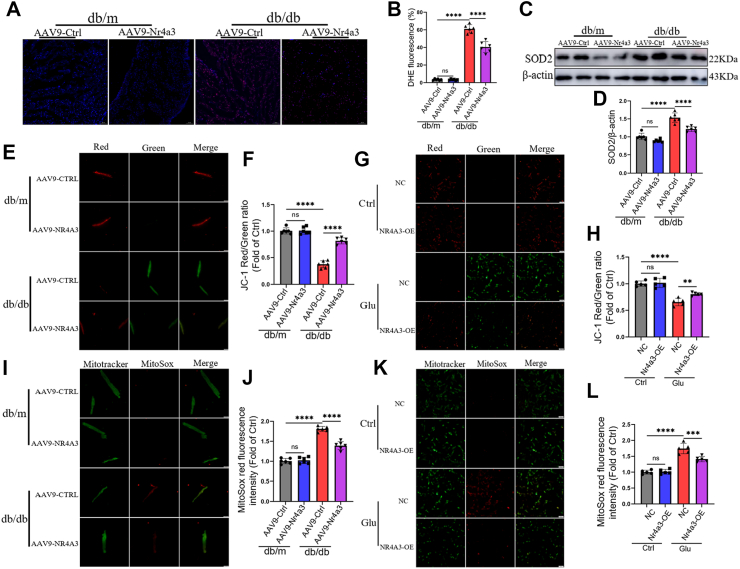
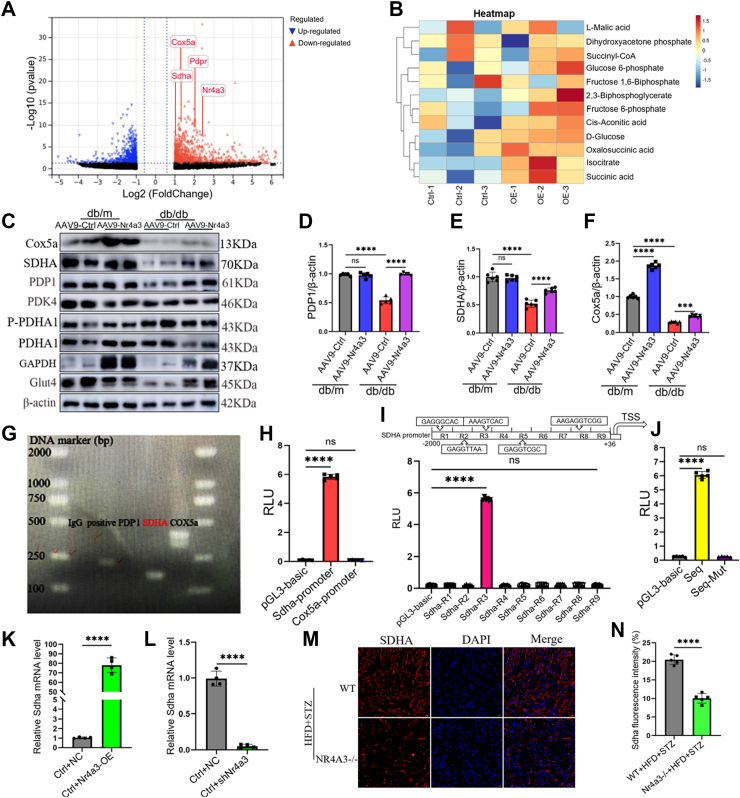
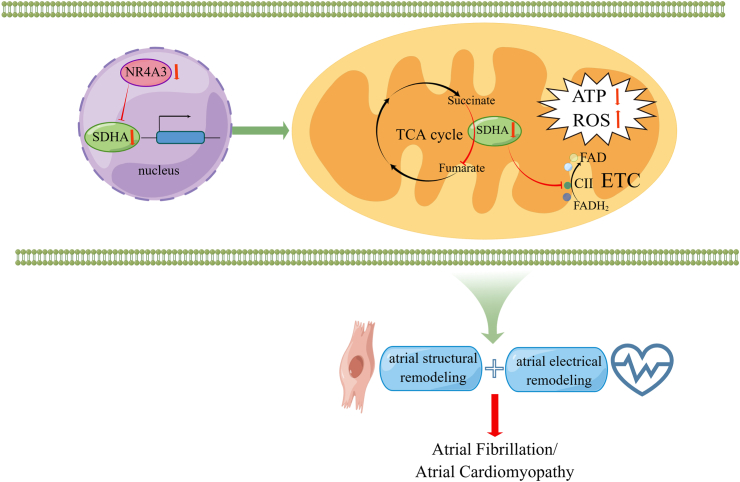
Findings: The expression of NR4A3 was significantly decreased in atrial tissues of both AF patients and diabetic mice compared to their respective control groups. NR4A3 deficiency exacerbated atrial hypertrophy and atrial fibrosis, and increased susceptibility to pacing-induced AF. Conversely, overexpression of NR4A3 alleviated atrial structural remodeling and reduced AF induction rate. Mechanistically, we confirmed that NR4A3 improves mitochondrial energy metabolism and reduces oxidative stress injury by preserving the transcriptional expression of Sdha, thereby exerting a protective influence on atrial remodeling induced by diabetes.

Interpretation: Our data confirm that NR4A3 plays a protective role in atrial remodeling caused by diabetes, so it may be a new target for treating ACM.

Funding: This study was supported by the major research program of National Natural Science Foundation of China (NSFC) No: 82370316 (to Q-S. W.), No. 81974041 (to Y-P. W.), and No. 82270447 (to Y-P. W.) and Fundation of Shanghai Hospital Development Center (No. SHDC2022CRD044 to Q-S. W.).

Keywords: Atrial cardiomyopathy; Atrial fibrillation; Energy metabolism; Mitochondria; NR4A3; Oxidative stress.


Conflict of interest statement

Declaration of interests The authors have declared that no conflict of interest exists.

Figures

Fig. 1
Fig. 1
NR4A3 is highly expressed in atrium and significantly decreased in atrial tissues from patients with AF and diabetic mice. (A) Volcanic plot of RNA seq in atrial tissue from WT and diabetic mice showing that the three members of NR4A family are significantly decreased in diabetic mice. (B and C) Immunoblotting (B) and quantitation (C) of NR4A3 protein expression in the atrium and ventricle of C57BL/6J WT mice (n = 6). (D) Representative immunofluorescence images of NR4A3 (pink), ctrl IgG (pink) and DAPI (blue) in the whole heart longitudinal section (scale bar = 500 μm). (E and F) Immunoblotting (E) and quantification (F) of Nr4a3 protein level in the atrial tissue from patients with sinus rhythm (SR) or atrial fibrillation (AF) (SR: n = 5, AF: n = 6). (G and H) Immunoblotting (G) and quantitation (H) of NR4A3 protein level in the atrial tissue of mice subjected to normal diet (ND) (n = 6) or high-fat diet (HFD) + STZ (n = 6). (I and J) Immunoblotting (I) and quantitation (J) of NR4A3 protein level in the atrial tissue samples from db/m mice (n = 6) or db/db mice (n = 6). (K and L) Representative images (K) and quantitation (L) of immunohistochemical staining of NR4A3 in the atrial tissue of mice subjected to ND (n = 6) or HFD + STZ (n = 6) (scale bar = 20 μm). (M and N) Representative images (M) and quantitation (N) of immunohistochemical staining of NR4A3 in the atrial tissue samples from db/m mice (n = 6) or db/db mice (n = 6) (scale bar = 20 μm). Data are expressed as mean ± SD, 2-tailed unpaired t test for (C–J), and the Mann–Whitney test expressed as standard deviations was used for (K-N); ∗P < 0.05, ∗∗P < 0.01, ∗∗∗P < 0.001, and ∗∗∗∗P < 0.0001.
Fig. 2
Fig. 2
NR4A3 deficiency aggravates atrial remodeling induced by T2DM. (A) Representative whole heart images of WT or Nr4a3-KO mice at 16 weeks after ND or HFD + STZ treatment (scale bar = 1 mm). (B) Representative images of 2-dimensional echocardiography long-axis. (C) Representative images of Masson staining (scale bar = 50 μm). (D) Representative images of WGA staining (scale bar = 20 μm). (E) Left atrial weight (LAW) to total body weight (TBW) ratio (LAW/TBW, n = 6 per group). (F) Left atrial area of each group (n = 6 per group). (G) Quantitative results of fibrosis area from indicated groups (n = 6 per group). (H) Quantitative results of cardiomyocyte area of each group (n = 6 per group). (I and J) Immunoblotting (I) and quantitation (J) of ANP protein level (n = 6 for each group). (K–M) Immunoblotting (K) and quantitation (L and M) of COL1A1 and COL3A1 protein level (n = 6 for each group). For statistical analysis, 1-way ANOVA with Bonferroni post hoc analysis was used. ∗P < 0.05, ∗∗P < 0.01, ∗∗∗P < 0.001, and ∗∗∗∗P < 0.0001.
Fig. 3
Fig. 3
Cardiac specific overexpression of NR4A3 attenuates diabetes induced atrial remodeling. (A) Representative whole heart images of db/m or db/db mice at 16 weeks after injected with AAV9-cTNT-Nr4a3 or AAV9-cTNT-Ctrl (scale bar = 1 mm). (B) Representative images of 2-dimensional echocardiography long-axis. (C) Representative images of Masson staining (scale bar = 50 μm) (D) Representative images of WGA staining (scale bar = 20 μm). (E) Left atrial weight (LAW) to total body weight (TBW) ratio (LAW/TBW, n = 8 per group). (F) Left atrial area of each group (n = 8 per group). (G) Quantitative results of fibrosis area from indicated groups (n = 8 per group). (H) Quantitative results of cardiomyocyte area from indicated groups (n = 8 per group). (I and J) Immunoblotting (I) and quantitation (J) of ANP protein level (n = 6 for each group). (K–M) Immunoblotting (K) and quantitation (L and M) of COL1A1 and COL3A1 protein level (n = 6 for each group). All data are presented as the mean ± SD. For statistical analysis, 1-way ANOVA with Bonferroni post hoc analysis was used. ∗P < 0.05, ∗∗P < 0.01, ∗∗∗P < 0.001, and ∗∗∗∗P < 0.0001.
Fig. 4
Fig. 4
Atrial NR4A3 expression level is inversely proportional to the susceptibility to diabetes induced AF. (A) Representative images of action potential (AP) in db/m or db/db mice at 16 weeks after injected with AAV9-Nr4a3 or AAV9-Ctrl (atrial cardiomyocytes number: n = 17 from the indicated groups, animal number: n = 6). (B) Quantitation of action potential duration at 90% repolarization (APD 90). (C) Representative intracardiac ECG traces recorded from the atria in WT or Nr4a3−/− mice at 16 weeks after normal diet (ND) (n = 10) or high-fat diet (HFD) + STZ treatment (n = 10). (D) Representative intracardiac ECG traces recorded from the atria of db/m or db/db mice at 16 weeks after injected with AAV9-cTNT-Nr4a3 or AAV9-cTNT-Ctrl (n = 10 of each group). (E) The probability of successful induction rate of WT or Nr4a3−/− mice at 16 weeks after ND or HFD + STZ treatment in a total of 10 times burst stimuli. (F) AF duration of indicated groups. (G) The probability of successful induction rate of db/m or db/db mice at 16 weeks after injected with AAV9-cTNT-Nr4a3 or AAV9-cTNT-Ctrl in a total of 10 times burst stimuli. (H) AF duration of indicated groups. All data are presented as the mean ± SD. For statistical analysis, 1-way ANOVA with Bonferroni post hoc analysis was used. ∗P < 0.05, ∗∗P < 0.01, ∗∗∗P < 0.001, and ∗∗∗∗P < 0.0001.
Fig. 5
Fig. 5
Upregulation of NR4A3 improves mitochondrial energy metabolism dysfunction induced by diabetes. (A) Kyoto Encyclopedia of Genes and Genomes (KEGG) functional enrichment analysis of molecular events in atrial tissues from db/db mice injected with AAV9-cTNT-Nr4a3 or AAV9-cTNT-Ctrl based on RNA-seq data. (B) KEGG functional enrichment analysis showing dysregulated signaling pathways in db/db mice injected with AAV9-cTNT-Nr4a3 or AAV9-cTNT-Ctrl according to non-targeted metabolomics analysis. (C) Representative images of transmission electron microscopy (TEM) (scale bar = 1 μm). (D) Representative images of TUNEL staining (scale bar = 100 μm). (E) Quantitative results of mitochondrial size. (F) Mitochondrial number/μm2. (G) Mitochondrial vacuolation ratio of atrial tissues from db/m or db/db mice at 16 weeks after injected with AAV9-cTNT-Nr4a3 or AAV9-cTNT-Ctrl (n = 6 for each group). (H) Quantitative results of TUNEL positive cells of atrial samples from db/m or db/db mice at 16 weeks after injected with AAV9-cTNT-Nr4a3 or AAV9-cTNT-Ctrl (n = 6 for each group). (I and J) Seahorse OCR and quantification for Complex I of atrial mitochondrial from db/m or db/db mice at 16 weeks after injected with AAV9-cTNT-Nr4a3 or AAV9-cTNT-Ctrl (n = 5 for each group). (K and L) Seahorse OCR and quantification for Complex II of atrial mitochondrial from db/m or db/db mice at 16 weeks after injected with AAV9-cTNT-Nr4a3 or AAV9-cTNT-Ctrl (n = 5 for each group). (M) Mitochondrial OCR in HL-1 cardiomyocytes transfected with lentivirus carrying shNr4a3 or ctrl lentivirus cultured in ctrl group (5.5 mmol/l glucose) or glucose (glu) group (30 mmol/l high glucose). (N-P) Analysis and quantification of basal respiration (N), maximal respiration (O) and ATP production (P) in HL-1 myocytes transfected with lentivirus carrying shNr4a3 or ctrl lentivirus cultured in low glucose (5.5 mmol/l) or high glucose (30 mmol/l). All data are presented as the mean ± SD. For statistical analysis, 1-way ANOVA with Bonferroni post hoc analysis was used. ∗P < 0.05, ∗∗P < 0.01, ∗∗∗P < 0.001, and ∗∗∗∗P < 0.0001.
Fig. 6
Fig. 6
The expression of NR4A3 is inversely proportional to oxidative stress injury in diabetic atrial mitochondria. (A and B) Representative images (A) and quantification (B) of ROS detected by DHE in the atria from db/m or db/db mice at 16 weeks after injected with AAV9-cTNT-Nr4a3 or AAV9-cTNT-Ctrl (n = 6 for each group) (scale bar = 50 μm). (C and D) Immunoblotting (C) and quantification (D) of SOD2 protein level in the atrial tissue from db/m or db/db mice after injected with AAV9-cTNT-Nr4a3 or AAV9-cTNT-Ctrl (n = 6 per group). (E and F) Representative images (E) and quantification (F) of mitochondrial membrane potential (Δψm) detected by JC-1 assay kit in the atria from db/m or db/db mice at 16 weeks after injected with AAV9-cTNT-Nr4a3 or AAV9-cTNT-Ctrl (n = 6 for each group) (scale bar = 20 μm). (G and H) Representative images (G) and quantification (H) of mitochondrial membrane potential (Δψm) detected in HL-1 myocytes transfected with lentivirus overexpressing the Nr4a3 or ctrl lentivirus cultured in low glucose (5.5 mmol/l) or high glucose (30 mmol/l) (scale bar = 20 μm). (I and J) Representative images (I) and quantification (J) of Mitochondrial Superoxide detected by MitoSOX Red Mitochondrial Superoxide Indicator in the atria from db/m or db/db mice injecting with AAV9-cTNT-Nr4a3 or AAV9-cTNT-Ctrl (n = 6 per group) (scale bar = 20 μm). (K and L) Representative images (K) and quantification (L) of Mitochondrial Superoxide in HL-1 myocytes transfected with lentivirus overexpressing the Nr4a3 or ctrl lentivirus cultured in low glucose (5.5 mmol/l) or high glucose (30 mmol/l) (scale bar = 20 μm). All data are presented as the mean ± SD. For statistical analysis, 1-way ANOVA with Bonferroni post hoc analysis was used. ∗P < 0.05, ∗∗P < 0.01, ∗∗∗P < 0.001, and ∗∗∗∗P < 0.0001.
Fig. 7
Fig. 7
NR4A3 directly binds to Sdha promoter and regulates its transcription. (A) Volcano plot of significantly upregulated mitochondrial energy metabolism related genes in atrial tissues from db/db mice injected with AAV9-cTNT-Nr4a3 by comparison with db/db mice injected with AAV9-cTNT-Ctrl based on RNA-seq data. (B) Heatmap of the expression of metabolites related to TCA cycle and glucose metabolism identified in db/db mice injected with AAV9-cTNT-Nr4a3 by comparison with db/db mice injected with AAV9-cTNT-Ctrl based on non-targeted metabolomics analysis. (C–F) Immunoblotting (C) and quantification (D–F) of protein levels of energy metabolism related genes predicted based on RNA seq and non-targeted metabolomics analysis in the atria from db/m or db/db mice at 16 weeks after injected with AAV9-cTNT-Nr4a3 or AAV9-cTNT-Ctrl (n = 6 for each group). (G) Representative DNA banding images of Cut&Tag product in agarose gel electrophoresis showing the potential NR4A3 response elements in the Pdp1, Sdha and Cox5a promoter regions. (H) Relative luciferase unit (RLU) of pGL3-basic, Sdha promoter, Cox5a promoter plasmids transfected with pcDNA3.1-Nr4a3 plasmid in HEK293T (human embryonic kidney cell) cells (n = 5 independent experiments). (I) RLU of the plasmids containing different regions of the Sdha promoter transfected with pcDNA3.1-Nr4a3 plasmid in HEK293T cells (n = 5 independent experiments). (J) RLU of the pGL3-basic, potential Sdha promoter sequence and mutant Sdha promoter sequence transfected with pcDNA3.1-NR4A3 plasmid in HEK293T cells (n = 5 independent experiments). (K) Sdha mRNA expression in HL-1 myocytes transfected with lentivirus overexpressing the Nr4a3 or ctrl lentivirus cultured in low glucose (5.5 mmol/l) (n = 4 for each group). (L) Sdha mRNA expression in HL-1 myocytes transfected with lentivirus carrying shNr4a3 or ctrl lentivirus cultured in low glucose (5.5 mmol/l) (n = 4 for each group). (M and N) Representative images (M) and quantitation (N) of immunofluorescence staining of NR4A3 (red) and DAPI (blue) in the atrial tissue of mice subjected to WT or Nr4a3-KO mice at 16 weeks after HFD + STZ treatment (n = 6 for each group) (scale bar = 50 μm). All data are presented as the mean ± SD. For statistical analysis, 1-way ANOVA with Bonferroni post hoc analysis and 2-tailed unpaired t test were used. ∗P < 0.05, ∗∗P < 0.01, ∗∗∗P < 0.001, and ∗∗∗∗P < 0.0001.
Fig. 8
Fig. 8
SDHA overexpression attenuates atrial remodeling in diabetic Nr4a3−/− mice. (A) Representative whole heart images of Nr4a3−/− mice injected with AAV9-SDHA or AAV9-CTRL at 16 weeks after ND or HFD + STZ treatment. (B) Representative images of 2-dimensional echocardiography long-axis. (C) Representative images of Masson staining (scale bar = 50 μm). (D) Representative images of WGA staining (scale bar = 20 μm). (E) Left atrial weight (LAW) to total body weight (TBW) ratio (LAW/TBW, n = 6 per group). (F) Left atrial area of each group (n = 6 per group). (G) Quantitative results of fibrosis area from indicated groups (n = 6 per group). (H) Quantitative results of cardiomyocyte area from indicated groups (n = 6 per group). (I) Representative intracardiac ECG traces (n = 6 per group). (J) The probability of successful induction rate of each group in a total of 10 times burst stimuli. (K) AF duration of indicated groups. (L–O) Transmission electronic microscopy (TEM) images (L) and quantitative results of mitochondrial size (M), mitochondrial number/μm2 (N) and mitochondrial vacuolation ratio (O) (scale bar = 1 μm and 500 nm). (P) ATP production (n = 6 per group). All data are presented as the mean ± SD. For statistical analysis, 1-way ANOVA with Bonferroni post hoc analysis was used. ∗P < 0.05, ∗∗P < 0.01, ∗∗∗P < 0.001, and ∗∗∗∗P < 0.0001.
Fig. 9
Fig. 9
Summary of the role of NR4A3 in atrial remodeling under pathological conditions. Under normal conditions, NR4A3 expression levels remain normal, ensuring proper energy metabolism in the atria. However, under pathological conditions, NR4A3 expression in the atria significantly decreases, leading to downregulation of SDHA transcription levels. Consequently, this downregulation disrupts the TCA cycle and oxidative phosphorylation, resulting in mitochondrial energy generation dysfunction and elevated oxidative stress. These factors contribute to atrial structural and electrical remodeling, ultimately leading to ACM.

Similar articles

Cited by

References

    1. Goette A., Kalman J.M., Aguinaga L., et al. EHRA/HRS/APHRS/SOLAECE expert consensus on atrial cardiomyopathies: definition, characterization, and clinical implication. Europace. 2016;18(10):1455–1490. - PMC - PubMed
    1. Goldberger J.J., Arora R., Green D., et al. Evaluating the atrial myopathy underlying atrial fibrillation: identifying the arrhythmogenic and thrombogenic substrate. Circulation. 2015;132(4):278–291. - PMC - PubMed
    1. Sajeev J.K., Kalman J.M., Dewey H., Cooke J.C., Teh A.W. The atrium and embolic stroke: myopathy not atrial fibrillation as the requisite determinant? JACC Clin Electrophysiol. 2020;6(3):251–261. - PubMed
    1. Johnson L.S., Platonov P.G., Conen D., et al. Markers of atrial myopathy in the general population: prevalence, predictors, and inter-relations. JACC Clin Electrophysiol. 2023;9(11):2240–2249. - PubMed
    1. Enríquez-Vázquez D., Quintanilla J.G., García-Escolano A., et al. Non-invasive electromechanical assessment during atrial fibrillation identifies underlying atrial myopathy alterations with early prognostic value. Nat Commun. 2023;14(1):4613. - PMC - PubMed

MeSH terms