. 2024 Nov;154(5):1216-1231.
doi: 10.1016/j.jaci.2024.07.021. Epub 2024 Aug 3.

Spatial transcriptomics reveals organized and distinct immune activation in cutaneous granulomatous disorders

Affiliations

Spatial transcriptomics reveals organized and distinct immune activation in cutaneous granulomatous disorders

Joseph Daccache et al. J Allergy Clin Immunol. 2024 Nov.

Abstract

Background: Noninfectious (inflammatory) cutaneous granulomatous disorders include cutaneous sarcoidosis (CS), granuloma annulare (GA), necrobiosis lipoidica (NL), and necrobiotic xanthogranuloma (NXG). These disorders share macrophage-predominant inflammation histologically, but the inflammatory architecture and the pattern of extracellular matrix alteration varies. The underlying molecular explanations for these differences remain unclear.

Objective: We sought to understand spatial gene expression characteristics in these disorders.

Methods: We performed spatial transcriptomics in cases of CS, GA, NL, and NXG to compare patterns of immune activation and other molecular features in a spatially resolved fashion.

Results: CS is characterized by a polarized, spatially organized type 1-predominant response with classical macrophage activation. GA is characterized by a mixed but spatially organized pattern of type 1 and type 2 polarization with both classical and alternative macrophage activation. NL showed concomitant activation of type 1, type 2, and type 3 immunity with a mixed pattern of macrophage activation. Activation of type 1 immunity was shared among, CS, GA, and NL and included upregulation of IL-32. NXG showed upregulation of CXCR4-CXCL12/14 chemokine signaling and exaggerated alternative macrophage polarization. Histologic alteration of extracellular matrix correlated with hypoxia and glycolysis programs and type 2 immune activation.

Conclusions: Inflammatory cutaneous granulomatous disorders show distinct and spatially organized immune activation that correlate with hallmark histologic changes.

Keywords: Sarcoidosis; granuloma annulare; granulomatous; necrobiosis; necrobiosis lipoidica; necrobiotic xanthogranuloma; spatial transcriptomics.


Conflict of interest statement

Disclosure statement Supported by a K08 grant from the National Institute of Allergy and Infectious Diseases (K08AI159229 to W.D.). Disclosure of potential conflict of interest: B. E. Shields has served as a consultant for Arcutis Biotherapeutics. C. A. Nelson has received research support from Boehringer Ingelheim. W. Damsky has served as a consultant for Pfizer, Eli Lilly, TWI Biotechnology, Fresenius Kabi, Epiarx Diagnostics, Boehringer Ingelheim, CSL Behring, AbbVie, and Sanofi; has been provided research support from Pfizer, Advanced Cell Diagnostics/Bio-Techne, AbbVie, Bristol Myers Squibb, and Incyte; and receives licensing fees from EMD/Millipore/Sigma. The rest of the authors declare that they have no relevant conflicts of interest.

Figures

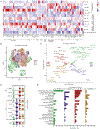
Figure 1.
Figure 1.. GA, CS, NL, and NXG are characterized by spatially distinct patterns of gene expression.
A. Cartoon summarizing the typical histologic features of these disorders. B. H&E (left), spatial feature plot showing transcriptionally distinct regions (middle), and UMAP plot (right panel) of a representative GA sample. C. H&E (left), spatial feature plot showing transcriptionally distinct regions (middle), and UMAP plot (right panel) of a representative CS sample. D. H&E (left), spatial feature plot showing transcriptionally distinct regions (middle), and UMAP plot (right panel) of a representative NL sample. E. H&E (left), spatial feature plot showing transcriptionally distinct regions (middle), and UMAP plot (right panel) of NXG. F. Spatial features plots showing expression to myeloid (CD68), T cell (CD3E), and fibroblast (COL1A1) markers in representative cases of GA, NL, CS, and NXG. G. Heatmap showing cell type deconvolution results among distinct spot types in each disorder.
Figure 2.
Figure 2.. Differential, spatially-organized immune polarization is observed in each disorder.
A. Heatmap showing expression of key immune polarization genes across conditions and spot types. B. UMAP projection of macrophage-rich (M) spots among different conditions. C. Volcano plot showing differentially expressed genes among disorders. D. Violin plots showing expression of selected macrophage polarization makers across conditions (within the macrophage-rich (M) spots). E. Pathway analysis showing enrichment of selected transcriptional programs across conditions (within the macrophage-rich (M) spots).
Figure 3.
Figure 3.. CS shows spatially organized activation of Type 1 immunity.
A. Heatmap showing expression of spot-type markers in each CS transcriptional module. B. Spatial feature plots showing expression of myeloid and lymphocyte spot markers (box) and each module in a representative case. H&E section and high-power inset (scale bar 50 μm) of a sarcoidal granuloma. C. Selected results of pathway analysis in representative modules, nGenes: number of genes in the module. D. Spatial feature plots showing expression of IFNG, CD3E (T cells) and CD68 (macrophages). E-F. Spatial feature plots for selected transcripts. G. Violin plots showing expression of CXCL9 and CCL19 among all replicates of each condition. H. Quantification of YKL40 (CHI3L1) IHC in areas of granulomatous inflammation in cases of GA (n=13), CS (n=10), NL (n=10), NXG (n=7) and CNTRL normal skin (n=10), error bars represent standard error of the mean (SEM). I. Representative examples of YKL40 (CHI3L1) IHC (brown chromogen), scale bar: 100 μm.
Figure 4.
Figure 4.. GA shows spatially organized activation of Type 1 and Type 2 immunity.
A. Heatmap showing expression of spot-type markers in each GA transcriptional module. B. Spatial feature plots showing expression of myeloid, fibroblast, and lymphocyte spot markers (box) and each module in a representative case. H&E with high power inset (scale bar 100 μm) of macrophage-rich interstitial inflammation. C. Selected results of pathway analysis in representative modules, nGenes: number of genes in the module. D-F. Spatial feature plots for selected transcripts. G. Violin plots showing expression of CCL18, CCL17, and CCL13 among all replicates of each condition. H. Quantification of SPP1 (osteopontin) RISH staining in cases of GA (n=13), CS (n=10), NL (n=10), NXG (n=7) and CNTRL normal skin (n=10), error bars represent standard error of the mean (SEM). I. Representative example of SPP1 (osteopontin) RISH staining (red chromogen) in GA, scale bar: 100 μm. Dashed lines show the paucicellular areas typical of GA. J. Representative example of SPP1 (osteopontin) RISH staining (red chromogen) in GA, CS, and NL.
Figure 5.
Figure 5.. NL shows spatially organized activation of Type 1, 2, and 3 immunity.
A. Heatmap showing expression of spot-type markers in each NL transcriptional module. B. Spatial feature plots showing expression of myeloid, fibroblast, and lymphocyte spot markers (box) and each module in a representative case. H&E with high power inset of a lymphoid aggregate, scale bar: 50 μm. C. Selected results of pathway analysis in representative modules, nGenes: number of genes in the module. D-I. Spatial feature plots for selected transcripts with (F) violin plots showing expression of CXCL8 and CXCL2 across conditions and biologic replicates.
Figure 6.
Figure 6.. NXG shows an exaggerated M2 phenotype and upregulated CXCR4 signaling components.
A. Heatmap showing expression of spot-type markers in each NXG transcriptional module. B. Spatial feature plots showing expression of myeloid, fibroblast, and lymphocyte spot markers (box) and each module in a representative case. H&E with high power inset of plasma cell rich area, scale bar: 25 μm. C. Selected results of pathway analysis in representative modules, nGenes: number of genes in the module. D-F. Spatial feature plots for selected transcripts. G. Violin plots showing expression of selected markers across conditions including all biologic replicates. H. Quantification of CD163 IHC in cases of GA (n=13), CS (n=10), NL (n=10), NXG (n=7) and CNTRL normal skin (n=10), error bars represent standard error of the mean (SEM). I. Representative example of CD163 IHC (brown chromogen) in NXG, scale bar: 100 μm. J. Representative examples CD163 (brown chromogen) staining in GA, CS, NL, and CNTRL, scale bar: 100 μm.
Figure 7.
Figure 7.. IL-32 overexpression is a feature of inflammatory cutaneous granulomatous disorders.
A. Spatial feature plots showing expression of IL32 in a representative case for each condition. B. Violin plot showing expression of IL32 across all biologic replicates. C. Quantification of IL32 RISH staining in cases of GA (n=13), CS (n=10), NL (n=10), NXG (n=7) and CNTRL normal skin (n=10), error bars represent SEM. D. Representative examples of RISH staining (red chromogen) in CS and CNTRL, scale bar: 200 μm.

References

    1. Wynn TA, Chawla A, & Pollard JW (2013). Macrophage biology in development, homeostasis and disease. Nature, 496(7446), 445–455. 10.1038/nature12034 - DOI - PMC - PubMed
    1. Shapouri‐Moghaddam A, Mohammadian S, Vazini H, Taghadosi M, Esmaeili S, Mardani F, Seifi B, Mohammadi A, Afshari JT, & Sahebkar A (2018). Macrophage plasticity, polarization, and function in health and disease. Journal of Cellular Physiology, 233(9), 6425–6440. 10.1002/jcp.26429 - DOI - PubMed
    1. Ramakrishnan L (2012). Revisiting the role of the granuloma in tuberculosis. Nature Reviews Immunology, 12(5), 352–366. 10.1038/nri3211 - DOI - PubMed
    1. Kloc M, Ghobrial RM, Wosik J, Lewicka A, Lewicki S, & Kubiak JZ (2018). Macrophage functions in wound healing. Journal of Tissue Engineering and Regenerative Medicine. 10.1002/term.2772 - DOI - PubMed
    1. Ma W-T, Gao F, Gu K, Chen D-K. The role of monocytes and macrophages in autoimmune diseases: A comprehensive review. Frontiers in Immunology. 2019;10. doi: 10.3389/fimmu.2019.01140 - DOI - PMC - PubMed