. 2024 Aug 5;7(1):944.
doi: 10.1038/s42003-024-06639-y.

miR-143-3p modulates depressive-like behaviors via Lasp1 in the mouse ventral hippocampus

Affiliations

miR-143-3p modulates depressive-like behaviors via Lasp1 in the mouse ventral hippocampus

Hui Yu et al. Commun Biol. .

Abstract

Depression is a prevalent and intricate mental disorder. The involvement of small RNA molecules, such as microRNAs in the pathogenesis and neuronal mechanisms underlying the depression have been documented. Previous studies have demonstrated the involvement of microRNA-143-3p (miR-143-3p) in the process of fear memory and pathogenesis of ischemia; however, the relationship between miR-143-3p and depression remains poorly understood. Here we utilized two kinds of mouse models to investigate the role of miR-143-3p in the pathogenesis of depression. Our findings reveal that the expression of miR-143-3p is upregulated in the ventral hippocampus (VH) of mice subjected to chronic restraint stress (CRS) or acute Lipopolysaccharide (LPS) treatment. Inhibiting the expression of miR-143-3p in the VH effectively alleviates depressive-like behaviors in CRS and LPS-treated mice. Furthermore, we identify Lasp1 as one of the downstream target genes regulated by miR-143-3p. The miR-143-3p/Lasp1 axis primarily affects the occurrence of depressive-like behaviors in mice by modulating synapse numbers in the VH. Finally, miR-143-3p/Lasp1-induced F-actin change is responsible for the synaptic number variations in the VH. In conclusion, this study enhances our understanding of microRNA-mediated depression pathogenesis and provides novel prospects for developing therapeutic approaches for this intractable mood disorder.


Conflict of interest statement

The authors declare no competing interests.

Figures
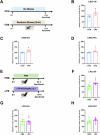
Fig. 1
Fig. 1. miR-143-3p was upregulated in the depressive-like mice models.
A Timeline of the experimental procedure for CRS treatment in mice. B miR-143-3p mRNA level in the ventral hippocampus (VH) (n = 7–8). C miR-143-3p mRNA level in the dorsal hippocampus (DH) (n = 7–8). D miR-143-3p mRNA level in the prefrontal cortex (PFC) (n = 7–8). E Timeline of the experimental procedure for LPS treatment in mice. F miR-143-3p mRNA level in the VH (n = 7–8). G miR-143-3p mRNA level in the DH (n = 7–8). H miR-143-3p mRNA level in the PFC (n = 7–8). Data were presented as mean ± SEM. **P < 0.01 versus CON group or versus PBS group.
Fig. 2
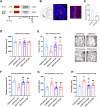
Fig. 2. Knockdown of miR-143-3p in the VH rescued depressive-like behaviors in CRS mice.
A Information on recombinant AAV-143-3p sponges and experimental paradigm for CRS in the present study. B Representative site of virus injection into the VH (Scale bar: 2 mm for the representative image and 100 μm for the enlarged image). C RT-qPCR assay to validate the efficiency of miR-143-3p knockdown (n = 3). D The locomotion of total distance in open field test (OFT) (n = 8). E The time spent in center in OFT (n = 8). F The percentage of sucrose preference in the Sucrose preference test (SPT) (n = 8). G The immobility time in tail suspension test (TST) (n = 8). H The immobility time in forced swimming test (FST) (n = 8). Data were presented as mean ± SEM. *P < 0.05, **P < 0.01 versus CON/AAV-Ctrl group, #P < 0.05, ##P < 0.01 versus CRS/AAV-Ctrl group.
Fig. 3
Fig. 3. Knockdown of miR-143-3p in the VH rescued depressive-like behaviors in LPS mice.
A Information on recombinant AAV-143-3p sponges and experimental paradigm for LPS in the present study. B The locomotion of total distance in OFT (n = 11). C The time spent in center in OFT (n = 11). D The percentage of sucrose preference in SPT (n = 11). E The immobility time in TST (n = 11). F The immobility time in FST (n = 11). Data were presented as mean ± SEM. *P < 0.05, **P < 0.01 versus PBS/AAV-Ctrl group, #P < 0.05, ##P < 0.01 versus LPS/AAV-Ctrl group.
Fig. 4
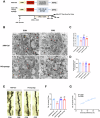
Fig. 4. Knockdown of miR-143-3p in the VH rescued CRS induced synapse alterations.
A The experimental paradigm in the present study. B Representative transmission electron microscopy (TEM) images of ultrastructure synapses of the VH region (Scale bar, 200 nm). C The density of synapses of VH (n = 3). D The length of the synaptic active zone of VH (n = 3). E Representative Golgi staining images of VH dendritic spine morphology (Scale bar, 10 μm). F Spine density of dendrites in the VH (n = 5). G Correlation between spine density in the VH and sucrose preference in individual mice (n = 20). Data were presented as mean ± SEM. **P < 0.01 versus CON/AAV-Ctrl group, #P < 0.05, ##P < 0.01 versus CRS/AAV-Ctrl group.
Fig. 5
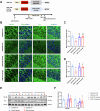
Fig. 5. Knockdown of miR-143-3p in the VH rescued CRS induced synaptic-associated proteins decrease.
A The experimental paradigm in the present study. B Representative immunofluorescence images of postsynaptic density protein 95 (PSD-95) and synaptophysin (Syn) in the VH (Scale bar, 20 μm). C Quantitative analysis of the PSD-95 mean intensity of immunofluorescence in the VH (n = 4). D Quantitative analysis of the Syn mean intensity of immunofluorescence in the VH (n = 4). E Representative western blotting of PSD-95 and Syn in the VH. F Quantitative analysis of the expression levels of PSD-95 and Syn in the VH (n = 6). Data were presented as mean ± SEM. *P < 0.05, **P < 0.01 versus CON/AAV-Ctrl group, #P < 0.05, ##P < 0.01 versus CRS/AAV-Ctrl group.
Fig. 6
Fig. 6. Lasp1 is a target gene of miR-143-3p.
A miR-143-3p and Lasp1 binding site prediction. B Luciferase activity in luciferase reporter gene assay (n = 5). **P < 0.01 versus miR-143-3p mimic control in WT group, ##P < 0.01 versus miR-143-3p mimic in WT group. C Lasp1 mRNA level in the VH (n = 6). D Representative western blotting of LASP1 in the VH. E Quantitative analysis of the expression levels of LASP1 in the VH (n = 6). Data were presented as mean ± SEM. *P < 0.05, **P < 0.01 versus CON/AAV-Ctrl group, #P < 0.05, ##P < 0.01 versus CRS/AAV-Ctrl group.
Fig. 7
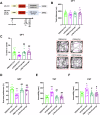
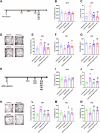
Fig. 7. Knockdown of LASP1 could reverse the antidepressant effects of knockdown miR-143-3p in CRS and LPS mice.
A The experimental paradigm for CRS treatment in the present study. B The locomotion of total distance in OFT in CRS model (n = 8). C The time spent in center in OFT in CRS model (n = 8). D The track maps during 10 min in OFT. E The percentage of sucrose preference in SPT in CRS model (n = 8). F The immobility time in TST in CRS model (n = 8). G The immobility time in FST in CRS model (n = 8). H The experimental paradigm for LPS in the present study. I The locomotion of total distance in OFT in LPS model (n = 8). J The time spent in center in OFT in LPS model (n = 8). K The track maps during 10 min in OFT. L The percentage of sucrose preference in SPT in LPS model (n = 8). M The immobility time in TST in LPS model (n = 8). N The immobility time in FST in LPS model (n = 8). Data were presented as mean ± SEM. *P < 0.05, **P < 0.01 versus CRS/AAV-Ctrl group or versus LPS/AAV-Ctrl group, #P < 0.05, ##P < 0.01 versus CRS/143-sponge group, or versus LPS/143-sponge group.
Fig. 8
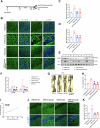
Fig. 8. Knockdown of LASP1 could reverse the synapse alterations of knockdown miR-143-3p in CRS mice.
A The experimental paradigm for CRS treatment in the present study. B Representative immunofluorescence images of PSD-95 and Syn in the VH (Scale bar, 20 μm). C Quantitative analysis of the PSD-95 mean intensity of immunofluorescence in the VH (n = 4). D Quantitative analysis of the Syn mean intensity of immunofluorescence in the VH (n = 4). E Representative western blotting of PSD-95 and Syn in the VH. F Quantitative analysis of the expression levels of PSD-95 and Syn in the VH (n = 6). G Representative Golgi staining images of the VH dendritic spine morphology (Scale bar, 10 μm). H Spine density of dendrites in the VH (n = 5). I Correlation between spine density in the VH and sucrose preference in individual mice (n = 20). J Representative immunofluorescence images of F-actin in the VH (Scale bar, 20 μm). K Quantitative analysis of the F-actin mean intensity of immunofluorescence in the VH (n = 4). Data were presented as mean ± SEM. *P < 0.05, **P < 0.01 versus CRS/AAV-Ctrl group, #P < 0.05, ##P < 0.01 versus CRS/143-sponge group.

Similar articles

References

    1. Marx, W. et al. Major depressive disorder. Nat. Rev. Dis. Primers9, 44 (2023). 10.1038/s41572-023-00454-1 - DOI - PubMed
    1. Parekh, P. K., Johnson, S. B. & Liston, C. Synaptic mechanisms regulating mood state transitions in depression. Annu. Rev. Neurosci.45, 581–601 (2022). 10.1146/annurev-neuro-110920-040422 - DOI - PMC - PubMed
    1. Malhi, G. S. & Mann, J. J. Depression. Lancet392, 2299–2312 (2018). 10.1016/S0140-6736(18)31948-2 - DOI - PubMed
    1. Lu, J. et al. Prevalence of depressive disorders and treatment in China: a cross-sectional epidemiological study. Lancet Psychiatry8, 981–990 (2021). 10.1016/S2215-0366(21)00251-0 - DOI - PubMed
    1. Huang, Y. et al. Prevalence of mental disorders in China: a cross-sectional epidemiological study. Lancet Psychiatry6, 211–224 (2019). 10.1016/S2215-0366(18)30511-X - DOI - PubMed

Publication types