. 2024 Aug 4;15(1):6608.
doi: 10.1038/s41467-024-50735-w.

A region-confined PROTAC nanoplatform for spatiotemporally tunable protein degradation and enhanced cancer therapy

Affiliations

A region-confined PROTAC nanoplatform for spatiotemporally tunable protein degradation and enhanced cancer therapy

Jing Gao et al. Nat Commun. .

Abstract

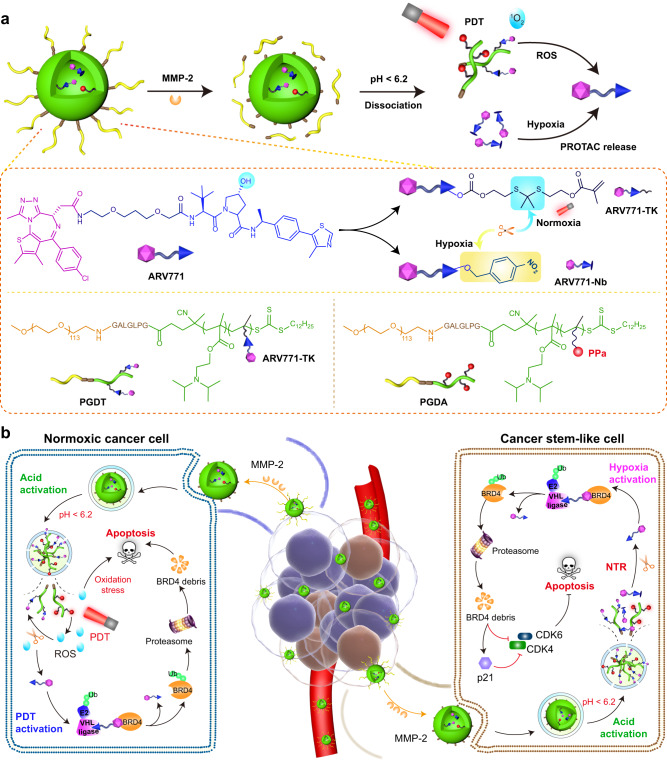
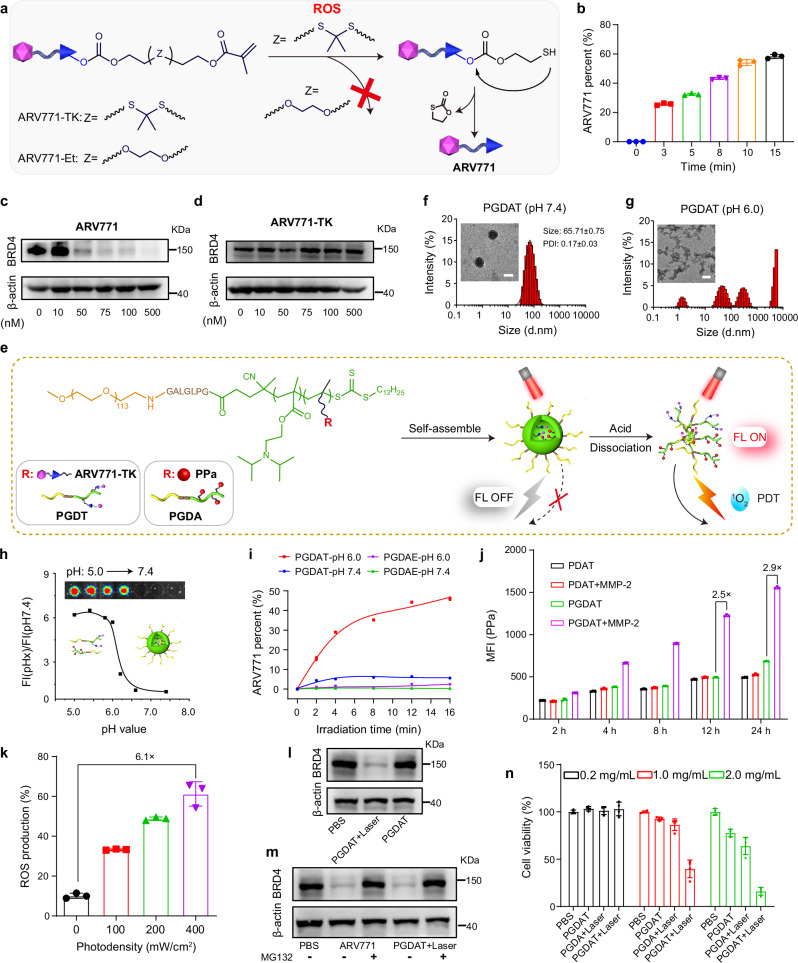
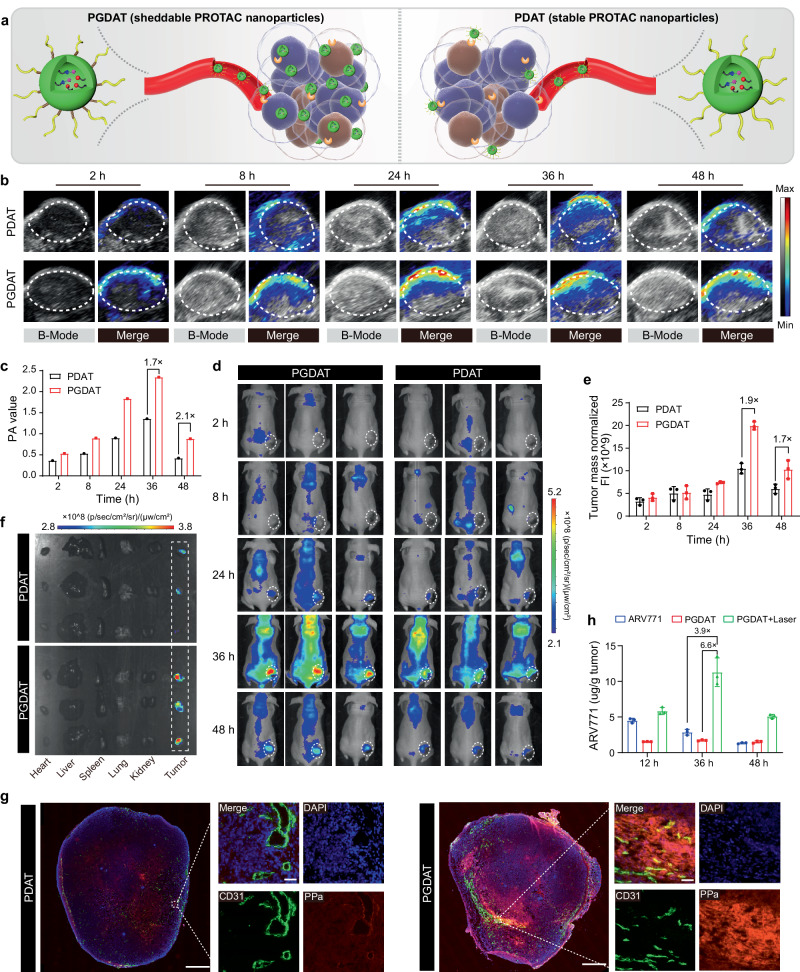
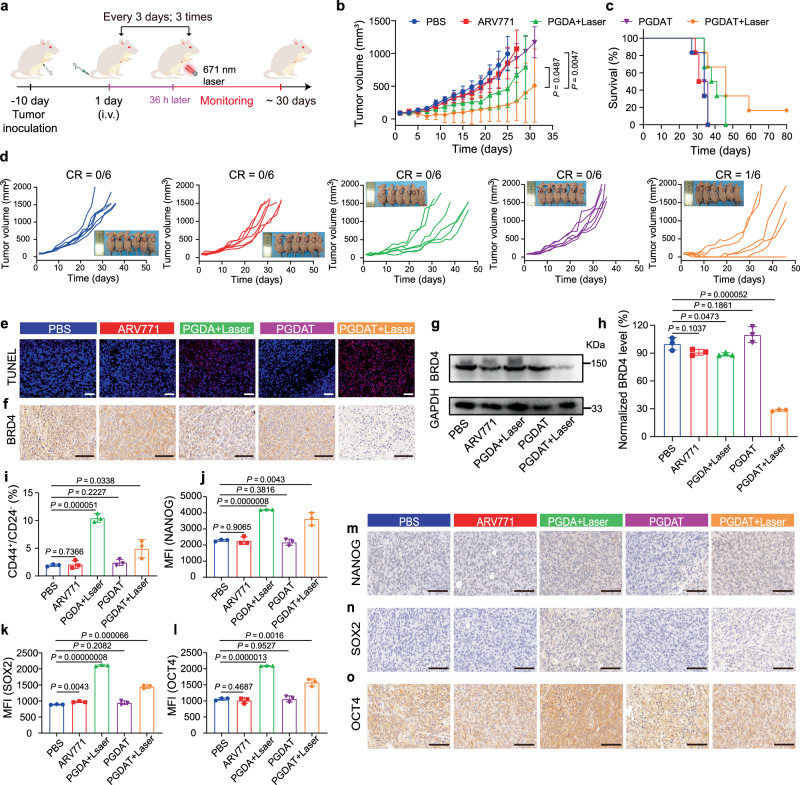
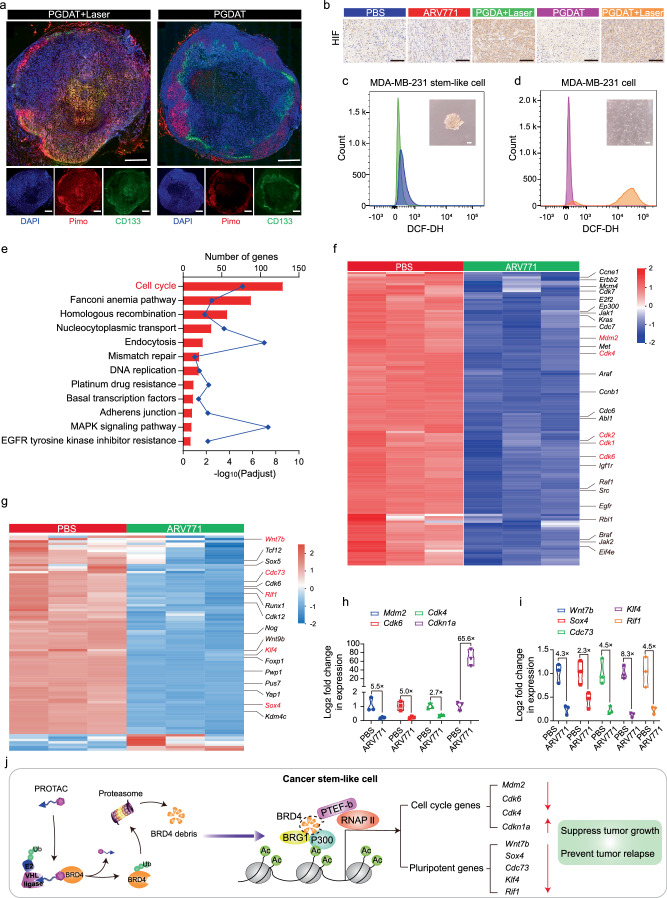
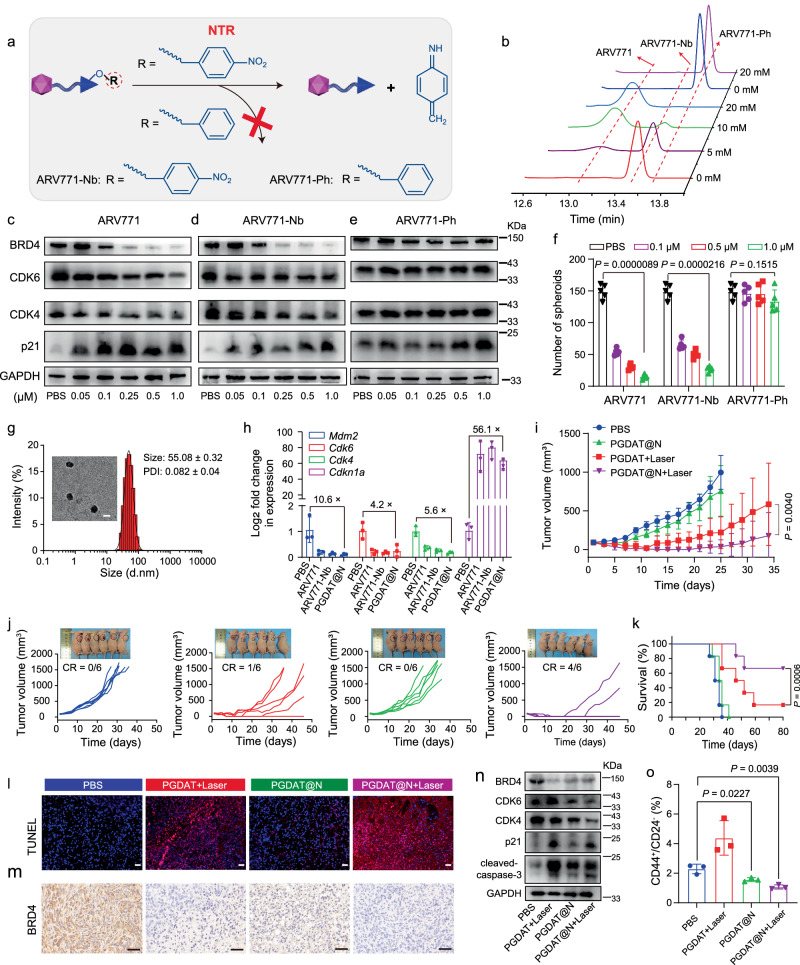
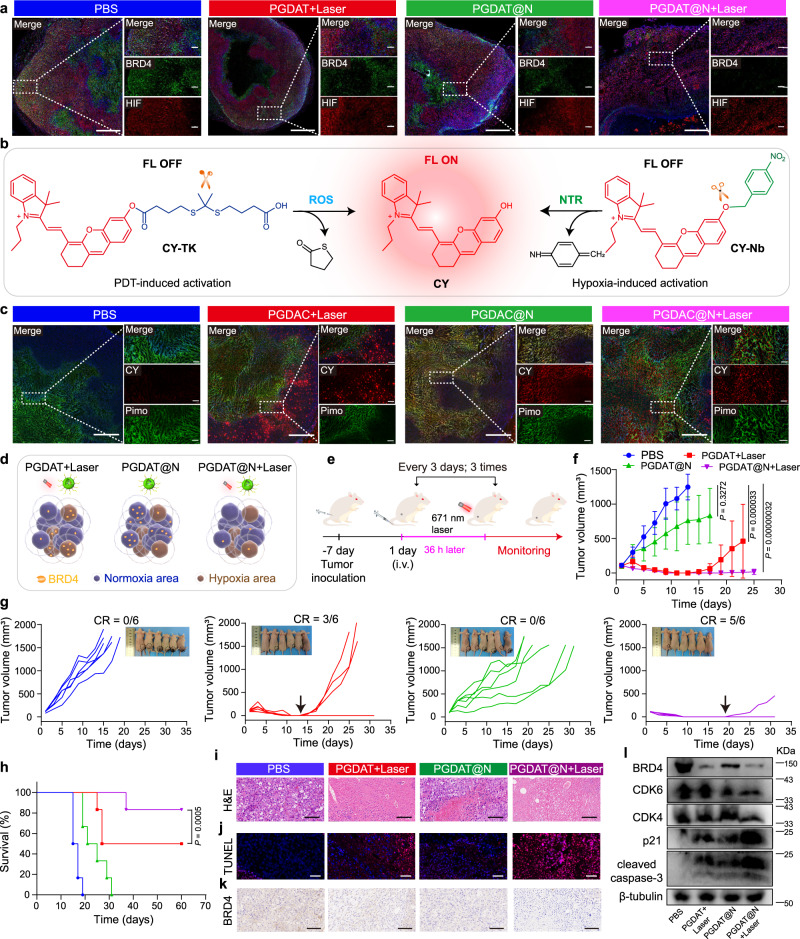
The antitumor performance of PROteolysis-TArgeting Chimeras (PROTACs) is limited by its insufficient tumor specificity and poor pharmacokinetics. These disadvantages are further compounded by tumor heterogeneity, especially the presence of cancer stem-like cells, which drive tumor growth and relapse. Herein, we design a region-confined PROTAC nanoplatform that integrates both reactive oxygen species (ROS)-activatable and hypoxia-responsive PROTAC prodrugs for the precise manipulation of bromodomain and extraterminal protein 4 expression and tumor eradication. These PROTAC nanoparticles selectively accumulate within and penetrate deep into tumors via response to matrix metalloproteinase-2. Photoactivity is then reactivated in response to the acidic intracellular milieu and the PROTAC is discharged due to the ROS generated via photodynamic therapy specifically within the normoxic microenvironment. Moreover, the latent hypoxia-responsive PROTAC prodrug is restored in hypoxic cancer stem-like cells overexpressing nitroreductase. Here, we show the ability of region-confined PROTAC nanoplatform to effectively degrade BRD4 in both normoxic and hypoxic environments, markedly hindering tumor progression in breast and head-neck tumor models.


Conflict of interest statement

The authors declare no competing interests.

Figures

Fig. 1
Fig. 1. Schematic illustration of the region-confined PROTAC nanoplatform for spatiotemporally tunable protein degradation and combinatory cancer therapy.
a Structure of the ROS/hypoxia dual-activatable PROTAC nanoparticle (PGDAT@N) and its responsive process to MMP-2 enzyme, intracellular acidic microenvironment, and PDT-based ROS or CSCs-relied hypoxia. b Cartoon illustration of the PGDAT@N nanoparticle eliminates tumor cells in normoxic and hypoxic areas simultaneously by self-complementary degrading BRD4 protein. PGDAT@N nanoparticle reaches tumor tissue after i.v. injection through EPR effect firstly, and MMP-2-induced PEG-deshielding enhances its accumulation and penetration at the tumor site. After internalized into tumor cells, PROTAC nanoparticle recovers its photoactivity due to acid-liable DPA groups caused dissociation of nanoparticle, and then affluent ROS in the normoxic region is generated under laser irradiation to release original PROTAC via cleaving the TK linkage. The BRD4 removal and PDT synergistically induce apoptosis of the normoxic tumor cells. Meanwhile, upon internalization by CSCs, hypoxia-activatable PROTAC derivate is divulged from the dissociated PGDAT@N nanoparticle, and then restored to parental PROTAC with nitroreductase (NTR) for sweeping tumor cells. BRD4 degradation can downregulate cell cycle proteins including cyclin-dependent kinase 4 (CDK4) and cyclin-dependent kinase 6 (CDK6), meanwhile upregulating cyclin-dependent kinase inhibitor 1 A (p21) to induce apoptosis of CSCs. The obliteration of both normoxic and hypoxic tumor cells with the region-confined PROTAC nanoplatform enable tumor regression efficiently.
Fig. 2
Fig. 2. Synthesis and characterization of the ROS-activatable PROTAC nanoparticle.
a Schematic illustration of ROS-induced restoration of ARV771 from ARV771-TK, but powerless of the counterpart ARV771-Et. b Release rate of ARV771 from ROS-activatable ARV771-TK after being mixed with PPa and irradiated by 671 nm laser with determined time (n = 3 independent experimental units). c, d Western blot analysis of ARV771 and ARV771-TK mediated BRD4 degradation in MDA-MB-231 cells post 24 h of co-incubation. e Schematic diagram of the self-assembly process and acid-activatable photoactivity capability of PGDAT nanoparticle. Representative DLS data and TEM images of the PGDAT nanoparticle at pH 7.4 (f) and pH 6.0 (g) condition (scale bar = 50 μm). h Acid-induced fluorescence recover profile of PGDAT nanoparticle, the fluorescence intensity was normalized to that determined at pH 7.4. Insert image was the PGDAT nanoparticle solutions at different pH values. i ROS-triggered ARV771 release from the PROTAC nanoparticles at the pH 7.4 and 6.0 with the different laser exposure time (n = 3 independent experimental units). j Flow cytometry evaluation of the cellular uptake of MMP-2-responsive PGDAT nanoparticle and MMP-2-inert PDAT nanoparticle by MDA-MB-231 cells after co-incubation with defined time in vitro (the nanoparticles were pretreated with/without MMP-2 of 0.2 mg/mL for 1 h) (n = 3 independent experimental cell lines). k Flow cytometric analysis of ROS production activity of PGDAT nanoparticle, DCFH-DA probe was joined into the tumor cells before laser irradiation with different photodensity (n = 3 independent experimental cell lines). l Western blot examination of BRD4 degradation of ROS-activatable PGDAT nanoparticle after 24 h co-incubation with MDA-MB-231 cell, the PGDAT nanoparticle was pretreated with 671 nm irradiation or not. m Western blot assay of MDA-MB-231 cells which were subjected to ARV771 and PGDAT nanoparticle with or without MG132 treatment (identical PROTAC concentration of 1.0 μM and MG132 concentration of 5.0 mM). n CCK-8 assay of MDA-MB-231 cell viability post different treatments (n = 3 independent experimental cell lines). All data are presented as mean ± SD.
Fig. 3
Fig. 3. Stimuli-activatable PROTAC nanoparticle specifically accumulated and released free PROTAC at the tumor site in vivo.
a Schematic diagram of sheddable PROTAC nanoparticles integrating MMP-2-lible GPLGLAG peptide spacer for enhanced tumor accumulation and penetration compared to the MMP-2-insensitive counterpart (without GPLGLAG peptide spacer). b Photoacoustic images (PAI) of PROTAC nanoparticle distribution in MDA-MB-231 tumor-bearing mouse model in vivo. c PA value of the tumor site (n = 3 mice). d Fluorescence imaging analysis of PGDAT (with MMP-2 responsive spacer) and PDAT (MMP-2-insensitive) nanoparticles distribution in MDA-MB-231 tumor-bearing nude mice. e Normalized fluorescence intensity of tumor site (n = 3 mice). f Ex-vivo fluorescence images of the harvested major organs (heart, liver, spleen, lung, kidney) and tumor tissues post 48 h treatment. g Ex-vivo CLSM images of tumor section post 48 h injection (left panel scale bar = 2.0 mm, right panel scale bar = 50 μm, the blue represents DAPI, the green represents CD31 and the red represents PPa). h HPLC evaluation of the intratumoral ARV771 distribution with different treatments (ARV771, PGDAT and PGDAT + laser groups with the identified ARV771 dose of 10 mg/kg) (n = 3 mice). All data are presented as mean ± SD.
Fig. 4
Fig. 4. Antitumor performance of the ROS-activatable PROTAC nanoparticle in MDA-MB-231 breast tumor model in vivo.
a Experimental schedule of the ROS-responsive PROTAC nanoparticles for antitumor study. b Tumor growth curves of the tumor-bearing mice subjected to different treatments (n = 6 mice), the statistical analysis was based on the two-sided unpaired t-test. c Survival plots of the tumor-bearing mice (n = 6 mice). d Individual tumor growth graph after being treated with various formulations, insert was photograph of tumor-bearing mice at 27-days post treatment (n = 6 mice). e TUNEL (blue: DAPI, red: apoptotic cells) staining of the tumor sections at end of various treatments (scale bar = 100 μm). f IHC examination of BRD4 expression in the tumor tissues (scale bar = 100 μm). g Western blot analysis and (h) semi-quantitation of BRD4 expression in the tumor lysates (n = 3 mice). Statistical analysis was performed by two-sided unpaired t-test. i Flow cytometric assay of intratumoral cancer stem-like cells ratio (n = 3 mice). Statistical analysis was performed by two-sided unpaired t-test. Flow cytometric analysis of the NANOG (j), SOX2 (k), OCT4 (l) expression in the tumor site upon various treatments (n = 3 mice). Statistical analysis was performed by two-sided unpaired t-test. IHC assay of the NANOG (m), SOX2 (n), OCT4 (o) expression of the tumor sections (scale bar = 100 μm). All data are presented as mean ± SD.
Fig. 5
Fig. 5. BRD4 degradation influenced the gene expression of cancer stem-like MDA-MB-231 tumor cells in vitro.
a Immunofluorescence staining of tumor sections for hypoxia and cancer stem-like cells analysis (scale bar = 2.0 mm, the blue represents DAPI, the green represents CD133 and the red represents pimo). b IHC assay of HIF expression at tumor site after various treatments (scale bar = 100 μm). c, d Flow cytometry measurement of intracellular ROS level (insert: morphology image of different cells). eg RNA-seq analysis of differential expression genes between MDA-MB-231 stem-like cells treated with PBS or ARV771 at the concentration of 1.0 μM for 24 h. e KEGG enrichment histogram of differentially expressed genes (statistical difference was calculated using two-sided Fisher’s exact test, n = 3 independent experimental cell lines), f heatmap of differentially expressed genes associated with cell cycle and (g) cell stemness (n = 3 independent experimental cell lines, red and blue colors represent upregulated or downregulated genes respectively). Quantitative PCR assay of the (h) cell cycle- and (i) cell stemness-related RNA levels in MDA-MB-231 CSCs post 24 h incubation with 1.0 μM of ARV771 (n = 3 independent experimental cell lines). j Schematic illustration of PROTAC-induced BRD4 degradation and thus influence the downstream genes. All data are presented as mean ± SD.
Fig. 6
Fig. 6. Synthesis of the region-confined PROTAC nanoparticle and its antitumor performance in MDA-MB-231 breast tumor model in vivo.
a General view of hypoxia-responsive and hypoxia-insensitive ARV771 derivates. b Representative profiles of HPLC analysis on ARV771-Nb and ARV771-Ph treated with different concentrations of Na2S2O4. Western blot assay of BRD4 expression and its downstream protein of CDK4, CDK6 and p21 in MDA-MB-231 stem-like cells with (c) ARV771, (d) ARV771-Nb and (e) ARV771-Ph treatment for 24 h. f Number of the tumor spheroids (diameter > 50 μm) after the MDA-MB-231 cells with various treatments for 12 days (n = 5 independent experimental cell lines). Statistical analysis was performed by two-sided unpaired t-test. g DLS data and TEM image of PGDAT@N nanoparticle (scale bar = 50 μm). h Quantitative PCR detection of RNA expression post 24 h treatment with different formulations in MDA-MB-231 stem-like cells (n = 3 independent experimental cell lines). i Averaged and (j) individual tumor growth profiles of tumor-bearing mice treated with diverse formulations (insert: mice image at 27 days of experimental period, n = 6 mice). Two-sided unpaired t-test was used in the statistical analysis. k Survival curves of tumor-bearing mice (n = 6 mice). Statistical analysis was performed by two-sided unpaired log-rank (Mantel-Cox) test. l TUNEL staining of the tumor sections (scale bar = 100 μm). m IHC analysis of BRD4 expression in the tumor sections (scale bar = 100 μm). n Western blot assay of PROTAC nanoparticle induced intratumoral BRD4 degradation and differential expression of its downstream proteins. o Flow cytometry examination of CSCs percentage in the tumor tissue post different treatments (n = 3 mice). Statistical analysis was achieved by two-side unpaired t-test. All data are presented as mean ± SD.
Fig. 7
Fig. 7. Region-confined activation of the PROTAC nanoparticle and its antitumor property in HN30 HNSCC tumor model in vivo.
a IF staining of tumor sections for hypoxia (HIF) and BRD4 analysis after the tumor-bearing mice subjected to different treatments (left panel scale bar = 1.0 mm, right panel scale bar = 200 μm, the blue represents DAPI, the green represents BRD4 and the red represents HIF). b Schematic illustration of the ROS/NTR-triggered activation of CY from CY prodrugs. c Ex-vivo CLSM images of tumor sections post tumor-bearing mice subjected to various treatments for analysis of hypoxia (pimonidazole, pimo) and CY fluorescence (left panel scale bar = 1.0 mm, right panel scale bar = 200 μm, the blue represents DAPI, the green represents pimo and the red represents CY). d Cartoon illustration of region-confined activation of the nanoparticle and degradation of target protein BRD4. e Treatment schedule of the ROS/hypoxia-liable PROTAC nanoplatform antitumor study in HN30 tumor-bearing mice model. fh PROTAC nanoparticle inhibited HN30 HNSCC tumor growth and relapse efficiently. Tumor growth curves (f) and individual tumor growth profiles (g) and survival plots (h) of the tumor-bearing mice upon treatment (n = 6 mice). Statistical analysis of f was performed by two-sided unpaired t-test. Statistical significance of h was calculated by survival curve comparison with Log-rank (Mantel-Cox) test. i H&E staining and j TUNEL (blue: DAPI, red: apoptotic cells) of tumor sections 15-days post-treatment (scale bar = 100 μm). k IHC analysis of BRD4 expression in the tumor tissues (scale bar = 100 μm). l Western blot assay of BRD4, CDK6, CDK4, p21, cleaved-caspase-3 expression of HN30 tumor tissues post tumor-bearing mice subjected to various treatments. All data are presented as mean ± SD.

Similar articles

Cited by

References

    1. Schapira, M., Calabrese, M. F., Bullock, A. N. & Crews, C. M. Targeted protein degradation: expanding the toolbox. Nat. Rev. Drug Discov.18, 949–963 (2019). 10.1038/s41573-019-0047-y - DOI - PubMed
    1. Dale, B. et al. Advancing targeted protein degradation for cancer therapy. Nat. Rev. Cancer21, 638–654 (2021). 10.1038/s41568-021-00365-x - DOI - PMC - PubMed
    1. Li, K. & Crews, C. M. PROTACs: past, present and future. Chem. Soc. Rev.51, 5214–5236 (2022). 10.1039/D2CS00193D - DOI - PMC - PubMed
    1. Sakamoto, K. M. et al. Protacs: chimeric molecules that target proteins to the Skp1-Cullin-F box complex for ubiquitination and degradation. Proc. Natl Acad. Sci. USA98, 8554–8559 (2001). 10.1073/pnas.141230798 - DOI - PMC - PubMed
    1. Winter, G. E. et al. Phthalimide conjugation as a strategy for in vivo target protein degradation. Science348, 1376–1381 (2015). 10.1126/science.aab1433 - DOI - PMC - PubMed

MeSH terms

LinkOut - more resources