. 2024 Aug 5;9(1):195.
doi: 10.1038/s41392-024-01913-1.

Targeting Lactobacillus johnsonii to reverse chronic kidney disease

Affiliations

Targeting Lactobacillus johnsonii to reverse chronic kidney disease

Hua Miao et al. Signal Transduct Target Ther. .

Abstract

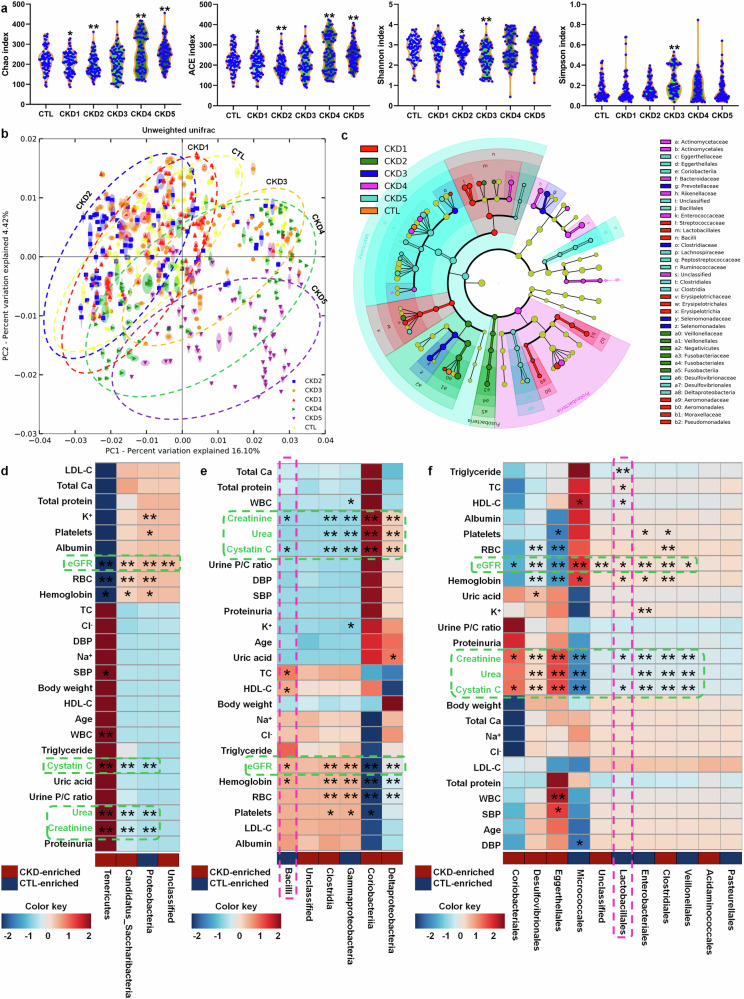
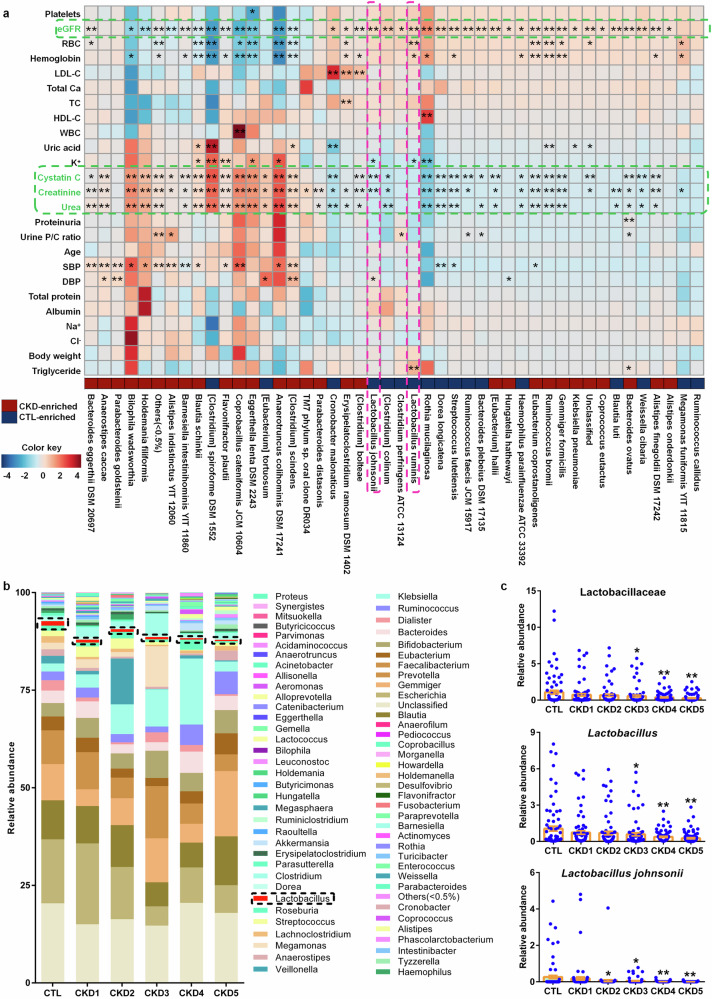
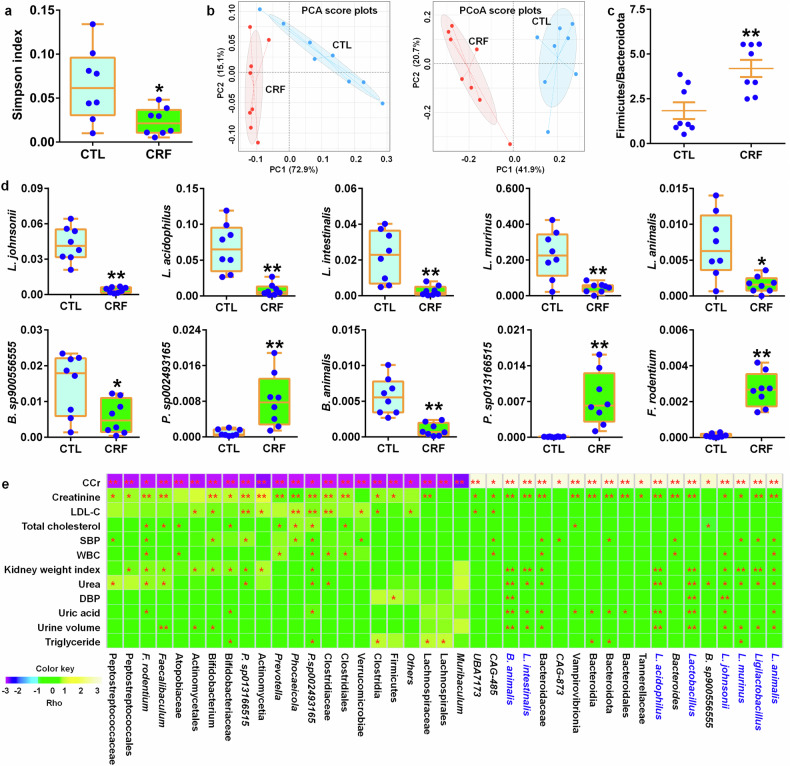
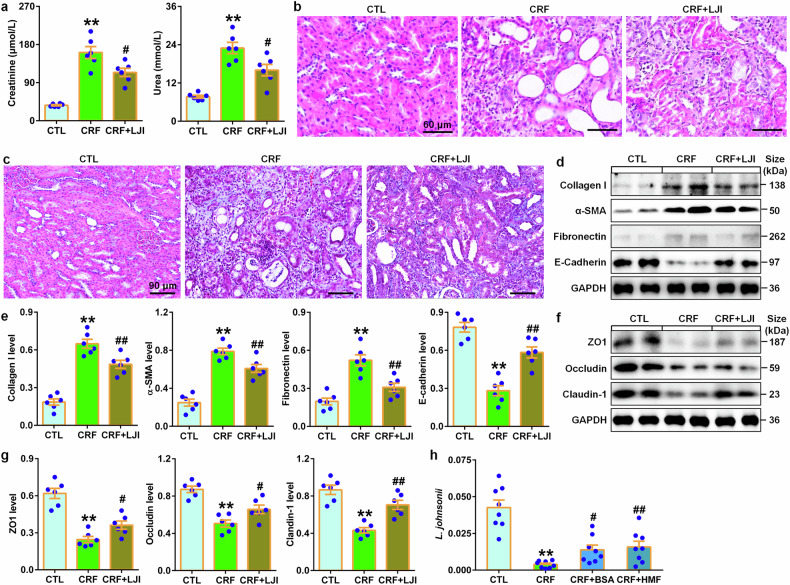
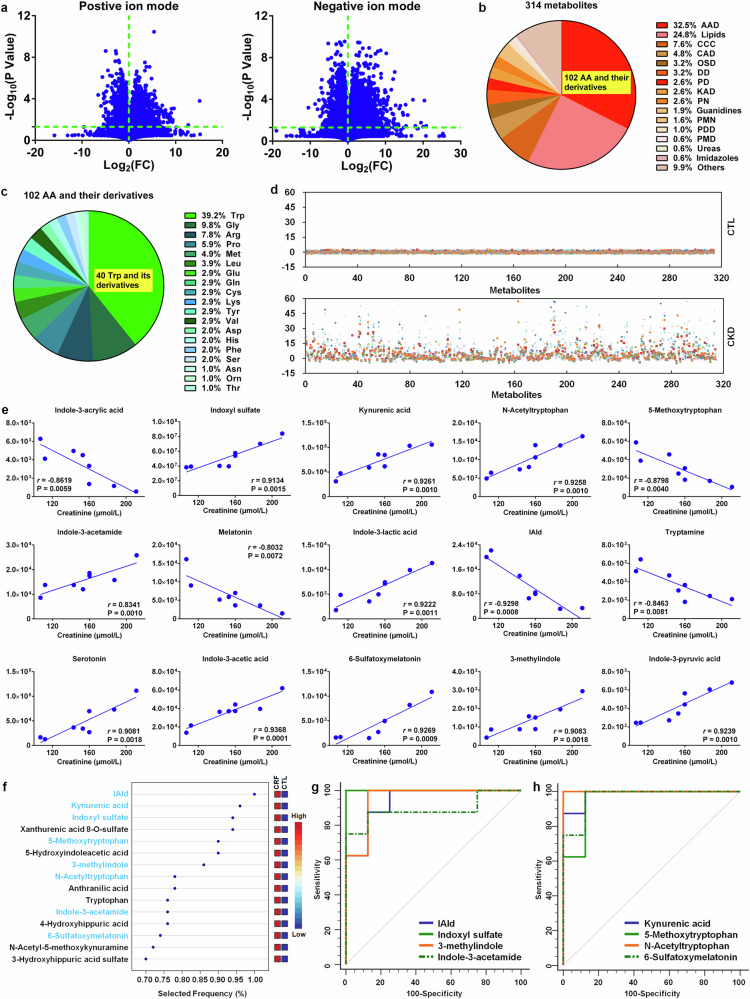
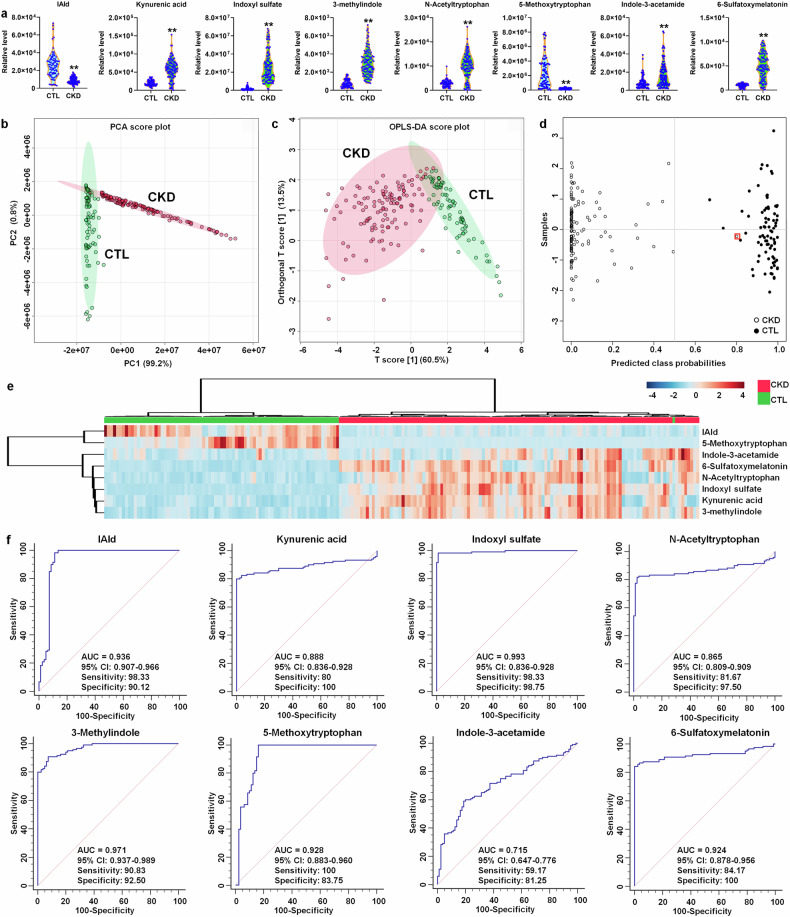
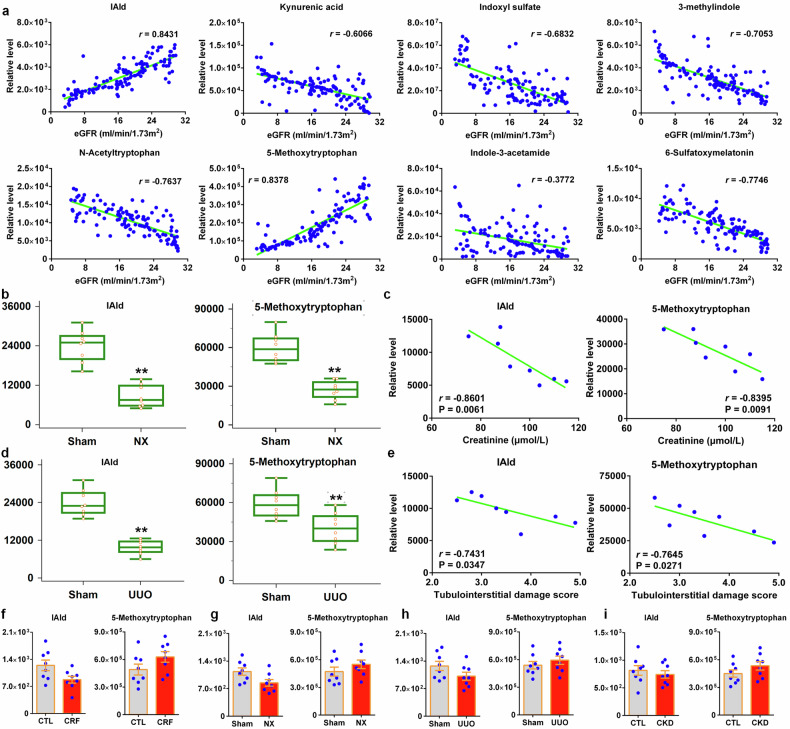
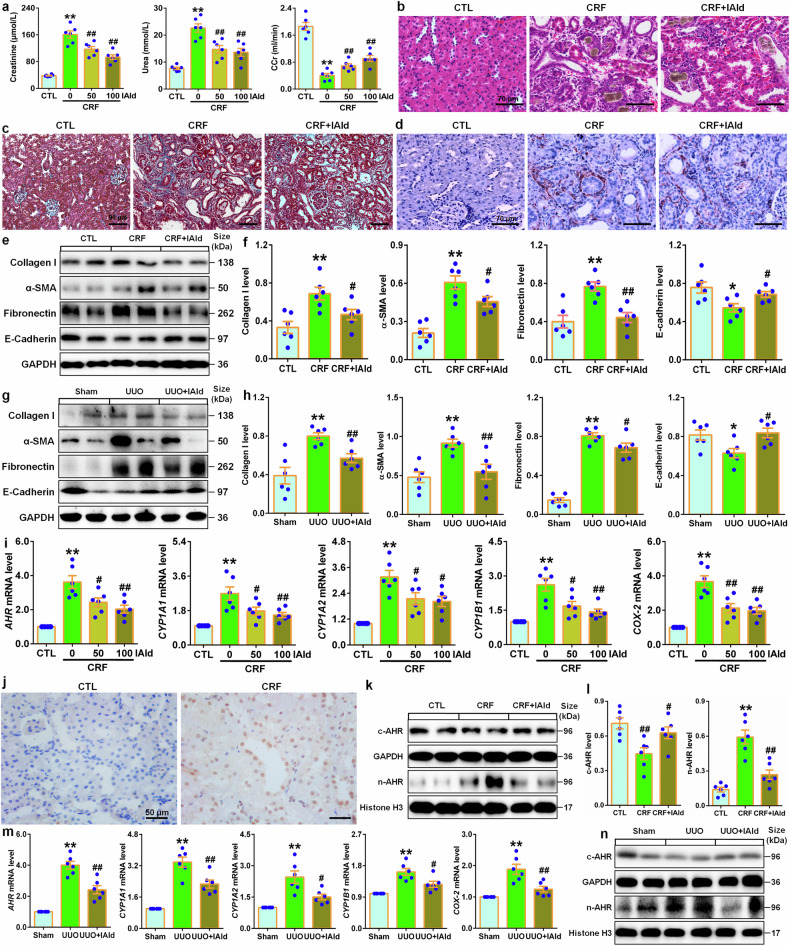
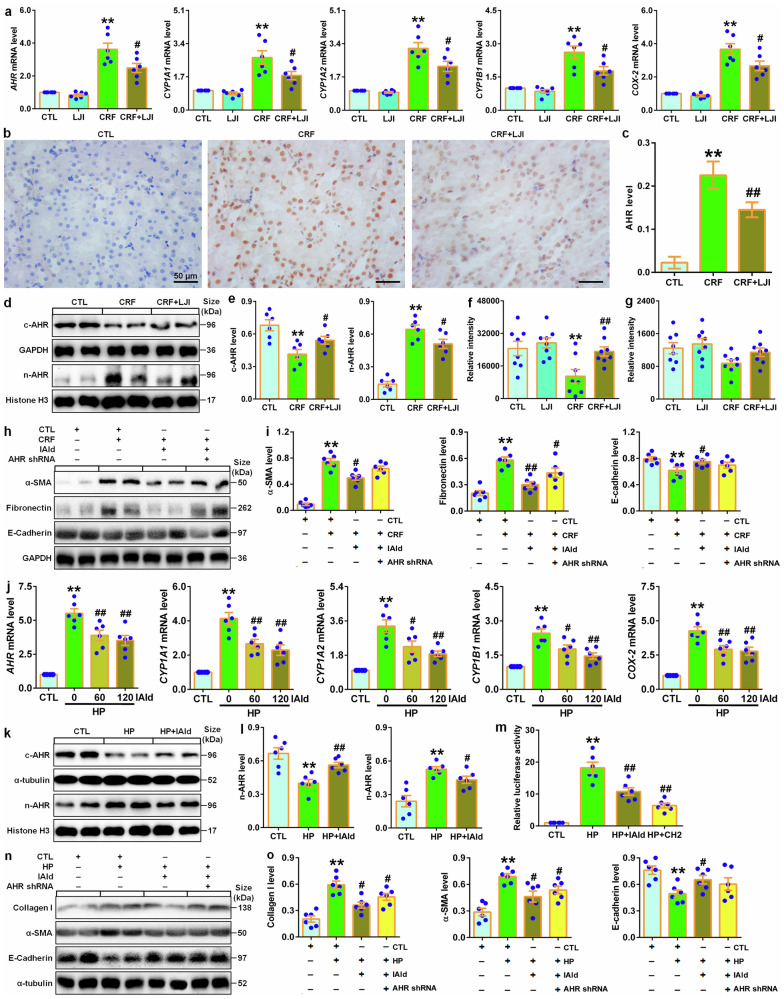
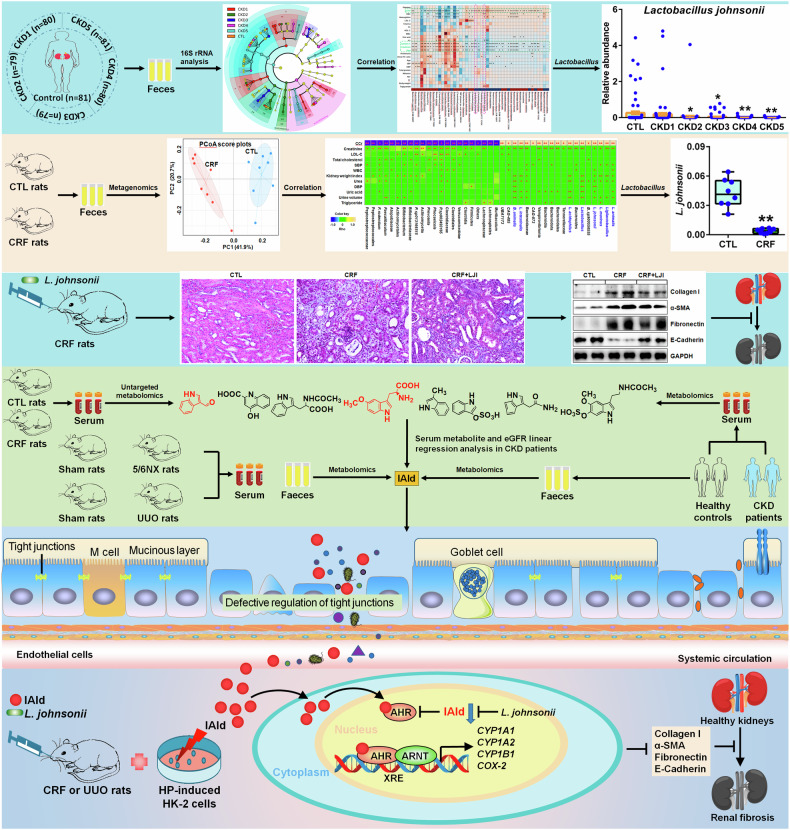
Accumulated evidence suggested that gut microbial dysbiosis interplayed with progressive chronic kidney disease (CKD). However, no available therapy is effective in suppressing progressive CKD. Here, using microbiomics in 480 participants including healthy controls and patients with stage 1-5 CKD, we identified an elongation taxonomic chain Bacilli-Lactobacillales-Lactobacillaceae-Lactobacillus-Lactobacillus johnsonii correlated with patients with CKD progression, whose abundance strongly correlated with clinical kidney markers. L. johnsonii abundance reduced with progressive CKD in rats with adenine-induced CKD. L. johnsonii supplementation ameliorated kidney lesion. Serum indole-3-aldehyde (IAld), whose level strongly negatively correlated with creatinine level in CKD rats, decreased in serum of rats induced using unilateral ureteral obstruction (UUO) and 5/6 nephrectomy (NX) as well as late CKD patients. Treatment with IAld dampened kidney lesion through suppressing aryl hydrocarbon receptor (AHR) signal in rats with CKD or UUO, and in cultured 1-hydroxypyrene-induced HK-2 cells. Renoprotective effect of IAld was partially diminished in AHR deficiency mice and HK-2 cells. Our further data showed that treatment with L. johnsonii attenuated kidney lesion by suppressing AHR signal via increasing serum IAld level. Taken together, targeting L. johnsonii might reverse patients with CKD. This study provides a deeper understanding of how microbial-produced tryptophan metabolism affects host disease and discovers potential pathways for prophylactic and therapeutic treatments for CKD patients.


Conflict of interest statement

The authors declare no competing interests.

Figures

Fig. 1
Fig. 1
Microbial dysbiosis in patients with CKD progression. a α-diversity (Chao, ACE, Shannon and Simpson indexes) in controls and five stages of CKD patients (control, n = 80/group; CKD1, n = 81/group; CKD2, n = 80/group; CKD3, n = 79/group; CKD4, n = 79/group; CKD5, n = 81/group). *P < 0.05, **P < 0.01 compared with healthy controls. b PCoA based on unweighted UniFrac in controls and five stages of CKD patients. c Cladogram presented crucial bacteria with an evolutionary relationship associated with CKD based on linear discriminant analysis effect size. Each circle showed a classification level from phylum to species, from the inner to outer circles. The size of each circle is proportional to relative abundance. d Associations between 4 significantly changed bacteria at the phylum level and 25 physiological and biochemical indexes in patients with CKD. e Associations between 6 significantly changed bacteria at the class level and 25 physiological and biochemical indexes in patients with CKD. f Associations between 11 significantly changed bacteria at the order level and 25 physiological and biochemical indexes in patients with CKD. *P < 0.05, **P < 0.01
Fig. 2
Fig. 2
Decreased Lactobacillus abundance correlated with renal function decline in patients with CKD progression. a Associations between 46 significantly changed bacteria at the species level and 25 physiological and biochemical indexes in patients with CKD. *P < 0.05, **P < 0.01. b Taxonomic distributions of bacteria at the genus level in controls and five stages of CKD. As shown by dashed box. c The relative abundances of Lactobacillaceae, Lactobacillus and Lactobacillus johnsonii in controls and five stages of CKD patients. *P < 0.05, **P < 0.01 compared with healthy controls (control, n = 80/group; CKD1, n = 81/group; CKD2, n = 80/group; CKD3, n = 79/group; CKD4, n = 79/group; CKD5, n = 81/group). Data are represented as mean ± SEM
Fig. 3
Fig. 3
Reduced L. johnsonii abundance positively correlated with renal function decline in adenine-induced CRF rats. a Simpson index of control and CRF rats at the gene level. *P < 0.05, **P < 0.01 compared with control rats (n = 8/group). b PCA and PCoA of control and CRF rats at the gene level. c Firmicutes/Bacteroidota ratio of control and CRF rats. *P < 0.05, **P < 0.01 compared with control rats (n = 8/group). d The abundance of 10 significantly differential bacteria of control and CRF rats at the species level. *P < 0.05, **P < 0.01 compared with control rats (n = 8/group). e Heatmap of the Spearman’s rank correlation coefficient showing 41 bacteria at the different levels that correlate with physiological and biochemical indexes linked positively or negatively to CRF. Rho in the color key represents the Spearman rank correlation coefficient. *P < 0.05, **P < 0.01. Data are represented as mean ± SEM
Fig. 4
Fig. 4
L. johnsonii administration ameliorates renal fibrosis in the adenine-induced CRF rats. a Serum levels of creatinine and urea in the control, CRF and LJI-treated CRF rats. b Images of H&E-stained kidney tissues of control, CRF and LJI-treated CRF rats. Scale bar, 60 μm. c Images of Masson’s trichrome-stained kidney tissues of control, CRF and LJI-treated CRF rats. Scale bar, 90 μm. d Protein levels of intrarenal collagen I, α-SMA, fibronectin and E-cadherin in control, CRF and LJI-treated CRF rats. e Quantitative analysis of intrarenal collagen I, α-SMA, fibronectin and E-cadherin levels in control, CRF and LJI-treated CRF rats. f Protein expression of ZO1, occludin and claudin-1 of colon tissues in control, CRF and LJI-treated CRF rats. g Quantitative analysis of ZO1, occludin and claudin-1 expression of colon tissues in control, CRF and LJI-treated CRF rats. h The abundance of fecal LJI in the adenine-induced CRF rats treated with BSA and HMF. *P < 0.05, **P < 0.01 compared with control rats (n = 6/group). #P < 0.05, ##P < 0.01 compared with CRF rats (n = 6/group). Data are represented as mean ± SEM
Fig. 5
Fig. 5
Significantly altered indole metabolites of tryptophan are correlated with renal function decline in the adenine-induced CRF rats. a The geometric mean ratio of each variable in CRF rats versus control rats was presented in positive and negative ion modes. b Pie chart based on 314 serum metabolites from control and CRF rats. c Pie chart based on 102 amino acid metabolites from control and CRF rats. d z-score plot of 314 metabolites in control and CRF rats. Each point represents an individual metabolite in one sample. Z-score plots for the data are normalized to the mean of control samples. e The associations between creatinine levels and intensities of tryptophan metabolites in CRF rats. Metabolites were selected based on r > 0.800. f Top metabolites presented by VIP scores based on classification method of linear support vector machines by feature ranking method of support vector machines built-in. Support vector machines models were constructed with tryptophan and its 39 metabolites from control and CRF rats. Red and blue indicate increased and decreased levels, respectively. g Analysis of PLS-DA based ROC curves of 4 tryptophan metabolites by gut microbiota in control and CRF rats. h Analysis of PLS-DA based ROC curves of 4 tryptophan metabolites by host in control and CRF rats
Fig. 6
Fig. 6
Aberrant microbial-derived indole derivatives from tryptophan metabolism were associated with CKD patients. a Violin plot showing the relative levels of eight tryptophan metabolites in controls and CKD patients. In the plot, the median, 75th percentile and 25th percentile are represented by the center line, upper dashed line and lower dashed line, respectively. *P < 0.05, **P < 0.01 compared with controls (controls, n = 80/group; CKD, n = 120/group). b PCA score plots of eight tryptophan metabolites from 80 controls and 120 CKD patients. c OPLS-DA score plots of eight tryptophan metabolites from 80 control and 120 CKD patients. d Diagnostic performances of eight tryptophan metabolites based on the support vector machines method. The black circles with red squares are for the incorrectly predicted samples in control group. e Heatmap of eight tryptophan metabolites between controls and CKD patients. f Analysis of PLS-DA based ROC curves of eight tryptophan metabolites in controls and CKD patients
Fig. 7
Fig. 7
Reduced serum IAld level correlated with renal function decline in CKD patients and rat models. a Associations between levels of eight tryptophan metabolites and eGFR in CKD patients. b Combined box-and-whisker and dot plot of levels of IAld and 5-methoxytryptophan in serum of Sham and NX rats. Mean values are presented by horizontal bars. The whiskers indicate the maximum and minimum points (n = 8/group). c The associations between creatinine levels and IAld and 5-methoxytryptophan levels in NX rats. d Combined box-and-whisker and dot plot of levels of IAld and 5-methoxytryptophan in serum of Sham and UUO rats. Mean values are presented by horizontal bars. The whiskers indicate the maximum and minimum points. *P < 0.05, **P < 0.01 compared with Sham rats (n = 8/group). e The associations between tubulointerstitial damage score and IAld and 5-methoxytryptophan levels in UUO rats. f Relative levels of IAld and 5-methoxytryptophan in feces of control and CRF rats (n = 8/group). g Relative levels of IAld and 5-methoxytryptophan in feces of Sham and NX rats (n = 8/group). h Relative levels of IAld and 5-methoxytryptophan in feces of Sham and UUO rats (n = 8/group). i Relative levels of IAld and 5-methoxytryptophan in feces of healthy controls and CKD patients (n = 8/group). Data are represented as mean ± SEM
Fig. 8
Fig. 8
The renoprotective effect of IAld and L. johnsonii administration were associated with inhibiting AHR signaling pathway. a Serum creatinine and urea levels and CCr in the control, CRF and different doses of IAld-treated CRF rats. b Images of H&E-stained kidney tissues in the control, CRF and IAld-treated CRF rats. Scale bar, 70 μm. c Images of Masson’s trichrome-stained kidney tissues in the control, CRF and IAld-treated CRF rats. Scale bar, 90 μm. d Immunohistochemical findings with anti-α-SMA of kidney tissues in the control, CRF and IAld-treated CRF rats. Scale bar, 70 μm. e Protein expression of collagen I, α-SMA, fibronectin and E-cadherin of kidney tissues in control, CRF and IAld-treated CRF rats. f Quantitative analysis of collagen I, α-SMA, fibronectin and E-cadherin of kidney tissues in the control, CRF and IAld-treated CRF rats. g Protein expression of collagen I, α-SMA, fibronectin and E-cadherin of kidney tissues in the Sham, UUO and IAld-treated UUO rats. h Quantitative analysis of collagen I, α-SMA, fibronectin and E-cadherin of kidney tissues in the Sham, UUO and IAld-treated UUO rats. i The mRNA levels of AHR and its target genes including CYP1A1, CYP1A2, CYP1B1 and COX-2 of kidney tissues in the control, CRF and different doses of IAld-treated CRF rats. j Immunohistochemical analysis with anti-AHR of kidney tissues in the control and CRF rats. k Protein expression of AHR in cytoplasm and nuclei of kidney tissues in the control, CRF and IAld-treated CRF rats. l Quantitative analysis of AHR expression in cytoplasm and nuclei of kidney tissues in the control, CRF and IAld-treated CRF rats. m Obstructed intrarenal mRNA levels of AHR and its target genes including CYP1A1, CYP1A2, CYP1B1 and COX-2 in the Sham, UUO and IAld-treated UUO rats. n Protein expression of AHR in cytoplasm and nuclei of kidney tissues in the Sham, UUO and IAld-treated UUO rats. *P < 0.05; **P < 0.01 compared with control or sham rats (n = 6/group). #P < 0.05; ##P < 0.01 compared with CRF or UUO rats (n = 6/group). Data are represented as mean ± SEM
Fig. 9
Fig. 9
IAld protected against renal fibrosis through inhibiting AHR signaling pathway. a Intrarenal mRNA levels of AHR and its target genes including CYP1A1, CYP1A2, CYP1B1 and COX-2 in the control, LJI, CRF and LJI-treated CRF rats. b Immunohistochemical analysis with anti-AHR of kidney tissues in the control, CRF and LJI-treated CRF rats. Scale bar, 50 μm. c Quantitative analysis of immunohistochemistry with anti-AHR of kidney tissues in the control, CRF and LJI-treated CRF rats. d Protein expression of AHR in cytoplasm and nuclei of kidney tissues in the control, CRF and LJI-treated CRF rats. e Quantitative analysis of AHR expression in cytoplasm and nuclei of kidney tissues in the control, CRF and LJI-treated CRF rats. f Serum IAld relative intensity in the control, LJI, CRF and LJI-treated CRF rats. g Fecal IAld relative intensity in the control, LJI, CRF and LJI-treated CRF rats. h Protein expression of α-SMA, fibronectin and E-cadherin of kidney tissues in indicated groups. i Quantitative analyses of α-SMA, fibronectin and E-cadherin of kidney tissues in indicated groups. j The mRNA expression levels of AHR and its target genes including CYP1A1, CYP1A2, CYP1B1 and COX-2 in indicated groups. k Protein levels of AHR in cytoplasm and nuclei of HK-2 cells in indicated groups. l Quantitative analysis of AHR expression in in cytoplasm and nuclei of HK-2 cells in indicated groups. m Luciferase assays of AHR of HK-2 cells in indicated groups. n Protein levels of α-SMA, fibronectin and E-cadherin of HK-2 cells in indicated groups. o Quantitative analyses of α-SMA, fibronectin and E-cadherin of HK-2 cells in indicated groups. Dot presents the single data results in bar graph. *P < 0.05; **P < 0.01 compared with control rats or cells (n = 6/group). #P < 0.05; ##P < 0.01 compared with adenine-induced CRF rats or HP-induced HK-2 cells (n = 6/group). Data are represented as mean ± SEM
Fig. 10
Fig. 10
Renoprotective effects of L. johnsonii and molecular mechanism by AHR inhibition via IAld in CKD. An elongation chain Bacilli-Lactobacillales-Lactobacillaceae-Lactobacillus-L. johnsonii correlated with renal function decline in patients with CKD progression. Reduced L. johnsonii abundance was further observed in feces of CRF rats. L. johnsonii supplementation ameliorated renal injury and fibrosis. Eight metabolites were associated with kidney function. Serum IAld was further verified by rats induced by NX and UUO as well as CKD patients. IAld levels correlated with eGFR in CKD patients. IAld were produced by L. johnsonii via IpyA metabolic pathway. Treatment with IAld or L. johnsonii could ameliorate renal injury and fibrosis via AHR signaling pathway in CRF and/or UUO rats as well as HP-stimulated HK-2 cells. Parts of this schematic was created using Servier Medical Art, CC BY 4.0

References

    1. Matsushita, K. et al. Epidemiology and risk of cardiovascular disease in populations with chronic kidney disease. Nat. Rev. Nephrol.18, 696–707 (2022). 10.1038/s41581-022-00616-6 - DOI - PubMed
    1. Huang, R., Fu, P. & Ma, L. Kidney fibrosis: from mechanisms to therapeutic medicines. Signal Transduct. Target Ther.8, 129 (2023). 10.1038/s41392-023-01379-7 - DOI - PMC - PubMed
    1. Krukowski, H. et al. Gut microbiome studies in CKD: opportunities, pitfalls and therapeutic potential. Nat. Rev. Nephrol.19, 87–101 (2023). 10.1038/s41581-022-00647-z - DOI - PubMed
    1. Ravid, J. D., Kamel, M. H. & Chitalia, V. C. Uraemic solutes as therapeutic targets in CKD-associated cardiovascular disease. Nat. Rev. Nephrol.17, 402–416 (2021). 10.1038/s41581-021-00408-4 - DOI - PubMed
    1. Eddy, S., Mariani, L. H. & Kretzler, M. Integrated multi-omics approaches to improve classification of chronic kidney disease. Nat. Rev. Nephrol.16, 657–668 (2020). 10.1038/s41581-020-0286-5 - DOI - PubMed

Publication types