. 2024 Aug;28(15):e18549.
doi: 10.1111/jcmm.18549.

Integrating single-cell transcriptomics and machine learning to predict breast cancer prognosis: A study based on natural killer cell-related genes

Affiliations

Integrating single-cell transcriptomics and machine learning to predict breast cancer prognosis: A study based on natural killer cell-related genes

Juanjuan Mao et al. J Cell Mol Med. 2024 Aug.

Abstract

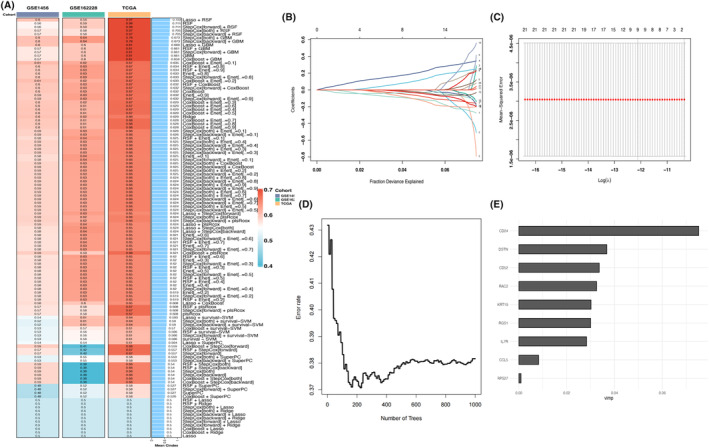
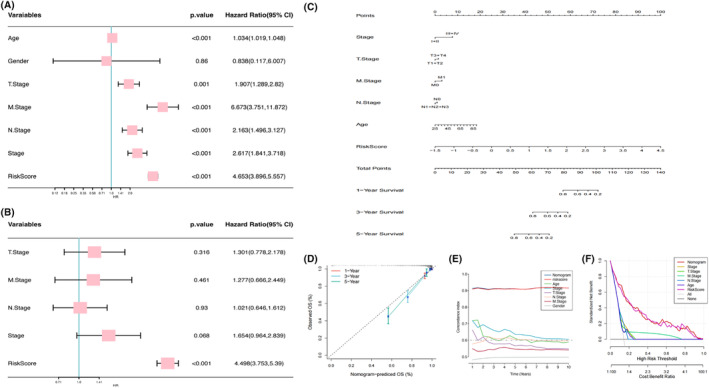
Breast cancer (BC) is the most commonly diagnosed cancer in women globally. Natural killer (NK) cells play a vital role in tumour immunosurveillance. This study aimed to establish a prognostic model using NK cell-related genes (NKRGs) by integrating single-cell transcriptomic data with machine learning. We identified 44 significantly expressed NKRGs involved in cytokine and T cell-related functions. Using 101 machine learning algorithms, the Lasso + RSF model showed the highest predictive accuracy with nine key NKRGs. We explored cell-to-cell communication using CellChat, assessed immune-related pathways and tumour microenvironment with gene set variation analysis and ssGSEA, and observed immune components by HE staining. Additionally, drug activity predictions identified potential therapies, and gene expression validation through immunohistochemistry and RNA-seq confirmed the clinical applicability of NKRGs. The nomogram showed high concordance between predicted and actual survival, linking higher tumour purity and risk scores to a reduced immune score. This NKRG-based model offers a novel approach for risk assessment and personalized treatment in BC, enhancing the potential of precision medicine.

Keywords: breast cancer; immune microenvironment; machine learninge; natural killer cells; precision medicine.


Conflict of interest statement

This study does not involve any conflicts of interest.

Figures

FIGURE 1
FIGURE 1
Single‐cell transcriptomics analysis and identification of NK cell marker genes. (A) t‐SNE identified cell clusters; (B) distribution map of t‐SNE in eight cell subclusters; (C) heatmap showing the gene distribution in every cell type, with colour shades representing the level of gene expression; (D) network diagram; and (E) clustering tree showing the functional enrichment results of 44 genes.
FIGURE 2
FIGURE 2
Construction of NKRG models based on 101 machine learning algorithms. (A) Construction of prognostic models using 101 machine learning algorithms and analysis of the C‐index within three datasets; (B) trajectory maps; (C) feature coefficients calculated by Lasso and screened by 10‐fold cross‐validation; further screening using RSF; (D) error rate curves showing the trend of the oob error rate with the number of counts; and (E) bar plot showing the nine variables that significantly contributed to survival time.
FIGURE 3
FIGURE 3
Relationship between patient risk scores and survival status in three datasets. (A) TCGA; (B) GSE162228; and (C) GSE1456 datasets, K‐M curves and time‐dependent ROC curves of patient risk scores versus survival status.
FIGURE 4
FIGURE 4
Comparison of clinicopathological characteristics between patients with high‐ and low‐risk scores. (A) Distribution of patients with different clinicopathological features across risk classes; association between risk classes and patients' (B) age; (C) survival time; (D) stage; (E) TNM N; and (F) TNM M.
FIGURE 5
FIGURE 5
K‐M curves and ROC curves for high‐ and low‐risk patients with different clinical features. (A) Age >60 years; (B) age ≤60 years; (C) Stage I + II; (D) Stage III + IV; (E) TNM N0; (F) TNM N1N3; (G) TNM M0; ROC curves of patients with (H) age >60 years; (I) age ≤60 years; (J) Stage I + II; (K) Stage III + IV; (L) TNM N0; (M) TNM N1N3; and (N) TNM M0.
FIGURE 6
FIGURE 6
Construction of column line graph and validation. (A) Univariate and (B) multivariate cox analyses between disparate clinicopathological features and risk score; (C) nomogram constructed based on disparate clinicopathological features and risk score; (D) calibration curves; (E) C‐index plots; and (F) decision curve analyses to compare the predictive performance of the nomogram.
FIGURE 7
FIGURE 7
Potential enrichment analysis of patients in risk groups. (A) Ridgeline plot by GSEA showing significantly enriched biopathways in the low‐risk group; (B) GSEA plot exhibiting significantly enriched biological pathways in high‐risk group; (C) results of GSVA analysis of biological pathways in the high‐ and low‐risk groups; (D) association matrix heatmap revealing significant correlation between risk score and biopathway activity; and (E) relationship between TNFα signalling pathway activity and survival prognosis of breast cancer patients.
FIGURE 8
FIGURE 8
Mutation analysis of various risk levels. (A) Differences in MATH scores between risk groups; (B) K‐M curves showing differences in OS between high‐ and low‐risk groups and high and low MATH score groups; Waterfall plots showing somatic mutation landscapes in (C) high‐risk; (D) low‐risk patients; (E) heatmap showing the association of co‐occurring and exclusive mutations in the top 20 mutated genes in the high‐ and low‐risk groups; and (F) distribution of CNV frequencies in the DEG between the high‐ and low‐risk groups, with red dots indicating GAIN frequency and green dots indicating the frequency of LOSS.
FIGURE 9
FIGURE 9
Differences in communication networks associated with intercellular heterogeneity and NK cell‐related genes. (A) Expression levels of 9 hub genes in scRNA‐seq and intercellular heterogeneity; (B) differential analysis of significantly enriched signals between high‐risk and low‐risk cell populations; (C) results of Gene set enrichment analysis analysis demonstrating biological pathways significantly enriched in the high‐risk group; (D) cell–cell communication networks between high‐risk; (E) low‐risk NK cells and other cell types; and (F) communication signalling differences in the MIF pathway between different risk NK cells.
FIGURE 10
FIGURE 10
Correlation between NKRGs and tumour immune microenvironment. Comparison of (A) StromalScore; (B) ImmuneScore; (C) ESTIMATEScore; (D) tumour purity in risk groups; (E) ssGSEA demonstrates the difference in activity of immune pathways; (F) Violin plot demonstrating differences in the proportion of immune cells in different risk levels; (G) Heatmap demonstrating the correlation between the nine hub genes and the proportion of immune cells; (H) Lollipop plot demonstrating the correlation between the proportion of immune cell types and NKRGs; (I) HE staining images of tissues from the high‐risk group; and (J) HE staining images of tissues from the low‐risk group. *p〈0.05, **p〈0.01, and ***p〈0.001.
FIGURE 11
FIGURE 11
Association between NKRGs and clinical effectiveness and drug prediction. (A) Presentation of the comparison of risk scores in the stable disease (SD), progressive disease (PD), complete response (CR), as well as partial response (PR) groups across the entire dataset; (B) comparison of risk scores in the clinically ineffective response (PD/SD) and effective response groups; (C) comparison of differences between clinical responses between high‐ and low‐risk groups using stacked histograms; (D) heatmap showing the drug activity of different drugs in different cell lines; and (E) the five drugs most likely to inhibit malignant progression of breast cancer were calculated using XSum analysis. *p〈0.05, **p〈0.01, and ***p〈0.001.
FIGURE 12
FIGURE 12
Gene expression validation of NKRGs. (A) Expression of 9 genes in BC tumour and corresponding normal tissue samples in the TCGA and GTEx; (B) expression of 9 genes in paired samples in the TCGA breast cancer dataset; IHC showing expression of (C) BTG1; (D) CCL5; (E) CD24; (F) DSTN; (G) IL7R; (H) KRT19; (I) RAC2; and (J) RGS1 in breast cancer tumour samples and normal samples.

Similar articles

Cited by

References

    1. Zhang JH, Hou R, Pan Y, et al. A five‐microRNA signature for individualized prognosis evaluation and radiotherapy guidance in patients with diffuse lower‐grade glioma. J Cell Mol Med. 2020;24(13):7504‐7514. - PMC - PubMed
    1. Gao F‐Y, Li X‐T, Xu K, Wang R‐T, Guan X‐X. c‐MYC mediates the crosstalk between breast cancer cells and tumor microenvironment. Cell Commun Signal. 2023;21(1):28. - PMC - PubMed
    1. Chen S, Zhou Z, Li Y, Du Y, Chen G. Application of single‐cell sequencing to the research of tumor microenvironment. Front Immunol. 2023;14:1285540. - PMC - PubMed
    1. Xie L, Meng Z. Immunomodulatory effect of locoregional therapy in the tumor microenvironment. Mol Ther. 2023;31(4):951‐969. - PMC - PubMed
    1. Ren X, Zhang L, Zhang Y, Li Z, Siemers N, Zhang Z. Insights gained from single‐cell analysis of immune cells in the tumor microenvironment. Annu Rev Immunol. 2021;39:583‐609. - PubMed

Substances