Randomized Controlled Trial
. 2024 Sep 24;9(18):e180115.
doi: 10.1172/jci.insight.180115.

Cytomegalovirus immunity in high-risk liver transplant recipients following preemptive antiviral therapy versus prophylaxis

Affiliations
Randomized Controlled Trial

Cytomegalovirus immunity in high-risk liver transplant recipients following preemptive antiviral therapy versus prophylaxis

Danniel Zamora et al. JCI Insight. .

Abstract

CMV-specific T cells, NK cells, and neutralizing antibodies (nAbs) were assessed in a randomized trial of CMV prevention with preemptive antiviral therapy (PET) versus prophylactic antiviral therapy (PRO) in donor-seropositive/recipient-seronegative (D+R-) liver transplant recipients (LTxR) at 100 days (end of intervention) and at 6 and 12 months after transplant. The PET group had significantly increased numbers of circulating polyfunctional T cells, NK cells, and nAbs compared with the PRO group at day 100, and several CMV immune parameters remained significantly higher by 12 months after transplant. Among PET recipients, preceding CMV viremia (vs. no preceding viremia) was associated with significantly higher levels of most CMV immune parameters at day 100. Higher numbers of CMV-specific polyfunctional T cells and NKG2C+ NK cells at day 100 were associated with a decreased incidence of CMV disease in multivariable Cox regression. The strongest associations with protection against CMV disease were with increased numbers of CMV-specific polyfunctional CD4+ T cells, CD3negCD56dimCD57negNKG2Cpos cells, and CD3negCD56dimCD57posNKG2Cpos NK cells. Our results suggest that PET is superior to PRO for CMV disease prevention by allowing low-level CMV replication and associated antigen exposure that is promptly controlled by antiviral therapy and facilitates enhanced CMV protective immunity in D+R- LTxR.

Keywords: Cellular immune response; Drug therapy; Infectious disease; Transplantation.


Figures
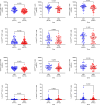
Figure 1
Figure 1. Absolute counts and proportions of antigen-experienced T cells at 100 days, 6 months, and 12 months after transplant based on the expression of CD57.
CD8+ and CD4+ T cells were described as antigen-experienced based on cell surface level expression of CD57. CD57+ T cells were measured under nonstimulated testing conditions and are shown in PET vs. PRO recipients at all 3 time points. For absolute cell counts, 0 values were imputed as a low value (i.e., less than minimum of distribution) for graphing purposes owing to logarithmic scale conversion. Dotted black lines represent median values, and whiskers represent interquartile range. Comparisons were made using 2-sided Wilcoxon’s rank-sum testing at 95% CI.
Figure 2
Figure 2. Absolute polyfunctional T cell counts following stimulation with CMV phosphoprotein 65.
Absolute polyfunctional CMV-specific T cell counts based on the expression of IFN-γ plus at least 1 additional functional marker at 100 days, 6 months, and 12 months after transplant following stimulation with CMV phosphoprotein 65 (pp65) overlapping peptide library. For absolute cell counts, 0 values were imputed as a low value (i.e., less than minimum of distribution) for graphing purposes owing to logarithmic scale conversion. Dotted black lines represent median values, and whiskers represent interquartile range. Comparisons were made using 2-sided Wilcoxon’s rank-sum testing at 95% CI.
Figure 3
Figure 3. COMPASS polyfunctionality scores following stimulation with CMV phosphoprotein 65.
COMPASS polyfunctionality scores (PFSs) at 100 days, 6 months, and 12 months after transplant following stimulation with CMV phosphoprotein 65 (pp65) overlapping peptide library. Patients were grouped according to treatment arm: PET (blue) vs. PRO (red). Dotted black lines represent median values, and whiskers represent interquartile range. Comparisons were made using 2-sided Wilcoxon’s rank-sum testing at 95% CI.
Figure 4
Figure 4. Absolute counts of NK cell subtypes at 100 days, 6 months, and 12 months after transplant.
NK cell subsets were categorized based on cell surface level expression of CD56 (i.e., bright vs. dim) and CD57 (i.e., positive vs. negative). Specifically, absolute counts of CD3negCD56brightCD57negNKG2Cpos, CD3negCD56dimCD57negNKG2Cpos, and CD3negCD56dimCD57posNKG2Cpos NK cells are shown in PET vs. PRO recipients at all 3 time points. For absolute cell counts, 0 values were imputed as a low value (i.e., less than minimum of distribution) for graphing purposes owing to logarithmic scale conversion. Dotted black lines represent median values, and whiskers represent interquartile range. Comparisons were made using 2-sided Wilcoxon’s rank-sum testing at 95% CI.
Figure 5
Figure 5. Epithelial cell entry-specific neutralizing antibody titers by treatment arm.
Epithelial cell entry-specific neutralizing antibody (nAb) titers at approximately 100 days, 6 months, and 12 months after transplant. Patients were grouped according to treatment arm: PET (blue) vs. PRO (red). Dilution titers were calculated from IC50 values for graphing purposes by taking the antilog2 of each value. For example, an IC50 of 5 corresponds to a CMV nAb dilution titer of 32. Solid black lines represent the median nAb dilution titer for each group. Comparisons were made using 2-sided Wilcoxon’s rank-sum testing at 95% CI.
Figure 6
Figure 6. T cell, NK cell, and humoral immune responses in PET recipients with and without preceding CMV DNAemia.
Immune parameters at 100 days after transplant in PET recipients (N = 73) stratified by preceding detectable CMV DNAemia by qPCR in the first 100 days after transplant. Patients were grouped according to positive (blue) or negative (red) CMV DNAemia in the first 100 days after transplant. Examined immune parameters included terminally differentiated (A) CD8+ and (B) CD4+ T cell counts based on the expression of CD57; CMV-specific polyfunctional absolute (C) CD8+ and (D) CD4+ T cell counts; COMPASS (E) CD8 and (F) CD4 polyfunctionality scores (PFSs); absolute counts of (G) CD3negCD56brightCD57negNKG2Cpos, (H) CD3negCD56dimCD57negNKG2Cpos, (I) and CD3negCD56dimCD57posNKG2Cpos NK cells; and (J) CMV epithelial cell entry-specific neutralizing antibody (nAb) dilution titers. Polyfunctional T cell counts were defined as those expressing IFN-γ plus at least 1 additional functional marker. Dilution titers were calculated from IC50 values for graphing purposes by taking the antilog2 of each value. For example, an IC50 of 5 corresponds to a CMV nAb dilution titer of 32. For absolute cell counts, 0 values were imputed as a low value (i.e., less than minimum of distribution) for graphing purposes owing to logarithmic scale conversion. Solid black lines represent values, and whiskers represent interquartile range. Comparisons were made using 2-sided Wilcoxon’s rank-sum testing at 95% CI.
Figure 7
Figure 7. Cumulative incidence of late CMV disease after high-risk, CMV D+R liver transplant stratified by baseline CMV-specific NK cell and T cell immunity.
The cumulative incidence of endpoint-adjudicated late CMV disease after high-risk, CMV D+R liver transplant stratified by baseline CMV-specific T cell immunity measured following discontinuation of study intervention after transplant day 100. Time-to-event curves were stratified by the dichotomous threshold cutoffs listed in Table 2 for (A) CD3negCD56brightCD57posNKG2Cpos, (B) CD3negCD56dimCD57negNKG2Cpos, (C) CD3negCD56dimCD57posNKG2Cpos NK Cells, (D) polyfunctional absolute CD8+ T cell counts, (E) CD8 polyfunctionality scores, (F) CD8 functionality scores, (G) polyfunctional absolute CD4+ T cell counts, (H) CD4 polyfunctionality scores, (I) CD4 functionality scores, (J) neutralizing antibodies, and (K) absolute lymphocyte count. Patients with above-threshold levels of immune parameters (blue curves) were compared with patients with below-threshold levels of immune parameters (red curves).
Figure 8
Figure 8. Cumulative incidence of late CMV disease after high-risk, CMV D+R liver transplant stratified by baseline CMV-specific NK cell or T cell immunity with neutralizing antibody titers.
The cumulative incidence of endpoint-adjudicated delayed-onset CMV disease following high-risk, CMV D+R liver transplant according to combined cellular and humoral immune parameters measured following discontinuation of study intervention after transplant day 100. Time-to-event curves were stratified by posttransplant day 100 immunity above (purple and teal curves) or below (green and red curves) the dichotomous thresholds listed in Table 2 for (A) CD3negCD56brightCD57negNKG2Cpos, (B) CD3negCD56dimCD57negNKG2Cpos, (C) CD3negCD56dimCD57posNKG2Cpos NK cells, (D) polyfunctional absolute CD8+ T cell counts, (E) CD8 polyfunctionality scores, (F) CD8 functionality scores, (G) polyfunctional absolute CD4+ T cell counts, (H) CD4 polyfunctionality scores, (I) CD4 functionality scores, and (J) absolute lymphocyte count combined with neutralizing antibody dilution titers >32 (green and purple curves) or ≤32 (red and teal curves), which is equivalent to a log2 neutralizing antibody (nAb) dilution titer (i.e., IC50) of 5.
Figure 9
Figure 9. Variable correlation plots of principal component analysis results.
Variable correlation plots of relationships between all examined immune parameters based on principal component analysis (PCA) results. Positively correlated immune parameters are grouped together, whereas negatively correlated immune parameters appear on opposite sides of the plot origin. The quality immune parameter representation in the PCA is displayed according to the distance of each immune parameter vector and the origin the square cosine (i.e., cos2) of each immune parameter where a high cos2 (i.e., green vector) indicates good representation and a low cos2 (i.e., black vector) indicates poor representation.

References

    1. Limaye AP, et al. Progress and challenges in the prevention, diagnosis, and management of cytomegalovirus infection in transplantation. Clin Microbiol Rev. 2020;34(1):e00043-19. doi: 10.1128/CMR.00043-19. - DOI - PMC - PubMed
    1. Vutien P, et al. Association of donor and recipient cytomegalovirus serostatus on graft and patient survival in liver transplant recipients. Liver Transpl. 2021;27(9):1302–1311. doi: 10.1002/lt.26045. - DOI - PMC - PubMed
    1. Imlay H, et al. Increasing proportion of high-risk cytomegalovirus (CMV) donor positive/recipient negative (D+R-) serostatus in solid organ transplant recipients (SOTRs) Transplantation. 2023;107(4):988–993. doi: 10.1097/TP.0000000000004352. - DOI - PMC - PubMed
    1. Doss KM, et al. Updates in cytomegalovirus prevention and treatment in solid organ transplantation. Infect Dis Clin North Am. 2023;Nov 20:S0891-5520(23)00083-1. doi: 10.1016/j.idc.2023.10.001. - DOI - PMC - PubMed
    1. Kumar L, et al. A systematic review and meta-analysis of optimized CMV preemptive therapy and antiviral prophylaxis for CMV disease prevention in CMV high-risk (D+R-) kidney transplant recipients. Transplant Direct. 2023;9(8):e1514. doi: 10.1097/TXD.0000000000001514. - DOI - PMC - PubMed

Publication types