. 2024 Jun 19;11(6):240271.
doi: 10.1098/rsos.240271. eCollection 2024 Jun.

Identifying prey capture events of a free-ranging marine predator using bio-logger data and deep learning

Affiliations

Identifying prey capture events of a free-ranging marine predator using bio-logger data and deep learning

Stefan Schoombie et al. R Soc Open Sci. .

Abstract

Marine predators are integral to the functioning of marine ecosystems, and their consumption requirements should be integrated into ecosystem-based management policies. However, estimating prey consumption in diving marine predators requires innovative methods as predator-prey interactions are rarely observable. We developed a novel method, validated by animal-borne video, that uses tri-axial acceleration and depth data to quantify prey capture rates in chinstrap penguins (Pygoscelis antarctica). These penguins are important consumers of Antarctic krill (Euphausia superba), a commercially harvested crustacean central to the Southern Ocean food web. We collected a large data set (n = 41 individuals) comprising overlapping video, accelerometer and depth data from foraging penguins. Prey captures were manually identified in videos, and those observations were used in supervised training of two deep learning neural networks (convolutional neural network (CNN) and V-Net). Although the CNN and V-Net architectures and input data pipelines differed, both trained models were able to predict prey captures from new acceleration and depth data (linear regression slope of predictions against video-observed prey captures = 1.13; R 2 ≈ 0.86). Our results illustrate that deep learning algorithms offer a means to process the large quantities of data generated by contemporary bio-logging sensors to robustly estimate prey capture events in diving marine predators.

Keywords: accelerometer; animal behaviour classification; animal-borne video; chinstrap penguin; foraging ecology; machine learning.


Conflict of interest statement

We declare we have no competing interests.

Figures
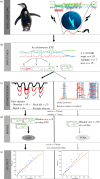
Workflow from data acquisition to model output.
Figure 1.
Workflow from data acquisition to model output. (a) Bio-logging data (tri-axial acceleration, depth and video) are time synchronized and labelled where PCE are observed in the video. (b) The input data used in the models are the three accelerometer axes, which are (c) balanced through dive thresholds for CNN and using a global generator (fig. 3 in [37]) with random sampling windows for V-Net. (d) The data are fed into the CNN model in windows of eight data points with 50% overlap, and windows of 128 data points with no overlap for V-Net. (e) The trained models are used to predict PCE for 15 individuals (not used during training) and predicted PCE are regressed against the labelled PCE for each dive to assess model performance.
A sequence of frames (a–d) lasting 0.16 s shows a chinstrap penguin catching an individual krill from a small swarm.
Figure 2.
A sequence of frames (a–d) lasting 0.16 s shows a chinstrap penguin catching an individual krill from a small swarm.
Example of labelled and predicted PCE from two chinstrap penguins, showing high-density foraging (a,c,e) and low-density foraging (b,d,f), respectively.
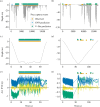
Figure 3.
Example of labelled and predicted PCE from two chinstrap penguins, showing high-density foraging (a,c,e) and low-density foraging (b,d,f), respectively. The total labelled data set (a,b) as well as single dives (c,d) show diving data (grey), labelled PCE (orange) and predicted PCE (blue and green). Accelerometer traces (e,f) for the individual dives are also shown. The gap in data in (f) is an area where no video was available owing to low ambient lightthe data for this part of the dive were removed for the analysis.
Predicted PCE from two deep learning models (a, CNN; b, V-Net) trained on tri-axial accelerometer data and validated with bird-borne video footage.
Figure 4.
Predicted PCE from two deep learning models (a, CNN; b, V-Net) trained on tri-axial accelerometer data and validated with bird-borne video footage. The predictions are from 15 penguins that were not used in the training of the models. The different coloured points represent individual penguins. Green dashed lines show the linear regression of annotated and predicted PCE per individual dive, while the red solid line shows a 1:1 linear regression.
Kernel density plots showing the distribution of PCE per dive, as observed from video loggers attached to chinstrap penguins and predicted by two deep learning models (CNN and V-Net).
Figure 5.
Kernel density plots showing the distribution of PCE per dive, as observed from video loggers attached to chinstrap penguins and predicted by two deep learning models (CNN and V-Net). Separate plots are shown for the different dive phases: (a) surface behaviour, (b) descent phase, (c) bottom phase and (d) ascent phase.

References

    1. Schmitz OJ, Hawlena D, Trussell GC. 2010. Predator control of ecosystem nutrient dynamics. Ecol. Lett. 13 , 1199–1209. (10.1111/j.1461-0248.2010.01511.x) - DOI - PubMed
    1. Gilbert L, Jeanniard-du-Dot T, Authier M, Chouvelon T, Spitz J. 2023. Composition of cetacean communities worldwide shapes their contribution to ocean nutrient cycling. Nat. Commun. 14 , 5823. (10.1038/s41467-023-41532-y) - DOI - PMC - PubMed
    1. Brooke MDL. 2004. The food consumption of the world’s seabirds. Proc. R. Soc. Biol. Sci. 271 , S246–S248. (10.1098/rsbl.2003.0153) - DOI - PMC - PubMed
    1. Smith LA, Link JS, Cadrin SX, Palka DL. 2015. Consumption by marine mammals on the Northeast U.S. continental shelf. Ecol. Appl. 25 , 373–389. (10.1890/13-1656.1) - DOI - PubMed
    1. Hentati‐Sundberg J, Olin AB, Evans TJ, Isaksson N, Berglund P, Olsson O. 2021. A mechanistic framework to inform the spatial management of conflicting fisheries and top predators. J. Appl. Ecol. 58 , 125–134. (10.1111/1365-2664.13759) - DOI

LinkOut - more resources