. 2024 Jul 20;14(14):e5033.
doi: 10.21769/BioProtoc.5033.

Analysis of Guard Cell Readouts Using Arabidopsis thaliana Isolated Epidermal Peels

Affiliations

Analysis of Guard Cell Readouts Using Arabidopsis thaliana Isolated Epidermal Peels

Rosario Pantaleno et al. Bio Protoc. .

Abstract

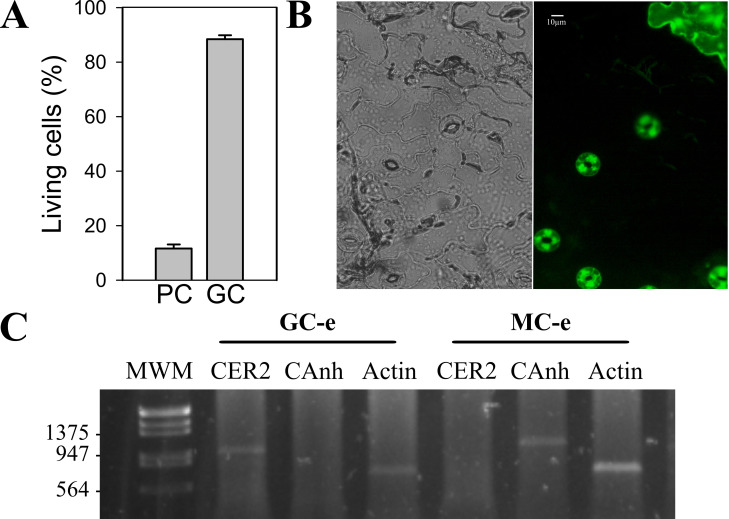
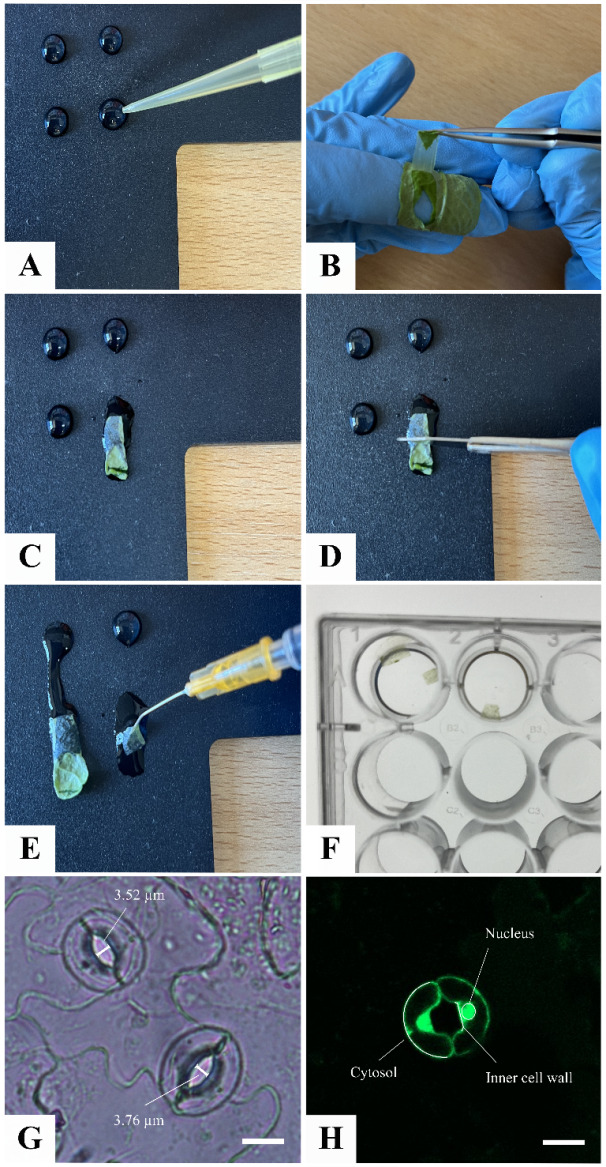
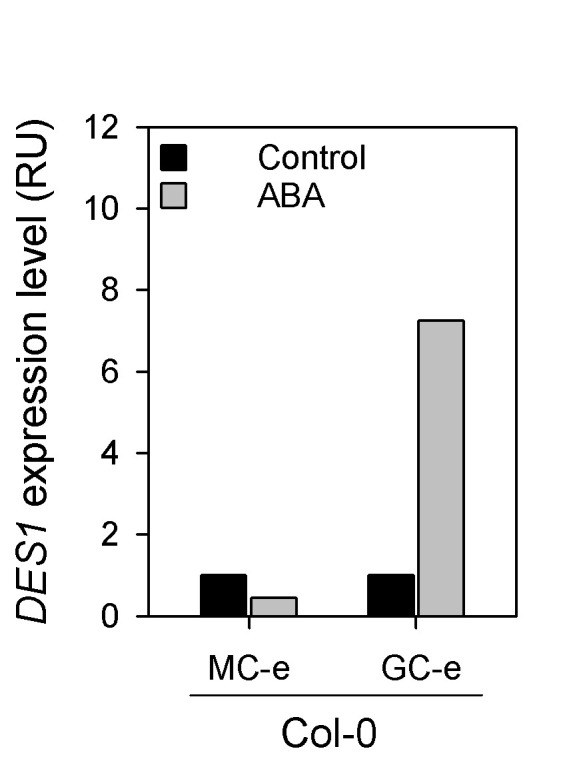
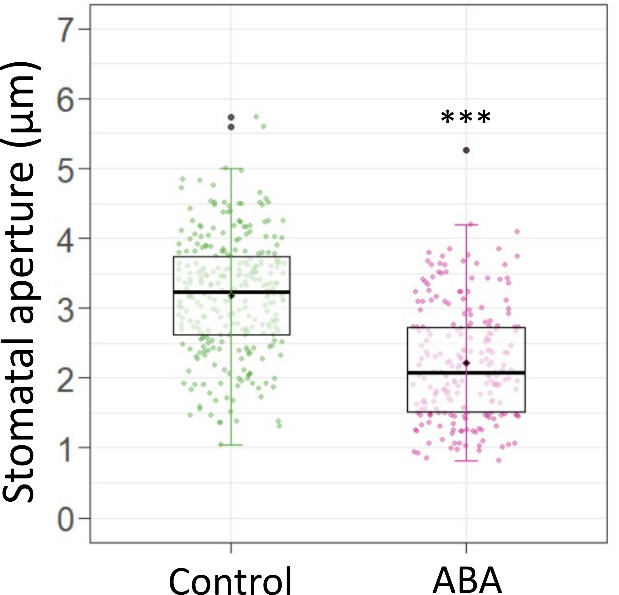
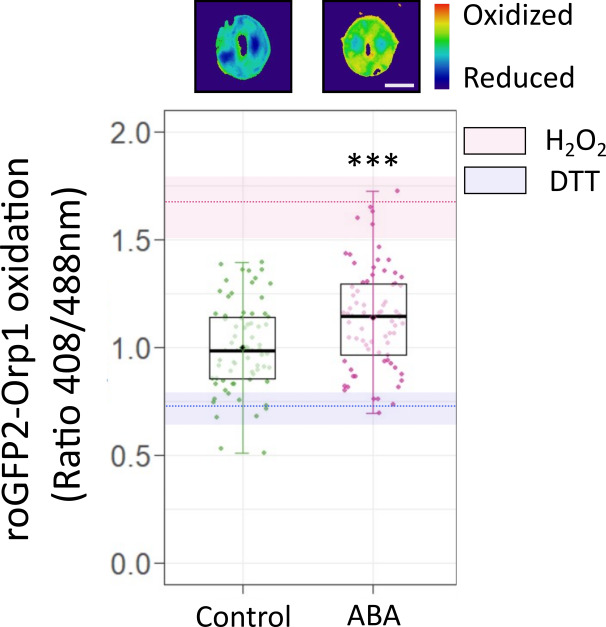
Stomata are pores surrounded by a pair of specialized cells, called guard cells, that play a central role in plant physiology through the regulation of gas exchange between plants and the environment. Guard cells have features like cell-autonomous responses and easily measurable readouts that have turned them into a model system to study signal transduction mechanisms in plants. Here, we provide a detailed protocol to analyze different physiological responses specifically in guard cells. We describe, in detail, the steps and conditions to isolate epidermal peels with tweezers and to analyze i) stomatal aperture in response to different stimuli, ii) cytosolic parameters such as hydrogen peroxide (H2O2), glutathione redox potential (E GSH), and MgATP-2 in vivo dynamics using fluorescent biosensors, and iii) gene expression in guard cell-enriched samples. The importance of this protocol lies in the fact that most living cells on epidermal peels are guard cells, enabling the preparation of guard cell-enriched samples. Key features • Isolation of epidermal peels as a monolayer enriched in guard cells • Measurement of cytosolic guard cell signaling component dynamics in isolated epidermal peels through fluorescent biosensor analysis • Gene expression analysis of guard cell-enriched isolated tissue.

Keywords: Arabidopsis thaliana; Biosensors; Epidermal peels; Guard cells; RNA; Stomatal aperture.


Conflict of interest statement

Competing interestsThe authors declare no competing interests.

Figures

Figure 1.
Figure 1.. Living cells in epidermal peels.
A. Arabidopsis thaliana wild-type ecotype Col-0 epidermal peels were incubated in opening buffer (OB, 5 mM MES pH6.1, 50 mM KCl) under light for 30 min and then loaded with 5 μM of the viability fluorescent dye fluoresce in diacetate (FDA) for 5 min. Peels were washed three times with OB and then mounted on a coverslip, and analyzed by epifluorescence microscopy. Fluorescent cells were quantified, and the total cell/fluorescent cell percentage was calculated for each cell type. PC: pavement cells, GC: guard cells. B. Representative image of an epidermal peel stained with FDA taken with a 40 × objective. Scale bar: 10 μm. C- RT-PCR analysis using guard cell–specific gene ECIREFERUM2 (CER2) (930 bp) and mesophyll cell–specific gene carbonic anhydrase 1 (Canh1) (1,000 bp) was performed in RNA prepared from guard cell–enriched (GC-e) or mesophyll cell–enriched (MC-e) extracts. The amplification of ACTIN (651 bp) transcripts under identical conditions was used as a constitutive expression control. Data from Scuffi et al. [26].
Figure 2.
Figure 2.. Epidermal peeling protocol.
A. Opening buffer (OB) drops. B. Peeling with tweezers. C. Epidermal peel on an OB drop. D. Mesophyll dissection. E. Lifting peels with the needle. F. Incubation in a 24-well plate. G. Brightfield microscopic image of stomata, taken with a 40× objective, showing the stomatal aperture values measured as the maximal distance between the inner walls of guard cells. H. Fluorescence image of stomata expressing roGFP2-Orp1, taken with a 40× objective, where the nucleus, inner cell walls, and a portion of the cytosol from guard cells are indicated by arrows. Scale bars: 10 μm.
Figure 3.
Figure 3.. Analysis of the expression levels of DES1 gene in guard cell–enriched (GC-e) and mesophyll cell–enriched (MC-e) RNA extracts of wild-type plants in response to abscisic acid (ABA).
Epidermal peels (GC-e) and mesophyll tissue (MC-e) prepared from Arabidopsis thaliana wild-type ecotype Col-0 were pre-incubated for 3 h in opening buffer (OB, 5 mM MES, pH 6.1, 50 mM KCl) and then treated with or without 50 μM of ABA under light. After 90 min of treatment, qRT-PCR analysis of DES1 gene expression was performed. The values are expressed as relative units (RU) to the control treatment. Data from Scuffi et al. [26].
Figure 4.
Figure 4.. Stomatal closure response to abscisic acid (ABA).
Epidermal peels were excised from the abaxial side of leaves from 5-week-old Arabidopsis thaliana wild-type ecotype Col-0 plants. Strips were subsequently floated in opening buffer (OB, 5 mM MES, pH 6.1, 50 mM KCl) for 3 h under light. Then, they were treated (ABA) or not (Control) for 90 min with 20 μM of abscisic acid (ABA). Stomatal aperture values are expressed as absolute values in micrometers and are represented as points in the boxplots, where the boxes are bound by the 25th to 75th percentile. The line in the middle is the median, the darker point is the mean, and the whiskers span from 10th to 90th percentile. The asterisk indicates statistical differences between treatments (t-test, p < 0.05).
Figure 5.
Figure 5.. Cytosolic roGFP2-Orp1 oxidation in guard cells.
Epidermal peels were prepared from Arabidopsis thaliana wild-type ecotype Col-0 leaves expressing the cytosolic biosensor roGFP2-Orp1, which detects H2O2. Peels were incubated in opening buffer (OB, 5 mM MES, pH 6.1, 50 mM KCl) for 7 h under light and then treated with 20 mM DTT or 1 mM H2O2 for 10 min, to fully reduce or oxidize the sensor, respectively, or with 20 µM of abscisic acid (ABA) for 10 min. Guard cells’ images were obtained using an epifluorescence microscope. The ratio 405/488 nm was calculated for each guard cell, normalized to the control, and represented as individual points. Box plots are bound by the 25th to 75th percentile. The line in the middle is the median, the darker point is the mean, and the whiskers span from 10th to 90th percentile. Black points represent the outliers. Red and blue dotted lines and bands indicate the mean and the 25th to 75th percentile of maximum and minimum ratio values obtained or full oxidation (1 mM H2O2) and full reduction (20 mM DTT) of the sensor. Data was taken from at least three independent experiments for each treatment. The asterisk indicates statistical differences between treatments (t-test, p < 0.05). Ratiometric images are false-colored and represent the mean of different treatments. Scale bar: 10 μm.

Similar articles

Cited by

References

    1. Lawson T. and Matthews J.(2020). Guard Cell Metabolism and Stomatal Function. Annu Rev Plant Biol. 71(1): 273 302 302. 10.1146/annurev-arplant-050718-100251 - DOI - PubMed
    1. Blatt M.R.(2000). Cellular Signaling and Volume Control in Stomatal Movements in Plants. Annu Rev Plant Biol.16(1): 221 241 241. 10.1146/annurev.cellbio.16.1.221 - DOI - PubMed
    1. Schroeder J. I., Allen G. J., Hugouvieux V., Kwak J. M. and Waner D.(2001). GUARD CELL SIGNAL TRANSDUCTION. Annu Rev Plant Biol. 52(1): 627 658 658. 10.1146/annurev.arplant.52.1.627 - DOI - PubMed
    1. WEYERS J. D. B. and TRAVIS A. J.(1981). Selection and Preparation of Leaf Epidermis for Experiments on Stomatal Physiology. J Exp Bot. 32(4): 837 850 850. 10.1093/jxb/32.4.837 - DOI
    1. Raghavendra A. S.(1981). Energy Supply for Stomatal Opening in Epidermal Strips of Commelina benghalensis. Plant Physiol. 67(2): 385 387 387. 10.1104/pp.67.2.385 - DOI - PMC - PubMed

LinkOut - more resources