. 2024 Jun 24;27(7):110374.
doi: 10.1016/j.isci.2024.110374. eCollection 2024 Jul 19.

Total plasma N-glycomic signature of SARS-CoV-2 infection

Affiliations

Total plasma N-glycomic signature of SARS-CoV-2 infection

Marco R Bladergroen et al. iScience. .

Abstract

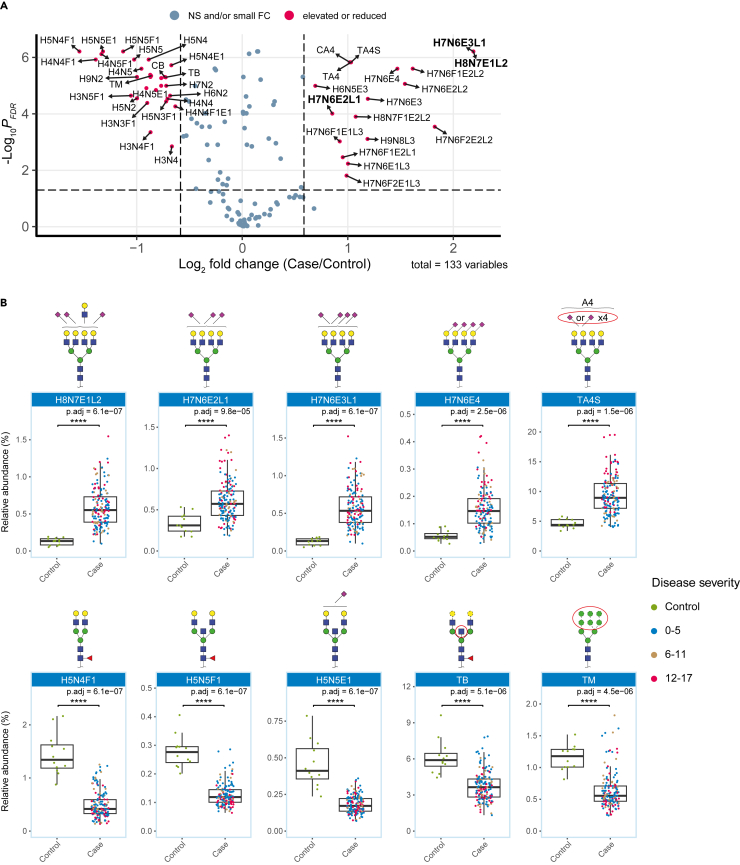
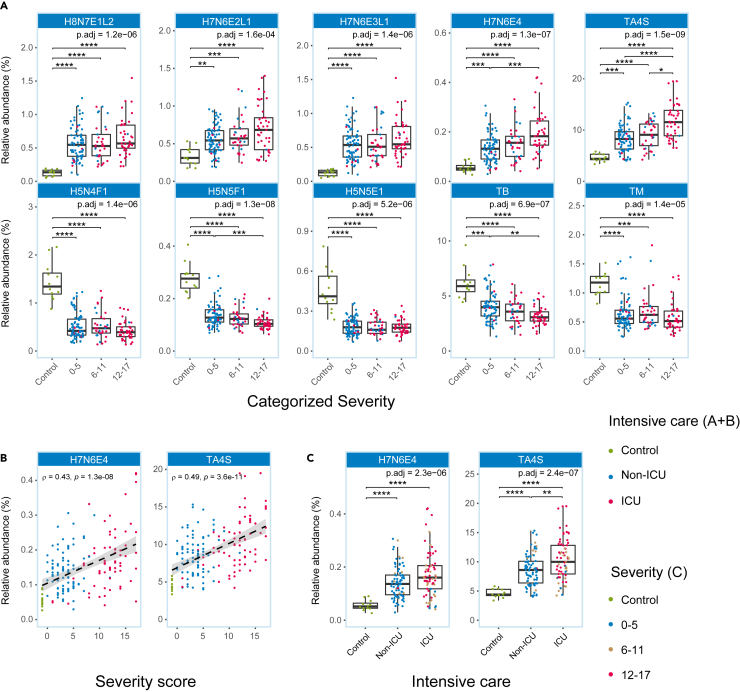
Total plasma protein N-glycosylation (TPNG) changes are a hallmark of many diseases. Here, we analyzed the TPNG of 169 COVID-19 patients and 12 healthy controls, using mass spectrometry, resulting in the relative quantification of 85 N-glycans. We found a COVID-19 N-glycomic signature, with 59 glycans differing between patients and controls, many of them additionally differentiating between severe and mild COVID-19. Tri- and tetra-antennary N-glycans were increased in patients, showing additionally elevated levels of antennary α2,6-sialylation. Conversely, bisection of di-antennary, core-fucosylated, nonsialylated glycans was low in COVID-19, particularly in severe cases, potentially driven by the previously observed low levels of bisection on antibodies of severely diseased COVID-19 patients. These glycomic changes point toward systemic changes in the blood glycoproteome, particularly involvement of acute-phase proteins, immunoglobulins and the complement cascade. Further research is needed to dissect glycosylation changes in a protein- and site-specific way to obtain specific functional leads.

Keywords: Components of the immune system; Disease; Glycomics; Human.


Conflict of interest statement

The authors declare no competing interests.

Figures

None
Graphical abstract
Figure 1
Figure 1
Schematic representation of monosaccharides, glycan types and glycosylation traits Dashed monosaccharides are optional features.
Figure 2
Figure 2
Differentially expressed glycans and glycosylation traits in COVID-19 patients at the time of hospital admission (T0) vs. controls (A) Volcano plot showing the significantly elevated and reduced glycans and glycosylation traits in COVID-19 patients compared to healthy individuals at a fold change cut-off of 1.5 (dashed lines on x axis) and pFDR-value of <0.05. Glycans in bold were selected by the ROC analysis (Figure S2). (B) Altered glycans and glycosylation traits as deducted from panel A and Figure S1, colored according to categorized disease severity. The error bars indicate variability outside the first and third quantiles (white boxes) around the median (bold midline). P-values are based on Wilcoxon rank-sum tests after Benjamini-Hochberg multiple testing correction (p.adj). ∗: p.adj<0.05, ∗∗: p.adj<0.01, ∗∗∗: p.adj<0.001, ∗∗∗∗: p.adj<0.0001. Concurrent glycan structures are putative and may comprise additional isomers. Dashed lines in these structures represent optional building blocks. See also Figures S1 and S2.
Figure 3
Figure 3
Glycan expression coinciding with severity (A) Boxplots showing differential glycan expression with severity at time of hospital admission (T0). The error bars indicate variability outside the first and third quantiles (white boxes) around the median (bold midline). p-values are based on Kruskal-Wallis tests with post-hoc Dunn’s test after Benjamini-Hochberg multiple testing correction (p.adj). ∗: p.adj<0.05, ∗∗: p.adj<0.01, ∗∗∗: p.adj<0.001, ∗∗∗∗: p.adj<0.0001. (B) Correlation plots of the two best performing analytes. Black dashed lines are based on loess regression, gray area represents the 95% confidence interval. Rho- and p-values are based on Spearman correlation. (C) Boxplots of the two analytes in (B) according to ICU admission. The individual samples in the plots are represented by circles, colored according to either intensive care admission (A and B) or categorized severity (C). Intensive care admission is defined as being admitted to the intensive care unit (ICU) at any point in time during COVID-19 infection, not specifically for T0.
Figure 4
Figure 4
Total plasma bisection and galactosylation correlate with IgG bisection and galactosylation Individual samples colored according to categorized severity, indicating lower bisection and lower galactosylation with higher severity. Black dashed lines are based on loess regression, gray area represents the 95% confidence interval. Rho- and p-values are based on Spearman correlation.

References

    1. Williamson E.J., Walker A.J., Bhaskaran K., Bacon S., Bates C., Morton C.E., Curtis H.J., Mehrkar A., Evans D., Inglesby P., et al. Factors associated with COVID-19-related death using OpenSAFELY. Nature. 2020;584:430–436. doi: 10.1038/s41586-020-2521-4. - DOI - PMC - PubMed
    1. Zhou F., Yu T., Du R., Fan G., Liu Y., Liu Z., Xiang J., Wang Y., Song B., Gu X., et al. Clinical course and risk factors for mortality of adult inpatients with COVID-19 in Wuhan, China: a retrospective cohort study. Lancet. 2020;395:1054–1062. doi: 10.1016/S0140-6736(20)30566-3. - DOI - PMC - PubMed
    1. Gallo Marin B., Aghagoli G., Lavine K., Yang L., Siff E.J., Chiang S.S., Salazar-Mather T.P., Dumenco L., Savaria M.C., Aung S.N., et al. Predictors of COVID-19 severity: A literature review. Rev. Med. Virol. 2021;31:1–10. doi: 10.1002/rmv.2146. - DOI - PMC - PubMed
    1. Lamers M.M., Haagmans B.L. SARS-CoV-2 pathogenesis. Nat. Rev. Microbiol. 2022;20:270–284. doi: 10.1038/s41579-022-00713-0. - DOI - PubMed
    1. Dong E., Du H., Gardner L. An interactive web-based dashboard to track COVID-19 in real time. Lancet Infect. Dis. 2020;20:533–534. doi: 10.1016/S1473-3099(20)30120-1. - DOI - PMC - PubMed

LinkOut - more resources