. 2024 Nov 12;218(3):221-241.
doi: 10.1093/cei/uxae071.

The immune landscape of the inflamed joint defined by spectral flow cytometry

Collaborators, Affiliations

The immune landscape of the inflamed joint defined by spectral flow cytometry

Meryl H Attrill et al. Clin Exp Immunol. .

Abstract

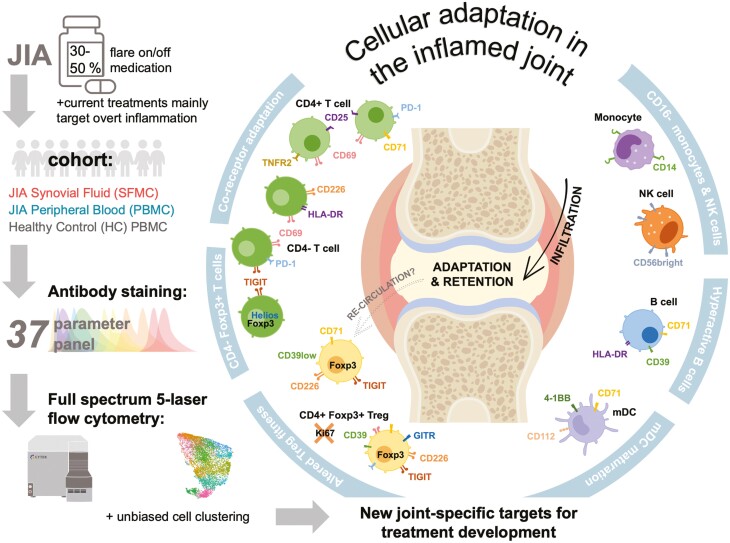
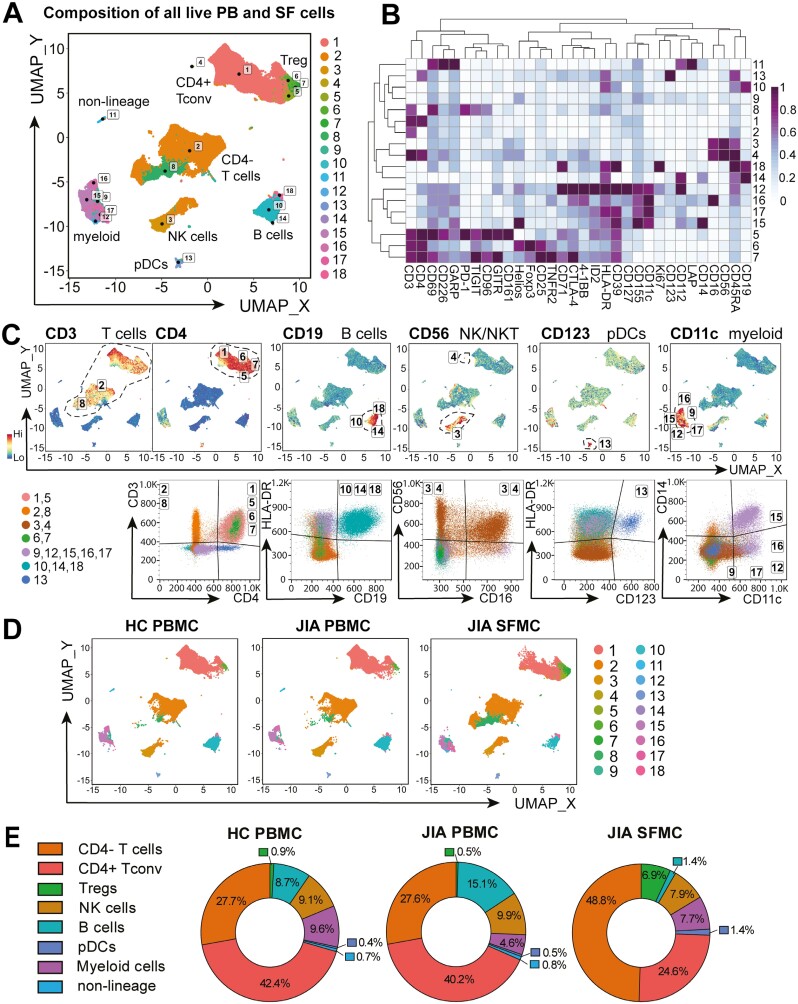
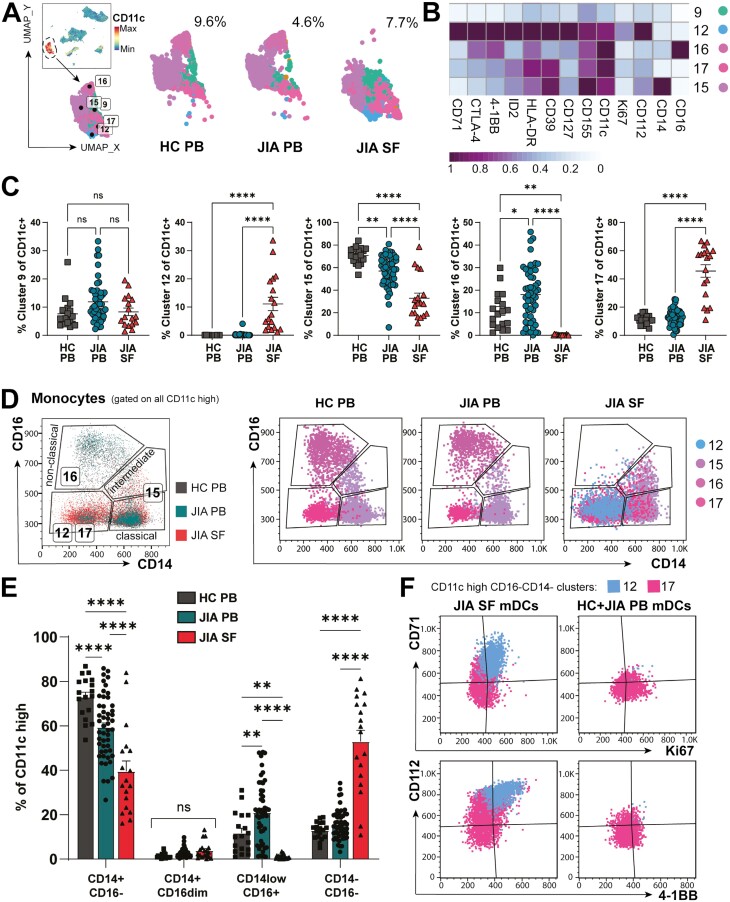
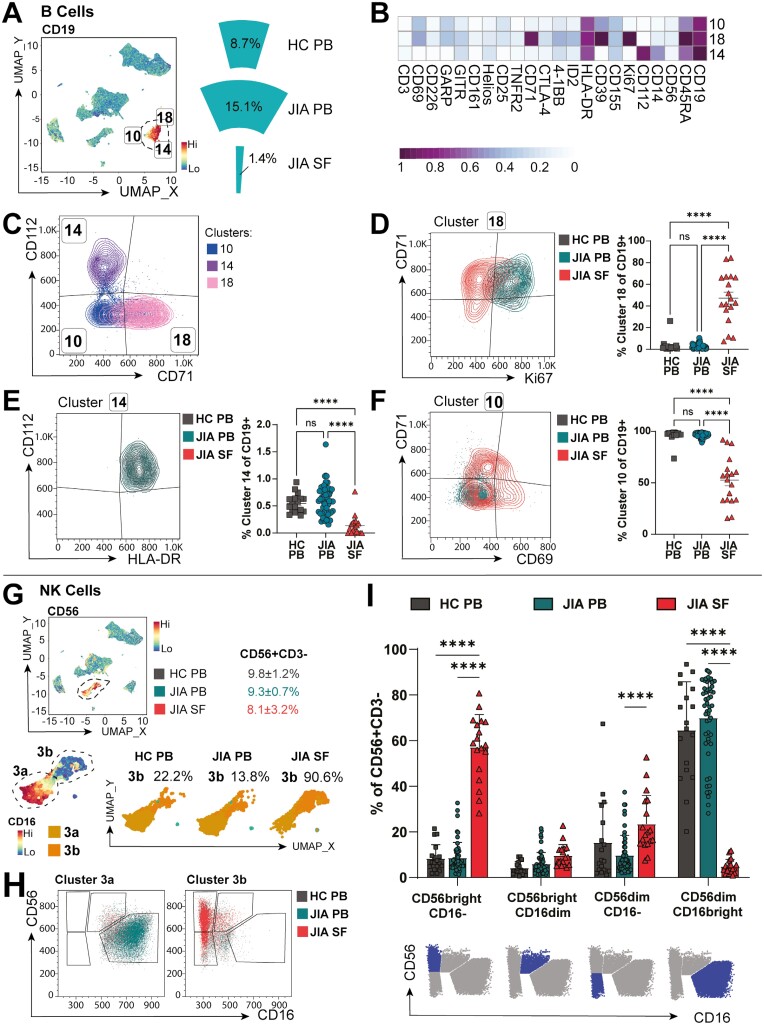
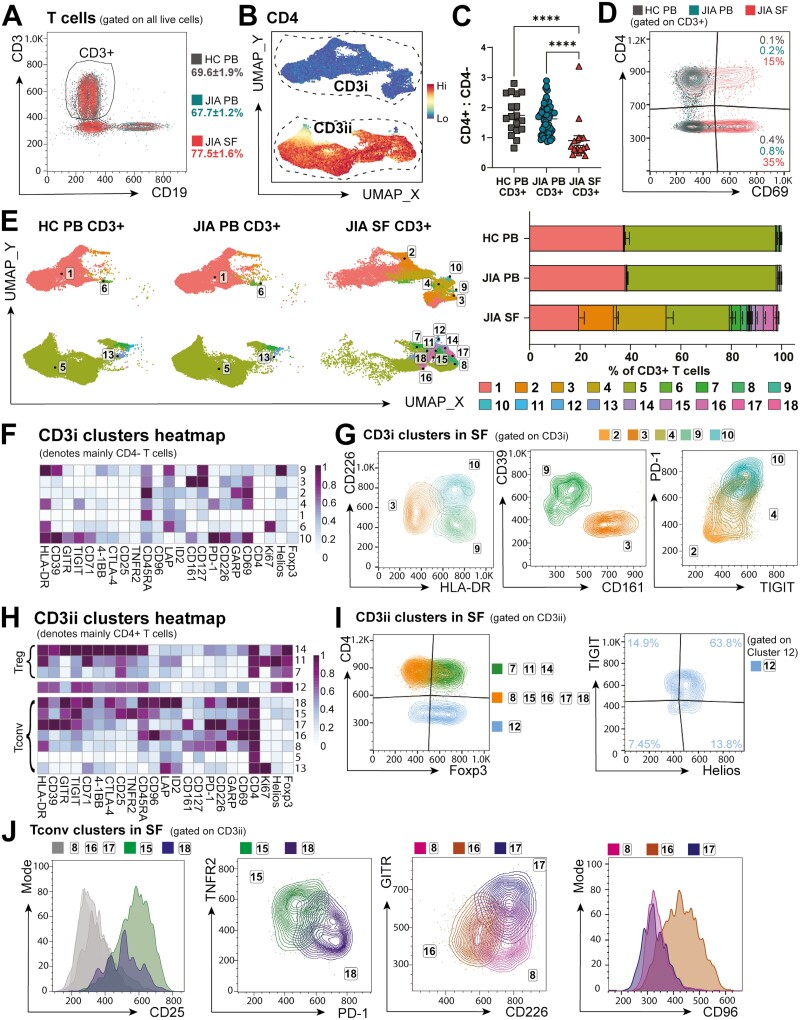
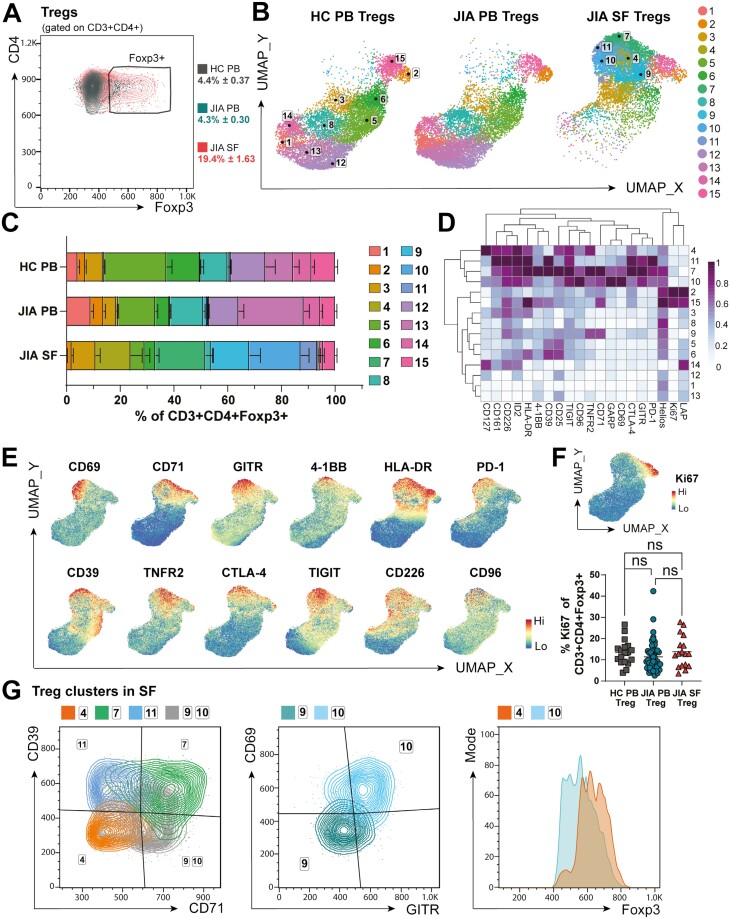
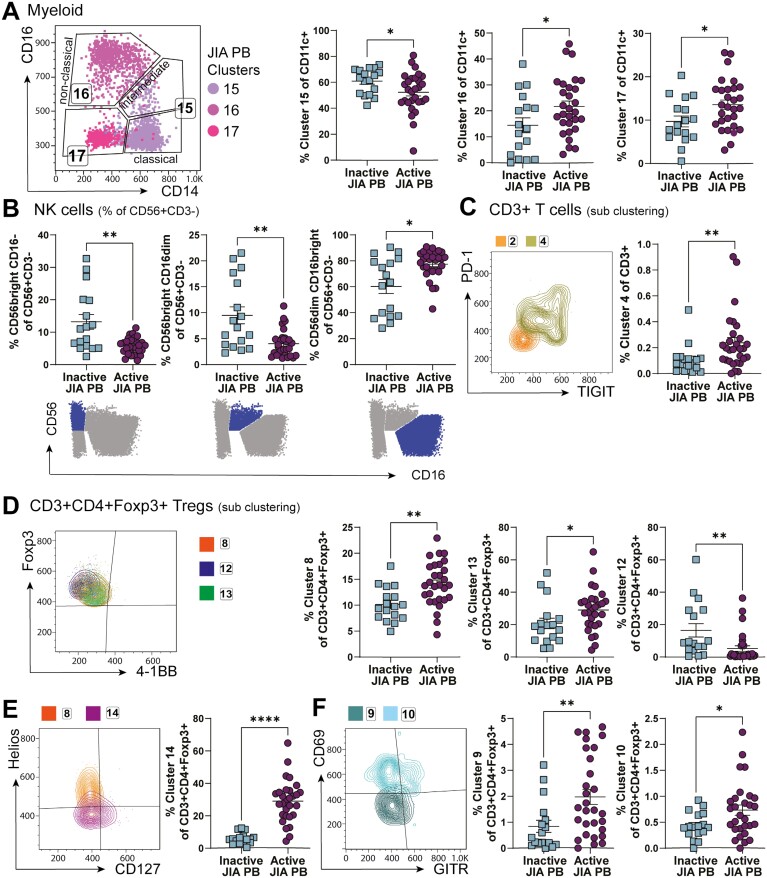
Cellular phenotype and function are altered in different microenvironments. For targeted therapies it is important to understand site-specific cellular adaptations. Juvenile idiopathic arthritis (JIA) is characterized by autoimmune joint inflammation, with frequent inadequate treatment responses. To comprehensively assess the inflammatory immune landscape, we designed a 37-parameter spectral flow cytometry panel delineating mononuclear cells from JIA synovial fluid (SF) of autoimmune inflamed joints, compared to JIA and healthy control blood. Synovial monocytes and NK cells (CD56bright) lack Fc-receptor CD16, suggesting antibody-mediated targeting may be ineffective. B cells and DCs, both in small frequencies in SF, undergo maturation with high 4-1BB, CD71, CD39 expression, supporting T-cell activation. SF effector and regulatory T cells were highly active with newly described co-receptor combinations that may alter function, and suggestion of metabolic reprogramming via CD71, TNFR2, and PD-1. Most SF effector phenotypes, as well as an identified CD4-Foxp3+ T-cell population, were restricted to the inflamed joint, yet specific SF-predominant CD4+ Foxp3+ Treg subpopulations were increased in blood of active but not inactive JIA, suggesting possible recirculation and loss of immunoregulation at distal sites. This first comprehensive dataset of the site-specific inflammatory landscape at protein level will inform functional studies and the development of targeted therapeutics to restore immunoregulatory balance and achieve remission in JIA.

Keywords: autoimmunity; cellular adaptations; inflamed joint; juvenile idiopathic arthritis; spectral flow cytometry.


Conflict of interest statement

M.H.A., D.S., and A.M.P. have no conflict of interest to declare. L.R.W., M.K. and V.A. received funding/funding in kind to CLUSTER-JIA Consortium from Pfizer, UCB, AbbVie, SOBI and GSK, but that support did not directly fund this work. L.R.W. has received speaker fees, paid to UCL, from Pfizer, unrelated to this work.

Figures

Graphical Abstract
Graphical Abstract
Figure 1:
Figure 1:
altered cell composition in the inflamed joint of JIA. Synovial fluid mononuclear cells (SFMC, n = 18) and PBMC of JIA patients (n = 52) and healthy controls (HC, n = 18) were stained and acquired on a full-spectrum cytometer. Unbiased clustering algorithm FlowSOM, after gating on all single, live (FVD−) cells, identified 18 clusters of major cellular compositions with UMAP of all samples in (A). (B) Heatmap of the 32 markers used for clustering, MFI Z-score across columns. (C) Expression UMAP of lineage markers CD3, CD4, CD19, CD56, CD123, and CD11c and validation of the cluster identity. (D) 18 clusters UMAP for HC PBMC, JIA PBMC, and JIA SFMC. (E) Major immune cell population (as defined in C) frequencies of normalized UMAP of all samples per sample group in HC PBMC, JIA PBMC, and JIA PBMC
Figure 2:
Figure 2:
the inflamed joint may promote adaptation and survival of distinct myeloid cells. (A) FlowSOM on all live cells identified five CD11c+ myeloid clusters (9, 12, 15, 16, 17) with % CD11c+ clusters of all live cells for HC PB, JIA PB, and JIA SF shown. (B) Heatmap of myeloid clusters differentially expressed markers, Z-score across columns. (C) Frequencies of clusters 9, 12, 15, 16, 17 between HC PB, JIA PB, and JIA SF as % of all CD11c + myeloid clusters. (D) Left: Representative flow plot (pre-gated on CD11c-high) showing classical, intermediate, and non-classical monocyte by CD14 vs CD16 gating for clusters 12, 15, 16, and 17. Right: Flow plots of clusters (12, 15, 16, 17) with monocyte gating for HC PB, JIA PB, and JIA SF and respective frequencies in (E). (F) Flow plots of phenotypic difference by CD71, Ki67, CD112, and 4-1BB in myeloid dendritic cells (mDCs; CD11c + CD14−CD16−) clusters 12 and 17 between JIA SF and JIA + HC PB. Throughout: JIA SF (n = 18), JIA PB (n = 52), HC PB (n = 18). Data with mean ± SEM, parametric one-/two-way ANOVA with Tukey’s multiple comparison testing, **P < 0.01, **** P < 0.0001, ns = non-significant
Figure 3:
Figure 3:
JIA SF has distinct B and NK-cell populations from PB. (A) Expression UMAP of CD19 identifying three B cells clusters (10, 14, 18) with total frequencies for HC PB, JIA PB, and JIA SF (as % of total live cells) (B) Heatmap of B-cell clusters differentially expressed markers, Z-score across columns. (C) Overlay flow plot separating B-cell clusters 10, 14, and 18 by CD112 and CD71. (D–F) Left: Flow plots with right: frequencies (of % of CD19 + B cells) for clusters 18 with CD71, Ki67 (D), cluster 14 with CD112, HLA-DR (E) and cluster 10 with CD71, CD69 (F) across HC PB, JIA PB, and JIA SF. (G) Top: CD56 expression UMAP identifying NK cells with frequencies of CD56+ CD3− cells for HC PB, JIA PB, and JIA SF. Bottom: Subclassification of NK cluster (3a and 3b) based on CD16 expression with cluster 3b frequencies in HC PB, JIA PB, and JIA SF. (H) Gating strategy for NK cell subsets (cluster 3a, 3b) based on CD56 and CD16 expression with (I) frequencies of NK cell subtypes (as % of CD56+ CD3−) in HC PB, JIA PB, and JIA SF (representative gating below in blue). Throughout: JIA SF (n = 18), JIA PB (n = 52), HC PB (n = 18). Data with mean ± SEM, one/two-way ANOVA with Tukey’s multiple comparison testing, **** P < 0.0001
Figure 4:
Figure 4:
T-cell subsets are highly activated and adapt co-receptor expression in the inflammatory SF microenvironment. CD3+ CD19− cells were sub-clustered with FlowSOM. (A) Gating and frequencies of CD3+ T cells (as % of live cells) in HC PB, JIA PB, and JIA SF. (B) CD3 clusters subclassed into CD3i and CD3ii by CD4 expression UMAP. (C) Ratio of CD4+ to CD4− T cells (as % of CD3+) in HC PB, JIA PB, and JIA SF. (D) Flow plot of CD69 expression across HC PB, JIA PB, and JIA SF CD3+ T cells. (E) Left: UMAP, right: frequencies (as % of CD3+ T cells) of 18 T-cell clusters in HC PB, JIA PB, and JIA SF. (F) T-cell markers heatmap of CD3i clusters (denoting mainly CD4− T cells), Z-score across columns. (G) Overlay flow plots differentiating CD3i clusters (2, 3, 4, 9, 10) in SF by CD226, HLA-DR, CD39, CD161, PD-1, and TIGIT. (H) T-cell markers heatmap of CD3ii clusters (denoting mainly CD4+ T cells) split into Foxp3+ Treg clusters and FoxP3- Tconv clusters, Z-score across columns. (I–J) Overlay flow plots differentiating CD3ii clusters (7, 8, 11, 12, 14–18) in SF with (I) Foxp3 vs CD4 and cluster 12 phenotype by TIGIT and Helios, and (J) flow plots differentiating CD3ii CD4 + Tconv clusters in SF with CD25, TNFR2, PD-1, GITR, CD226, and CD96. Throughout: JIA SF (n = 18), JIA PB (n = 52), HC PB (n = 18). Data with mean ± SEM, one-way ANOVA with Tukey’s multiple comparison testing, ****P < 0.0001
Figure 5:
Figure 5:
Regulatory T-cell fitness may be altered in the inflamed JIA joint. CD3+ CD4+ Foxp3+ Tregs were sub-clustered using PhenoGraph. (A) Gating strategy with Foxp3+ frequency (as % of CD3+ CD4+) in HC PB, JIA PB, and JIA SF. (B) UMAP with (C) respective frequencies (as % of CD3+ CD4+ Foxp3+) of 15 Treg clusters in HC PB, JIA PB, and JIA SF. (D) Heatmap of 20 relevant Treg markers used for clustering, Z-score across columns. (E) UMAP of combined HC PB, JIA PB, and SF PB Tregs with heatmap overlay of expression levels (by MFI) of CD69, CD71, GITR, 4-1BB, HLA-DR, PD-1, CD39, TNFR2, CTLA-4, TIGIT, CD226, CD96 and (F) Ki67 with summary plot for Ki67 frequency (as % of CD3+ CD4+ Foxp3+) in HC PB, JIA PB, and JIA SF. (G) Overlay flow plots differentiating Treg clusters 1, 7, 9–11 in SF using CD39, CD71, CD69, GITR, and Foxp3. Throughout: JIA SF (n = 18), JIA PB (n = 52), HC PB (n = 18). Data with mean ± SEM, one-way ANOVA with Tukey’s multiple comparison testing, ns = not significant
Figure 6:
Figure 6:
Unlikely recirculation of SF dominant clusters by assessing PB of active and inactive JIA. Clusters identified by studying JIA SF samples were assessed in clinically active (active joint count, AJC ≥ 1) and clinically inactive (AJC = 0) JIA PB samples, expecting to identify recirculating cells in active but not inactive JIA PB. (A) Gating by CD14 and CD16 with frequency (as % of CD11c+) of myeloid clusters 15–17 in inactive vs active JIA PB. (B) Frequencies (as % of CD56+ CD3−) of NK-cell subsets by traditional gating (CD56 vs CD16, symbolized below) in inactive vs active JIA PB. (C) Overlay flow plot displaying PD-1 and TIGIT expression of clusters 2, 4 from CD3+ T-cell sub-clustering with cluster 4 frequency (as % of CD3+) in inactive vs active JIA. (D–F) Phenotype and frequencies (as % of CD3+ CD4+ Foxp3+ for sub-clustering of CD3+ CD4+ Foxp3+ Tregs) of Treg-specific clusters 8, 13, 12 with Foxp3, 4–1BB (D), 14 with Helios, CD127 (E), and 9, 10 with CD69, GITR (F) in inactive vs active JIA PB. Throughout: JIA PB of clinically inactive (AJC = 0, n = 17) and active (AJC ≥ 1, n = 29). Data with mean ± SEM, Mann–Whitney test, *P < 0.05, **P < 0.01, **** P < 0.0001

Similar articles

Cited by

References

    1. Pitt JM, Marabelle A, Eggermont A, Soria JC, Kroemer G, Zitvogel L.. Targeting the tumor microenvironment: removing obstruction to anticancer immune responses and immunotherapy. Ann Oncol 2016, 27, 1482–92. doi:10.1093/annonc/mdw168 - DOI - PubMed
    1. Heintzman DR, Fisher EL, Rathmell JC.. Microenvironmental influences on T cell immunity in cancer and inflammation. Cell Mol Immunol 2022, 19, 316–26. doi:10.1038/s41423-021-00833-2 - DOI - PMC - PubMed
    1. Martini A, Lovell DJ, Albani S, Brunner HI, Hyrich KL, Thompson SD, et al.Juvenile idiopathic arthritis. Nat Rev Dis Primers 2022, 8, 5. doi:10.1038/s41572-021-00332-8 - DOI - PubMed
    1. Macaubas C, Nguyen K, Milojevic D, Park JL, Mellins ED.. Oligoarticular and polyarticular JIA: epidemiology and pathogenesis. Nat Rev Rheumatol 2009, 5, 616–26. doi:10.1038/nrrheum.2009.209 - DOI - PMC - PubMed
    1. Hoeppli RE, Pesenacker AM.. Targeting tregs in juvenile idiopathic arthritis and juvenile dermatomyositis—insights from other diseases. Front Immunol 2019, 10, 46. doi:10.3389/fimmu.2019.00046 - DOI - PMC - PubMed