. 2025 Dec 1;20(12):3606-3619.
doi: 10.4103/NRR.NRR-D-24-00063. Epub 2024 Jul 29.

Dynamic development of microglia and macrophages after spinal cord injury

Affiliations

Dynamic development of microglia and macrophages after spinal cord injury

Hu-Yao Zhou et al. Neural Regen Res. .

Abstract

JOURNAL/nrgr/04.03/01300535-202512000-00029/figure1/v/2025-01-31T122243Z/r/image-tiff Secondary injury following spinal cord injury is primarily characterized by a complex inflammatory response, with resident microglia and infiltrating macrophages playing pivotal roles. While previous studies have grouped these two cell types together based on similarities in structure and function, an increasing number of studies have demonstrated that microglia and macrophages exhibit differences in structure and function and have different effects on disease processes. In this study, we used single-cell RNA sequencing and spatial transcriptomics to identify the distinct evolutionary paths of microglia and macrophages following spinal cord injury. Our results showed that microglia were activated to a pro-inflammatory phenotype immediately after spinal cord injury, gradually transforming to an anti-inflammatory steady state phenotype as the disease progressed. Regarding macrophages, our findings highlighted abundant communication with other cells, including fibroblasts and neurons. Both pro-inflammatory and neuroprotective effects of macrophages were also identified; the pro-inflammatory effect may be related to integrin β2 ( Itgb2 ) and the neuroprotective effect may be related to the oncostatin M pathway. These findings were validated by in vivo experiments. This research underscores differences in the cellular dynamics of microglia and macrophages following spinal cord injury, and may offer new perspectives on inflammatory mechanisms and potential therapeutic targets.


Conflict of interest statement

Conflicts of interest: The authors declare no competing interests.

Figures

Figure 1
Figure 1
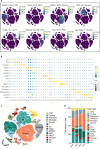
Clustering of different cell lineages in SCI model mice. (A) t-Distributed stochastic neighbor embedding (t-SNE) color-coded by annotated cell lineage. (B) Representative expression levels of the marker genes in each cell type. (C) t-SNE plot of the annotated cell types in SCI model mice. Different colors represent different cell types. (D) Compositions of the annotated cell types in the sham, 1 dpi, 3 dpi, and 7 dpi groups. DCs: Dendritic cells; dpi: Day(s) post-injury; FB: fibroblasts; MAC: macrophages; MONO: monocytes; NEUT: neutrophils; Oligo: oligodendrocytes, SCI: spinal cord injury; T: T cells; t-SNE: t-distributed stochastic neighbor embedding.
Figure 2
Figure 2
Characterization of the developmental trajectory of microglia in SCI model mice. (A) UMAP color-coded by annotated microglial subgroups 0–4. (B) Bubble plot of representative markers of each cell subgroup. (C) Proportions of subgroups 0–4 in the sham, 1 dpi, 3 dpi, and 7 dpi groups. (D) Radar plot of the GSEA results in the color-coded sham, 1 dpi, 3 dpi, and 7 dpi groups. (E) Trajectory inference analysis of microglia color-coded by cell subgroup and trajectory color-coded by pseudotime. (F) Trajectories of the sham, 1 dpi, 3 dpi, and 7 dpi groups color-coded by cell state (States 0–2). The proportions of each cell state in each group were calculated and depicted as pie charts. (G) GO and gene dynamics analysis of Clusters 1–3 showing differentially expressed genes together with the pseudotime curve. The green-to-purple color gradient indicates relative expression levels from low to high. (H) Heat map showing the relative levels of transcription factor activity in each cell state obtained via the DoRothEA gene regulatory network. dpi: Day(s) post-injury; GO: Gene Ontology; GSEA: Gene Set Enrichment Analysis; SCI: spinal cord injury; UMAP: Uniform Manifold Approximation and Projection.
Figure 3
Figure 3
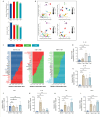
Alteration of cell–cell communications and signaling pathways after spinal cord injury. (A) Bar charts summarizing the levels of cell–cell communication and interaction strength at each time point post-SCI. (B) Illustration of the interaction strength of the incoming and outgoing interactions in each cell types at the different post-SCI time points. (C) Bar plots ranking the signaling pathway axes based on differences in overall information flow in the interaction networks among the color-coded sham, 1 dpi, 3 dpi, and 7 dpi groups. (D–I) qRT-PCR validation of relevant gene expression in the sham, 1 dpi, 3 dpi, and 7 dpi groups: IL-1a (D), IL-1b (E), Mif (F), IL-6 (G), Tnf (H), and Osm (I). Data expressed as means ± standard deviation (n = 5 for each group) and analyzed by one-way analysis of variance with Tukey’s multiple comparisons test; *P < 0.05, **P < 0.01, ***P < 0.001, ****P < 0.0001. IL: Interleukin; Mif: macrophage migration inhibitory factor; ns: not significant; Osm: Oncostatin M; qRT–PCR: quantitative reverse transcription–polymerase chain reaction; SCI: spinal cord injury; Tnf: tumor necrosis factor.
Figure 4
Figure 4
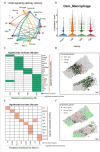
Cell–cell communication between macrophages and other cells in SCI model mice. (A) Cell–cell interaction network constructed on the basis of the Osm signaling pathway. (B) Expression levels of Osm in macrophages from the sham, 1 dpi, 3 dpi, and 7 dpi groups. (C, D) Significantly enriched ligand–receptor interaction (LRI) pairs known to mediate cell–cell communications between macrophages (MAC) and fibroblasts (FB). Top 20 LRI pairs for macrophage–fibroblast communications (C) and SpaTalk plot of the spatial distribution of OSM–EGFR pairs (D). (E, F) Significantly enriched LRI pairs known to mediate macrophage–neuron communications. Top 12 LRI pairs (E) and SpaTalk plot of the spatial distribution of Agtrap–Rack1 pairs between the macrophage transmitters and the neuron receivers (F). Agtrap: Angiotensin II receptor-associated protein; DCs: dendritic cells; EGFR: epidermal growth factor receptor; LRI: ligand–receptor interactions; MONO: monocytes; NEUT: neutrophils; Oligo: oligodendrocytes, OSM: oncostatin M; Rack1: receptor for activated C kinase 1; T: T cells.
Figure 5
Figure 5
Simulation of the developmental trajectory of macrophages and analysis of gene expression patterns in SCI model mice. (A) UMAP color-coded by annotated macrophage subgroup. (B) Bubble plot of representative markers of each macrophage subgroup. (C) Proportions of each macrophage cluster at 1, 3, and 7 dpi. (D) Radar plot of the GSEA results in the color-coded 1 dpi, 3 dpi, and 7 dpi groups. (E) Expression of representative proinflammatory and nutritional-repair genes in macrophages in the 1 dpi, 3 dpi, and 7 dpi groups. (F) Trajectory inference analysis of color-coded annotated macrophage subgroups. (G) Trajectory inference analysis of each cell subgroup at 1, 3, and 7 dpi. (H) GO and gene dynamics analysis of Clusters 1–3 showing differentially expressed genes together with the pseudotime curve. The green-to-purple color gradient indicates relative expression levels from low to high. (I) Top 20 hub gene networks in each cluster displayed by gene network. dpi: Day(s) post-injury; GO: Gene Ontology; GSEA: Gene Set Enrichment Analysis; SCI: spinal cord injury; UMAP: Uniform Manifold Approximation and Projection.
Figure 6
Figure 6
Expression of Itgb2 in different cell types in SCI model mice. (A) t-SNE plot of the annotated gene Itgb2 in SCI model mice. (B) Expression levels of Itgb2 in different cell lineages in the sham, 1 dpi, 3 dpi, and 7 dpi groups. (C) SpaTalk cell-type decomposition at single-cell resolution for the spot-based spatial transcriptomics data at 7 dpi. (D) Visium spot-based spatial transcriptomics dataset of the SCI mouse model and the SpaTalk cell-type decomposition showing the percentage of Itgb2 expression level. (E, F) Spatial distribution of microglia (E) and macrophages (F). DCs: Dendritic cells; dpi: Day(s) post injury; Itgb2: integrin β2; MAC: macrophages; MONO: monocytes; NEUT: neutrophils; Oligo: oligodendrocytes; T: T cells; SCI: spinal cord injury; ST: spatial transcriptomics; t-SNE: t-distributed stochastic neighbor embedding.
Figure 7
Figure 7
Validation of Itgb2 expression in spinal cord tissue in vivo. (A) Schematic diagram of experiments used to validate Itgb2 expression in the C57BL/6J SCI mouse model in vivo. (B, C) Western blotting (B) and quantification (C) of ITGB2 protein expression in the sham, 1 dpi, 3 dpi, and 7 dpi groups (n = 4 for each group). (D) qRT-PCR validation of Itgb2 expression in the sham (n = 4), 1 dpi (n = 4), 3 dpi (n = 4), and 7 dpi (n = 3) groups. (E) Counting of total number of ITGB2+ cells merged with DAPI-positive cells in F. (F) Representative immunofluorescence (IF) staining of ITGB2 (yellow, Alexa Fluor ®-555), in the sham, 1 dpi, 3 dpi, and 7 dpi groups, showing a rapid increase in the number of ITGB2-positive cells post-SCI that gradually decreased over time. Nuclei were stained with DAPI (blue). The core injury zone is outlined in each image. Scale bar: 500 μm. Areas outlined in red boxes were magnified. *P < 0.05, ***P < 0.001, ****P < 0.0001. Data expressed as mean ± standard deviation (n = 5 for each group) and analyzed by one-way analysis of variance using Tukey’s multiple comparisons test. DAPI: 4′,6-Diamidino-2-phenylindole; dpi: day(s) post injury; Itgb2: integrin β2; ns: not significant; qRT–PCR: quantitative reverse transcription–polymerase chain reaction; SCI: spinal cord injury.

References

    1. Airapetov MI, Eresko SO, Ignatova PD, Lebedev AA, Bychkov ER, Shabanov PD. Interleukin-11 in pathologies of the nervous system. Mol Biol. 2023;57:1–6. - PMC - PubMed
    1. Álvarez Z, Kolberg-Edelbrock AN, Sasselli IR, Ortega JA, Qiu R, Syrgiannis Z, Mirau PA, Chen F, Chin SM, Weigand S, Kiskinis E, Stupp SI. Bioactive scaffolds with enhanced supramolecular motion promote recovery from spinal cord injury. Science. 2021;374:848–856. - PMC - PubMed
    1. Anderson MA, O’Shea TM, Burda JE, Ao Y, Barlatey SL, Bernstein AM, Kim JH, James ND, Rogers A, Kato B, Wollenberg AL, Kawaguchi R, Coppola G, Wang C, Deming TJ, He Z, Courtine G, Sofroniew MV. Required growth facilitators propel axon regeneration across complete spinal cord injury. Nature. 2018;561:396–400. - PMC - PubMed
    1. Arifin WN, Zahiruddin WM. Sample size calculation in animal studies using resource equation approach. Malays J Med Sci. 2017;24:101–105. - PMC - PubMed
    1. Badhiwala JH, Wilson JR, Fehlings MG. Global burden of traumatic brain and spinal cord injury. Lancet Neurol. 2019;18:24–25. - PubMed

LinkOut - more resources