. 2024 Aug 5;8(8):e0505.
doi: 10.1097/HC9.0000000000000505. eCollection 2024 Aug 1.

Transcriptomic profiling of intermediate cell carcinoma of the liver

Affiliations

Transcriptomic profiling of intermediate cell carcinoma of the liver

Byungchan Jang et al. Hepatol Commun. .

Abstract

Background: Intermediate cell carcinoma (Int-CA) is a rare and enigmatic primary liver cancer characterized by uniform tumor cells exhibiting mixed features of both HCC and intrahepatic cholangiocarcinoma. Despite the unique pathological features of int-CA, its molecular characteristics remain unclear yet.

Methods: RNA sequencing and whole genome sequencing profiling were performed on int-CA tumors and compared with those of HCC and intrahepatic cholangiocarcinoma.

Results: Int-CAs unveiled a distinct and intermediate transcriptomic feature that is strikingly different from both HCC and intrahepatic cholangiocarcinoma. The marked abundance of splicing events leading to intron retention emerged as a signature feature of int-CA, along with a prominent expression of Notch signaling. Further exploration revealed that METTL16 was suppressed within int-CA, showing a DNA copy number-dependent transcriptional deregulation. Notably, experimental investigations confirmed that METTL16 suppression facilitated invasive tumor characteristics through the activation of the Notch signaling cascade.

Conclusions: Our results provide a molecular landscape of int-CA featured by METTL16 suppression and frequent intron retention events, which may play pivotal roles in the acquisition of the aggressive phenotype of Int-CA.


Conflict of interest statement

The authors have no conflicts to report.

Figures
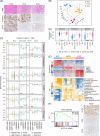
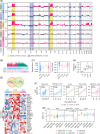
FIGURE 1
FIGURE 1
Comparison of the transcriptome profiles across HCC, iCCA, and int-CA. (A) Histopathological and immunohistochemical stain features of int-CA are shown. The tumor cells show coexpression of hepatocytic (hepPar1) and cholangiocytic (cytokeratin 19) markers. (B) Principal component analysis using the variable genes (median absolute deviation >0.5, n = 9847) shows the distinct distribution of int-CA compared to HCC and iCCA. (C) Box plots show the differential expression of the genes related to cellular origin across the tissue types such as hepatocyte, cholangiocyte, ESCs, and the stem cell–like features of liver cancer cells such as CLHCC, HCC.stem, and iCCA.stem. (D) Box plots show the enrichment scores of the genes for cell cycle, proliferation, and migration across the tissue types. (E) Heatmaps show the DEGs for each tissue type of HCC (n = 251), int-CA (n = 132), and iCCA (n = 302) (top), and the enrichment scores calculated by ssGSEA of the hallmark gene sets (n = 50, MSigDB, https://www.gsea-msigdb.org) across the tissue types (bottom). (F) The enrichment score of “Notch signaling” in int-CA compared to other tumor types is shown (left). Immunohistochemical stain for NOTCH1 shows a positive expression in int-CA (right). Abbreviations: CLHCC, cholangiocarcinoma-like hepatocellular carcinoma; DEG, differentially expressed gene; ESC, embryonic stem cell; iCCA, intrahepatic cholangiocarcinoma; int-CA, intermediate cell carcinoma; ssGSEA, single sample gene set enrichment analysis.
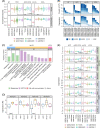
FIGURE 2
FIGURE 2
DNA copy number–dependent transcriptional deregulation of METTL16. (A) The CNA values across the tumor types are shown in various data sets of TCGA-HCC, GSE76311-HCC, int-CA, TCGA-iCCA, and GSE76311-iCCA (top). The chromosomal regions with differentially altered CNAs with gain or loss are indicated (bottom, colored boxes). (B) Unsupervised cluster analysis of the CNA profiles shows the similarity of the CNAs across the tumor types. (C) Stromal score (left) and tumor purity (right) are shown across the tumor types. (D) Mutational load (mutations/Mb) across the tissue types is shown. (E) A Venn diagram shows the CNA-dependent genes identified from the overlapped genes among the correlated CNAs and the DEGs for int-CA (top). A heatmap shows the expression of CNA-dependent genes in int-CA (n = 30, bottom). (F) Correlations between the expression levels and the CNA levels of METTL16 are shown across the tumor types in the data sets of int-CA, TCGA-HCC, GSE76311-HCC, TCGA-iCCA, and GSE76311-iCCA, respectively. (G) A boxplot shows METTL16 expression across the tumor types in the various data sets (p < 0.05). Abbreviations: CNA, copy number aberration; DEG, differentially expressed gene; iCCA, intrahepatic cholangiocarcinoma; int-CA, intermediate cell carcinoma; TCGA, The Cancer Genome Atlas.
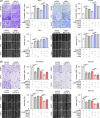
FIGURE 3
FIGURE 3
int-CA had frequent intron retention. (A) Box plots show the RNA methyltransferase activity and spliceosome activity across the tumor types. (B) Bar plots show the counts of the alternative splicing events and the expression levels of the spliced transcripts across the tumor types. (C) Bar plots show the enrichment scores for the expression of the pathway genes for each splicing type across the tumor types. (D) Box plots show the expression levels of IR transcripts in Notch receptors across the tumor types. (E) Box plots show the expression levels of Notch receptors (ie, NOTCH1, NOTCH2, NOTCH3, and NOTCH4) and ligands (ie, JAG1, JAG2, DLL1, and DLL4) across tumor types. Abbreviations: int-CA, intermediate cell carcinoma; IR, intron retention.
FIGURE 4
FIGURE 4
METTL16 expression suppresses cancer cell invasion and migration. (A, B) Effects of siRNA-mediated METTL16 knockdown (left) and overexpression (right) on the expression levels of NOTCH1 (A) and JAG1 (B). The data represent the mean ± SD of 6 independent experiments. (C, D) METTL16 is knocked down by siRNA transfection in HuH7, Hep3B, and HepG2 cells (C) and overexpressed in PLC/PRF/5, SNU182, and HepG2 cells (D) invasion (top) and migration (bottom) are shown, respectively. ***p < 0.001. Abbreviation: siRNA, small-interfering RNA.
FIGURE 5
FIGURE 5
Notch signaling mediates the effect of METTL16 on cancer cells. (A) Effects of Notch activators (valproic acid, VPA, 1 mM; YHHU3792, YHHU, 5 μM) on the invasion (top) and migration (bottom) of the siMETTL16-treated HuH7 (left) and Hep3B (right) cells are shown, respectively. (B) Effects of Notch inhibitors (DAPT, 10 μM; Crenigacestat, LY303, 2 nM) on the invasion (top) and migration (bottom) of the siMETTL16-treated PLC/PRF/5 (left) and SNU182 (right) cells are shown, respectively. Images are captured by light microscope (×5). Scale bars = 200 μm. **p < 0.01, and ***p < 0.001. Abbreviation: LY303, Crenigacestat.

References

    1. Xue R, Chen L, Zhang C, Fujita M, Li R, Yan SM, et al. . Genomic and transcriptomic profiling of combined hepatocellular and intrahepatic cholangiocarcinoma reveals distinct molecular subtypes. Cancer Cell. 2019;35:932–947.e8. - PMC - PubMed
    1. Joseph NM, Tsokos CG, Umetsu SE, Shain AH, Kelley RK, Onodera C, et al. . Genomic profiling of combined hepatocellular-cholangiocarcinoma reveals similar genetics to hepatocellular carcinoma. J Pathol. 2019;248:164–178. - PubMed
    1. Kim H, Park C, Han KH, Choi J, Kim YB, Kim JK, et al. . Primary liver carcinoma of intermediate (hepatocyte-cholangiocyte) phenotype. J Hepatol. 2004;40:298–304. - PubMed
    1. Brunt E, Aishima S, Clavien PA, Fowler K, Goodman Z, Gores G, et al. . cHCC-CCA: Consensus terminology for primary liver carcinomas with both hepatocytic and cholangiocytic differentation. Hepatology. 2018;68:113–126. - PMC - PubMed
    1. Beaufrère A, Calderaro J, Paradis V. Combined hepatocellular-cholangiocarcinoma: An update. J Hepatol. 2021;74:1212–1224. - PubMed

Publication types

Substances