. 2024 Oct 1;30(19):4434-4449.
doi: 10.1158/1078-0432.CCR-23-3298.

Redirecting B7-H3.CAR T Cells to Chemokines Expressed in Osteosarcoma Enhances Homing and Antitumor Activity in Preclinical Models

Affiliations

Redirecting B7-H3.CAR T Cells to Chemokines Expressed in Osteosarcoma Enhances Homing and Antitumor Activity in Preclinical Models

Lindsay J Talbot et al. Clin Cancer Res. .

Abstract

Purpose: Clinical efficacy of chimeric antigen receptor (CAR) T cells against pediatric osteosarcoma (OS) has been limited. One strategy to improve efficacy may be to drive chemokine-mediated homing of CAR T cells to tumors. We sought to determine the primary chemokines secreted by OS and evaluate the efficacy of B7-H3.CAR T cells expressing the cognate receptors.

Experimental design: We developed a pipeline to identify chemokines secreted by OS by correlating RNA-seq data with chemokine protein detected in media from fresh surgical specimens. We identified CXCR2 and CXCR6 as promising receptors for enhancing CAR T-cell homing against OS. We evaluated the homing kinetics and efficiency of CXCR2- and CXCR6.T cells and homing, cytokine production, and antitumor activity of CXCR2- and CXCR6.B7-H3.CAR T cells in vitro and in vivo.

Results: T cells transgenically expressing CXCR2 or CXCR6 exhibited ligand-specific enhanced migration over T cells modified with nonfunctional control receptors. Differential homing kinetics were observed, with CXCR2.T-cell homing quickly and plateauing early, whereas CXCR6.T cells took longer to home but achieved a similar plateau. When expressed in B7-H3.CAR T cells, CXCR2- and CXCR6 modification conferred enhanced homing toward OS in vitro and in vivo. CXCR2- and CXCR6-B7-H3.CAR-treated mice experienced prolonged survival in a metastatic model compared with B7-H3.CAR T-cell-treated mice.

Conclusions: Our patient-based pipeline identified targets for chemokine receptor modification of CAR T cells targeting OS. CXCR2 and CXCR6 expression enhanced the homing and anti-OS activity of B7-H3.CAR T cells. These findings support clinical evaluation of CXCR-modified CAR T cells to improve adoptive cell therapy for patients with OS.


Conflict of interest statement

L.J. Talbot reports grants from National Cancer Institute, Assisi Foundation of Memphis, Rally Foundation, and Infinite Love Foundation during the conduct of the study. P. Nguyen reports a patent for B7-H3 Chimeric Antigen Receptors, US Application 17/917,198 pending. P.J. Chockley reports a patent for CAR designs for immunotherapy pending. S. Gottschalk reports grants and other support from American Lebanese Syrian Associated Charities during the conduct of the study and personal fees from Tessa Therapeutics, Immatics, Tidal, Cargo, and Be Biopharma outside the submitted work, as well as multiple pending patents in the fields of T-cell, NK-cell, or gene therapy. C. DeRenzo reports grants from the Assisi Foundation of Memphis during the conduct of the study, as well as a patent for B7-H3 Chimeric Antigen Receptors, US application 17/917,198 pending. No disclosures were reported by the other authors.

Figures

Figure 1.
Figure 1.
RNA-seq and multiplex analyses identify chemokines produced by primary OS samples. A, Expression of 28 chemokines by RNA-seq (FPKM shown; n = 85 OS samples); screen cutoff shown at 1 FPKM. B, Expression of 28 chemokines by protein secretion (n = 8 patient samples); screen cutoff shown at 3 × 10³ integrated pixel density. Green bars in A and B denote ligands deemed positive in both RNA and protein screens; error bars indicate SEM. C, Chemokine receptors (ligands in parentheses) CXCR2 (IL8), CXCR3 (CXCL10), CXCR6 (CXCL16), CCR7 (CCL21), and CCR8 (CCL18) as expressed endogenously and detected by flow cytometry on activated T cells (n = 5 healthy donors; error bars indicate SEM). D, ELISA demonstrating detection of IL8 and CXCL16 in patient transport media specimens (n = 6 patient tumor samples, 1 normal bone sample; error bars indicate SEM).
Figure 2.
Figure 2.
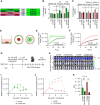
CXCR2- and CXCR6.T cells home to cognate ligands in vitro and ligand-expressing tumors in vivo. A, Schematic of CXCR-containing LV constructs. B and C, Fold increase from media-only condition of CXCR2- (B) and CXCR6- (C) T cells across a Boyden transwell membrane toward increasing doses of rhIL8 and rhCXCL16, respectively; N = 6 donors; technical replicates in triplicate; analysis performed by one-way ANOVA. *, P < 0.05; **, P < 0.01; ****, P < 0.0001. D, Illustration of the halo assay. E and F, Homing of CXCR.T cells toward 143B.mCherry.ffluc tumor droplets over time in the halo assay. Homing was quantified as the total green area/well (μm3). Shaded areas = SEM; N = 3 healthy donors; technical replicates in quadruplicate. Analysis performed by calculating AUC and performing Student unpaired t test between CXCR and CXCRdelta for CXCR2- and CXCR6-T cells, respectively. Error bars indicate SEM. ****, P < 0.0001. G–K, Evaluation of CXCR.T-cell homing in vivo. G, Experimental schema. NSG mice were orthotopically implanted in the right tibia with 5 × 10⁵ 143B OS cells followed by IV injection of CXCR.T cells on day 7. Mice were imaged daily via bioluminescence for 1 week. H, IVIS images demonstrating migration of T cells over time. I and J, Quantified radiance at tibial site. Error bars indicate SEM. K, AUC calculation for quantified radiance at tibial site curves. N = 5 mice/group; statistical analysis performed by Student t test at individual time points post-T-cell injection and AUC, followed by one-way ANOVA; *, P < 0.05; **, P < 0.01; ***, P < 0.001; ****, P < 0.0001.
Figure 3.
Figure 3.
CXCR2- and CXCR6.B7-H3.CAR T-cell in vitro function. A, IL2 and IFNγ production as evaluated after 24 hours in coculture with 143B OS tumor cells and measured by ELISA. B, Corresponding production of IL2 and IFNγ by T cells at 24 hours in culture without 143B OS tumor cells. N = 5 healthy donors, technical replicates in duplicate. Error bars indicate SEM. Statistical analysis performed by one-way ANOVA. C and D, The homing and cytolytic activity of T cells expressing CXCR2- or CXCR6.B7-H3.CAR, B7-H3.CAR alone, or B7-H3.Stop as well as nontransduced cells were evaluated in the halo assay. C, CXCR2.B7-H3.CAR T cells homed more quickly to central tumor droplets than CXCR6.B7H3.CAR T cells or B7-H3.CAR T cells alone. CXCR6.B7-H3.CAR T cells homed less quickly but still outperformed B7-H3.CAR T cells alone. Nontransduced and control CAR T cells provided a baseline nonspecific T-cell movement metric. D, CXCR2.B7-H3.CAR T cells exhibited earlier cytolytic activity compared with CXCR6.B7-H3.CAR T cells and B7-H3.CAR T cells alone. N = 5 healthy donors; technical replicates in quadruplicate; statistical analysis by area under curve calculation, followed by one-way ANOVA; ***, P < 0.001. T cells expressing functional CARs achieved a similar ultimate level of spheroid destruction. E, Representative images of the halo assay progressing from initiation of assay through 36 hours. Videos are available as Supplementary Material.
Figure 4.
Figure 4.
CXCR.B7-H3.CAR T cells home to and infiltrate 143B tumor lesions in vivo. A, Schematic of the in vivo homing experiment. NSG mice were implanted with 1 × 10⁵ 143B tumor cells in the right tibia, followed by tail vein injection of CAR T cells labeled with ffluc on day 3. Mice were imaged daily for 5 days, followed by every 2–3 days. B, Representative bioluminescent images of mice demonstrating the T-cell signal. C, Quantified radiance (p/seconds/cm2/sr) at the right tibial tumor site over time. D, Quantified radiance at the left tibial nontumor–bearing site over time. E, Quantified radiance of the lung field over time. F, Area under the curve of the right tibial radiance. G, Tumor elliptical circumference (mm2) of right tibial tumors. H, Representative images of the right tibial paraffin–embedded tumor stained with anti-CD3 IHC–rated antibody and infiltration analysis ROI placement. CD3–immunopositive T cells are highlighted with black arrowheads. I, Quantification of overall CD3+ T-cell infiltration into the tumor by IHC in cells/mm3. J, Heat map demonstrating the depth of infiltration of CD3+ T cells into the tumor with 0 mm = tumor–stromal interface and increasing in depth by 100 μm increments. N = 4–5 mice/group, error bars indicate SEM; analysis performed using one-way ANOVA of AUC; *, P < 0.05; ***, P < 0.001; ****, P < 0.0001.
Figure 5.
Figure 5.
Assessment of antitumor activity of CXCR.CAR T cells in the orthotopic primary site in vivo model. A, Schematic of in vivo primary orthotopic antitumor experiments. NSG mice were implanted with 1 × 10⁵ 143B tumor cells in the right tibia, followed by tail vein injection of CAR T cells 3 days later. Mice were followed by serial caliper measurements to evaluate tumor burden. B, Individual mouse bioluminescence curves over time in CXCR.B7-H3, B7-H3, and control CAR cohorts. C, Mouse subject weights over the experimental course. D, Tumor elliptical circumference at early time points posttumor implantation. Overall, the tibial tumor size was similar in early time points, with a brief reduction in size in the B7-H3.CAR-treated cohort at day 21. E, Kaplan–Meier survival curves. All CAR-treated cohorts exhibited improved survival compared with the control CAR, but no difference was observed based on CXCR expression. F, Individual mouse bioluminescence curves over time in CXCR.EphA2, EphA2, and control CAR cohorts. G, Mouse subject weights over the experimental course. H, Representative photographs of alopecia developing in EphA2.CAR-treated mice. I, Kaplan–Meier survival curves. CXCR6.EphA2.CAR-treated mice exhibited improved survival compared with control CAR–treated mice. No other significant differences were observed. For all experiments, error bars indicate SEM. *, P < 0.05; **, P < 0.01; ***, P < 0.001. For CXCR.B7-H3, B7-H3, and control CAR experiments, N = 8–14 mice/cohort, two T-cell experimental donors. For CXCR.EphA2, EphA2, and control CAR experiment, N = 5–7 mice/cohort, one T-cell experimental donor.
Figure 6.
Figure 6.
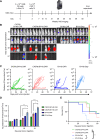
Assessment of in vivo antitumor activity in metastatic model. A, Schematic of in vivo antitumor activity in metastatic setting experiment. NSG mice were injected with 1 × 10⁵ 143B.mCherry.ffluc OS cells by tail vein and 3 days later treated with 5 × 10⁶ CAR T cells by tail vein. Mice were imaged weekly using bioluminescence to track tumor burden. B, Representative images of mice during demonstrating tumor burden. C, Individual mouse bioluminescence curves over time. D, Quantification of bioluminescent signal at early time points including days 7, 10, and 14 posttumor implantation. At early time points, only CXCR.B7-H3.CAR T cells reduced tumor burden to a statistically significant degree. E, Kaplan–Meier survival curves. CXCR2- and CXCR6.B7-H3.CAR–treated mice exhibited enhanced survival compared with other groups. N = 10 mice per group except CXCR6.B7-H3.CAR (15 mice). Experiments used T cells from two healthy donors. Quantitative bioluminescence analysis by two-way ANOVA; survival analysis by log-rank (Mantel–Cox) test; ns, not significant; *, P < 0.05; **, P < 0.01; ***, P < 0.001.

References

    1. Isakoff MS, Bielack SS, Meltzer P, Gorlick R. Osteosarcoma: current treatment and a collaborative pathway to success. J Clin Oncol 2015;33:3029–35. - PMC - PubMed
    1. Gok Durnali A, Paksoy Turkoz F, Ardic Yukruk F, Tokluoglu S, Yazici OK, Demirci A, et al. . Outcomes of adolescent and adult patients with lung metastatic osteosarcoma and comparison of synchronous and metachronous lung metastatic groups. PLoS One 2016;11:e0152621. - PMC - PubMed
    1. Lagmay JP, Krailo MD, Dang H, Kim A, Hawkins DS, Beaty O III, et al. . Outcome of patients with recurrent osteosarcoma enrolled in seven phase II trials through children's cancer group, pediatric oncology group, and children's oncology group: learning from the past to move forward. J Clin Oncol 2016;34:3031–8. - PMC - PubMed
    1. Roberts RD, Lizardo MM, Reed DR, Hingorani P, Glover J, Allen-Rhoades W, et al. . Provocative questions in osteosarcoma basic and translational biology: a report from the Children's Oncology Group. Cancer 2019;125:3514–25. - PMC - PubMed
    1. Kleinerman E. Maximum benefit of chemotherapy for osteosarcoma achieved-what are the next steps? Lancet Oncol 2016;17:1340–2. - PubMed

MeSH terms