. 2024 Aug 1;13(8):6.
doi: 10.1167/tvst.13.8.6.

Topographic Clinical Insights From Deep Learning-Based Geographic Atrophy Progression Prediction

Affiliations

Topographic Clinical Insights From Deep Learning-Based Geographic Atrophy Progression Prediction

Julia Cluceru et al. Transl Vis Sci Technol. .

Abstract

Purpose: To explore the contributions of fundus autofluorescence (FAF) topographic imaging features to the performance of convolutional neural network-based deep learning (DL) algorithms in predicting geographic atrophy (GA) growth rate.

Methods: Retrospective study with data from study eyes from three clinical trials (NCT02247479, NCT02247531, NCT02479386) in GA. The algorithm was initially trained with full FAF images, and its performance was considered benchmark. Ablation experiments investigated the contribution of imaging features to the performance of the algorithms. Three FAF image regions were defined relative to GA: Lesion, Rim, and Background. For No Lesion, No Rim, and No Background datasets, a single region of interest was removed at a time. For Lesion, Rim, and Background Shuffled datasets, individual region pixels were randomly shuffled. For Lesion, Rim, and Background Mask datasets, masks of the regions were used. A Convex Hull dataset was generated to evaluate the importance of lesion size. Squared Pearson correlation (r2) was used to compare the predictive performance of ablated datasets relative to the benchmark.

Results: The Rim region influenced r2 more than the other two regions in all experiments, indicating the most relevant contribution of this region to the performance of the algorithms. In addition, similar performance was observed for all regions when pixels were shuffled or only a mask was used, indicating intensity information was not independently informative without textural context.

Conclusions: These ablation experiments enabled topographic clinical insights on FAF images from a DL-based GA progression prediction algorithm.

Translational relevance: Results from this study may lead to new insights on GA progression prediction.


Conflict of interest statement

Disclosure: J. Cluceru, F. Hoffmann-La Roche (I), Genentech (E); N. Anegondi, F. Hoffmann-La Roche (I), Genentech (E); S.S. Gao, F. Hoffmann-La Roche (I), Genentech (E); A.Y. Lee, Amazon (F), Boehringer Ingelheim (F), Carl Zeiss Meditec (F), Genentech (F), Gyroscope (F), iCareWorld (F), Johnson & Johnson (F), Meta (F), Microsoft (N), Regeneron (F), Santen (F), Topcon (F), U.S. FDA (F); E.M. Lad, Alexion (C), Alexion (F), Allegro (C), Annexon (C), Apellis (C, F), Aspen Neuroscience (C), Boehringer Ingelheim (F), Broadwing Bio (C), Galimedix (C), Gemini Therapeutics (C, F), Genentech (C, F), IVERIC Bio (C, F), Janssen (C, F), LumiThera (F), Nanoscope Therapeutics (C), Neurotech (F), NGM Biopharmaceuticals (C, F), Novartis (C, F), Osanni Bio (C), Perceive Bio (C), Research to Prevent Blindness (F), Retrotope (C), Thea Laboratoires (C); U. Chakravarthy, Adverum (S), Alimera (C), Apellis (C), Boehringer Ingelheim (C), F. Hoffmann-La Roche (C), RetinaAI (C); Q. Yang, F. Hoffmann-La Roche (I), Genentech (E); V. Steffen, F. Hoffmann-La Roche (I), Genentech (E); M. Friesenhahn, F. Hoffmann-La Roche (I), Genentech (E); C. Rabe, F. Hoffmann-La Roche (I), Genentech (E); D. Ferrara, F. Hoffmann-La Roche (I), Genentech (E)

Figures

Figure 1.
Figure 1.
(A) A full FAF image is depicted as the reference for the ablated datasets (BN). Row 1 (BD) depicts one region (Lesion, Rim, or Background) ablated with black pixels. Row 2 (EG) depicts two regions ablated, with one region retained at a time. Row 3 (HJ) depicts two regions ablated, with a single region retained and the pixels of that region randomly shuffled. Row 4 (KM) depicts the mask of a single region derived from the output of a previously described segmentation algorithm, and Row 4 (N) depicts an example of a Convex Hull used to ablate additional shape features, such as focality and perimeter estimation. Lesion, inside the GA lesion; Rim, a 500-µm rim surrounding the GA lesion; Background, the region outside of those.
Figure 2.
Figure 2.
Contribution of FAF texture features of various ablation regions. For each experiment, the same hyperparameters were used to build five distinct DL models in a fivefold cross-validation experimental setup. The five trained models were then tested on the holdout set, and the performance (r2) was recorded as shown. (A) Comparison of the individually ablated regions (No Background, No Lesion, and No Rim) with the full FAF image. (B) Comparison of the individual regions retained (Rim Only, Lesion Only, and Background Only) with the full FAF image.
Figure 3.
Figure 3.
The contribution of FAF intensity information was investigated by shuffling the pixels in a given region of interest. Texture refers to one region retained with no alterations (retaining full texture information), Shuffled refers to the pixels within the region randomly shuffled to remove texture but retain intensity information, and Mask refers to the region mask only with no texture and no intensity information. Each panel refers to a separate region comparison: (A) Lesion, (B) rim, and (C) Background. In each case, the Mask and Shuffled datasets performed comparably.
Figure 4.
Figure 4.
Contribution of GA features related to shape and size. In this figure, the full FAF image is used for reference and compared with the Lesion Mask (r2 mean = 0.27) and the Convex Hull (r2 mean = 0.18) to evaluate the contribution of GA features related to shape and size. Notably, GA focality, edge detail, and more precise area estimation account for the difference between 0.18 and 0.27, respectively; FAF texture features account for the 0.17 difference between 0.27 and 0.44, respectively.
Figure 5.
Figure 5.
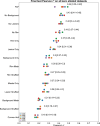
Comparison of the r2 results for all zero ablated datasets.

References

    1. Rein DB, Wittenborn JS, Burke-Conte Z, et al. .. Prevalence of age-related macular degeneration in the US in 2019. JAMA Ophthalmol. 2022; 140: 1202–1208. - PMC - PubMed
    1. Schmitz-Valckenberg S, Pfau M, Fleckenstein M, et al. .. Fundus autofluorescence imaging. Prog Retin Eye Res. 2021; 81: 100893. - PubMed
    1. Holekamp N, Wykoff CC, Schmitz-Valckenberg S, et al. .. Natural history of geographic atrophy secondary to age-related macular degeneration: results from the prospective Proxima A and B clinical trials. Ophthalmology. 2020; 127: 769–783. - PubMed
    1. Holz FG, Sadda SR, Busbee B, et al. .. Efficacy and safety of lampalizumab for geographic atrophy due to age-related macular degeneration: Chroma and Spectri phase 3 randomized clinical trials. JAMA Ophthalmol. 2018; 136: 666–677. - PMC - PubMed
    1. Sadda SR, Chakravarthy U, Birch DG, Staurenghi G, Henry EC, Brittain C.. Clinical endpoints for the study of geographic atrophy secondary to age-related macular degeneration. Retina. 2016; 36: 1806–1822. - PMC - PubMed

Publication types

Associated data

LinkOut - more resources