

Attentional selection and communication through coherence: Scope and limitations
- PMID: 39102437
- PMCID: PMC11326628
- DOI: 10.1371/journal.pcbi.1011431
Attentional selection and communication through coherence: Scope and limitations
Abstract
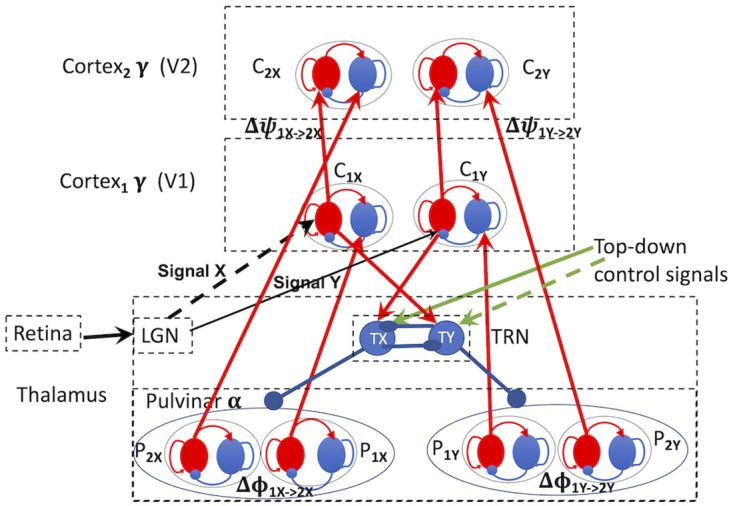
Synchronous neural oscillations are strongly associated with a variety of perceptual, cognitive, and behavioural processes. It has been proposed that the role of the synchronous oscillations in these processes is to facilitate information transmission between brain areas, the 'communication through coherence,' or CTC hypothesis. The details of how this mechanism would work, however, and its causal status, are still unclear. Here we investigate computationally a proposed mechanism for selective attention that directly implicates the CTC as causal. The mechanism involves alpha band (about 10 Hz) oscillations, originating in the pulvinar nucleus of the thalamus, being sent to communicating cortical areas, organizing gamma (about 40 Hz) oscillations there, and thus facilitating phase coherence and communication between them. This is proposed to happen contingent on control signals sent from higher-level cortical areas to the thalamic reticular nucleus, which controls the alpha oscillations sent to cortex by the pulvinar. We studied the scope of this mechanism in parameter space, and limitations implied by this scope, using a computational implementation of our conceptual model. Our results indicate that, although the CTC-based mechanism can account for some effects of top-down and bottom-up attentional selection, its limitations indicate that an alternative mechanism, in which oscillatory coherence is caused by communication between brain areas rather than being a causal factor for it, might operate in addition to, or even instead of, the CTC mechanism.
Copyright: © 2024 Greenwood, Ward. This is an open access article distributed under the terms of the Creative Commons Attribution License, which permits unrestricted use, distribution, and reproduction in any medium, provided the original author and source are credited.
Conflict of interest statement
The authors have declared that no competing interests exist.
Figures


Similar articles
-
Top-down control of cortical gamma-band communication via pulvinar induced phase shifts in the alpha rhythm.PLoS Comput Biol. 2017 May 4;13(5):e1005519. doi: 10.1371/journal.pcbi.1005519. eCollection 2017 May. PLoS Comput Biol. 2017. PMID: 28472057 Free PMC article.
-
Engagement of Pulvino-cortical Feedforward and Feedback Pathways in Cognitive Computations.Neuron. 2019 Jan 16;101(2):321-336.e9. doi: 10.1016/j.neuron.2018.11.023. Epub 2018 Dec 12. Neuron. 2019. PMID: 30553546 Free PMC article.
-
Pulvino-cortical interaction: An integrative role in the control of attention.Neurosci Biobehav Rev. 2020 Apr;111:104-113. doi: 10.1016/j.neubiorev.2020.01.005. Epub 2020 Jan 20. Neurosci Biobehav Rev. 2020. PMID: 31972202 Review.
-
Communication between Brain Areas Based on Nested Oscillations.eNeuro. 2017 Mar 27;4(2):ENEURO.0153-16.2017. doi: 10.1523/ENEURO.0153-16.2017. eCollection 2017 Mar-Apr. eNeuro. 2017. PMID: 28374013 Free PMC article.
-
The many characters of visual alpha oscillations.Eur J Neurosci. 2018 Oct;48(7):2498-2508. doi: 10.1111/ejn.13747. Epub 2017 Nov 6. Eur J Neurosci. 2018. PMID: 29044823 Review.
Cited by
-
Hierarchical Neural Circuit Theory of Normalization and Inter-areal Communication.bioRxiv [Preprint]. 2025 Jul 19:2025.07.15.664935. doi: 10.1101/2025.07.15.664935. bioRxiv. 2025. PMID: 40791322 Free PMC article. Preprint.
References
-
- Tiesinga P.H.E., Fellous J-M., José J.V. and Sejnowski T.J. Optimal information transfer in synchronized neocortical neurons Neurocomp., 38-40, 397–402, 2001. doi: 10.1016/S0925-2312(01)00464-7 - DOI
MeSH terms
LinkOut - more resources
Full Text Sources
