. 2024 Aug 1;2024(65):123-131.
doi: 10.1093/jncimonographs/lgae024.

Toward real-time reporting of cancer incidence: methodology, pilot study, and SEER Program implementation

Affiliations

Toward real-time reporting of cancer incidence: methodology, pilot study, and SEER Program implementation

Huann-Sheng Chen et al. J Natl Cancer Inst Monogr. .

Abstract

Background: A lag time between cancer case diagnosis and incidence reporting impedes the ability to monitor the impact of recent events on cancer incidence. Currently, the data submission standard is 22 months after a diagnosis year ends, and the reporting standard is 27.5 months after a diagnosis year ends. This paper presents the National Cancer Institute (NCI) Surveillance, Epidemiology, and End Results (SEER) Program's efforts to minimize the lag and achieve "real-time" reporting, operationalized as submission within 2 months from the end of a diagnosis year.

Methods: Technology for rapidly creating a consolidated tumor case (CTC) from electronic pathology (e-path) reports is described. Statistical methods are extended to adjust for biases in incidence rates due to reporting delays for the most recent diagnosis years.

Results: A registry pilot study demonstrated that real-time submissions can approximate rates obtained from 22-month submissions after adjusting for reporting delays. A plan to be implemented across the SEER Program rapidly ascertains unstructured e-path reports and uses machine learning algorithms to translate the reports into the core data items that comprise a CTC for incidence reporting. Across the program, cases were submitted 2 months after the end of the calendar year. Registries with the most promising baseline values and a willingness to modify registry operations have joined a program to become certified as real-time reporting.

Conclusion: Advances in electronic reporting, natural language processing, registry operations, and statistical methodology, energized by the SEER Program's mobilization and coordination of these efforts, will make real-time reporting an achievable goal.


Conflict of interest statement

The authors declare no potential conflicts of interest.

Figures

Figure 1.
Figure 1.
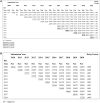
Data structure for delay model. A) Data structure for the 22-month delay model from a typical Surveillance, Epidemiology, and End Results (SEER) registry. The counts are for liver and intrahepatic bile duct cancer for all races. The rows of the data matrix represent the year of diagnosis of a case. The cells underlined in the diagonal are the number of first reported cases for that diagnosis year. The last column is the delay factor derived from the 22-month delay model. B) Data structure for the 14-month delay model from a typical Surveillance, Epidemiology, and End Results (SEER) registry. The counts are liver and intrahepatic bile duct cancer for all races. Each submission year has two columns: one in February, and the other in November. The rows of the data matrix represent the year of diagnosis. The cells underlined in the diagonal are the first reported cases for that diagnosis year, submitted preliminarily in February. The last column is the delay factor derived from the 14-month delay model.
Figure 2.
Figure 2.
Data structure for real-time delay model from the Seattle registry (pilot study) for all cancer sites combined. A) shows data for the test model. The data are from 2-month and 14-month submissions and added consolidated tumor case (CTC) count. The rows of the data matrix represent the year of diagnosis. The underlined bold cells are the CTC counts reported in the following February, 2 months after the close of a diagnosis year. The next cells are the CTC counts updated in November for the cases from the same diagnosis year. The last column is the delay factor derived from the 2-month delay model. B) shows data for the validation model. The data are from 22-month submissions. The last column is the delay factor derived from the 22-month delay model.
Figure 3.
Figure 3.
Histograms of ratios of 2-month consolidated tumor case (CTC) count to 22-month submission for cases diagnosed in 2018, Seattle registry. A) Ratios of observed rates. The arrow points to 0.924, the ratio for all sites for males. B) Ratios of delay-adjusted rates. The ratio for all sites for males is 0.986, which is close to 1.
Figure 4.
Figure 4.
SEER*DMS flow chart. Figure 4 shows comparison of current registry operations versus operations workflow optimized for real-time incidence reporting, Surveillance, Epidemiology, and End Results (SEER) Data Management System (SEER*DMS).

References

    1. Ahmad FB, Cisewski JA, Minino A, Anderson RN. Provisional mortality data—United States, 2020. MMWR Morb Mortal Wkly Rep. 2021;70(14):519-522. - PMC - PubMed
    1. Murphy SL, Kochanek KD, Xu J, Arias E. Mortality in the United States, 2020. NCHS Data Brief. 2021;(427):1-8. - PubMed
    1. Lewis DR, Chen H-S, Cockburn M, et al. Preliminary estimates of SEER cancer incidence for 2013. Cancer-Am Cancer Soc. 2016;122(10):1579-1587. - PubMed
    1. Lewis DR, Chen H-S, Cockburn MG, et al. Early estimates of SEER cancer incidence, 2014. Cancer-Am Cancer Soc. 2017;123(13):2524-2534. - PMC - PubMed
    1. Lewis DR, Chen H-S, Cockburn MG, et al. Early estimates of cancer incidence for 2015: expanding to include estimates for white and black races. Cancer-Am Cancer Soc. 2018;124(10):2192-2204. - PMC - PubMed