. 2024 Oct 3;36(10):4511-4534.
doi: 10.1093/plcell/koae222.

Flavonols improve tomato pollen thermotolerance during germination and tube elongation by maintaining reactive oxygen species homeostasis

Affiliations

Flavonols improve tomato pollen thermotolerance during germination and tube elongation by maintaining reactive oxygen species homeostasis

Anthony E Postiglione et al. Plant Cell. .

Abstract

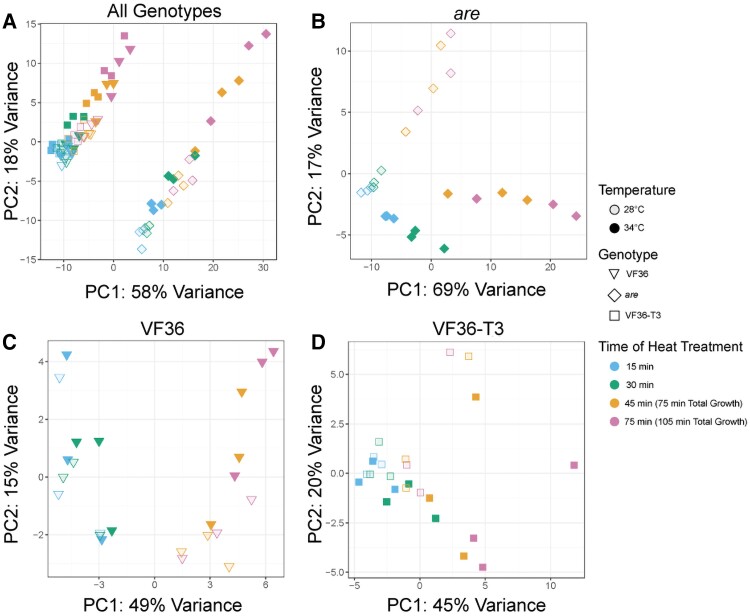
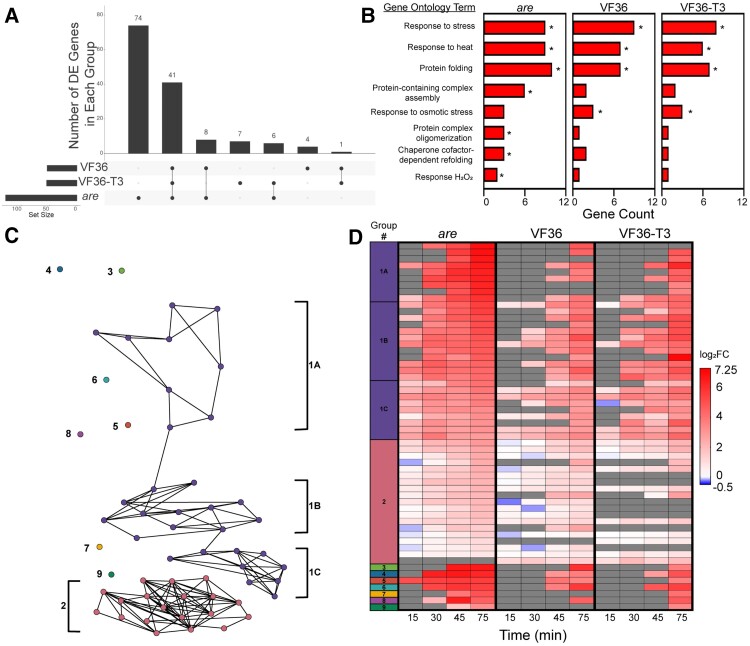
Elevated temperatures impair pollen performance and reproductive success, resulting in lower crop yields. The tomato (Solanum lycopersicum) anthocyanin reduced (are) mutant harbors a mutation in FLAVANONE 3-HYDROXYLASE (F3H), resulting in impaired flavonol antioxidant biosynthesis. The are mutant has reduced pollen performance and seed set relative to the VF36 parental line, phenotypes that are accentuated at elevated temperatures. Transformation of are with the wild-type F3H gene, or chemical complementation with flavonols, prevented temperature-dependent reactive oxygen species (ROS) accumulation in pollen and restored the reduced viability, germination, and tube elongation of are to VF36 levels. Overexpression of F3H in VF36 prevented temperature-driven ROS increases and impaired pollen performance, revealing that flavonol biosynthesis promotes thermotolerance. Although stigmas of are had reduced flavonol and elevated ROS levels, the growth of are pollen tubes was similarly impaired in both are and VF36 pistils. RNA-seq was performed at optimal and stress temperatures in are, VF36, and the F3H overexpression line at multiple timepoints across pollen tube elongation. The number of differentially expressed genes increased over time under elevated temperatures in all genotypes, with the greatest number in are. These findings suggest potential agricultural interventions to combat the negative effects of heat-induced ROS in pollen that lead to reproductive failure.


Conflict of interest statement

Conflict of interest statement. None declared.

Figures

Figure 1.
Figure 1.
The flavonoid biosynthetic pathway in tomato. Pathway intermediates and enzymes that interconvert them are shown. The major intermediates of flavonoid metabolism are indicated with the enzymes catalyzing the biosynthetic reactions indicated. This paper focuses on the are mutant (in red) with a defect in the F3H enzyme, indicated in the green box. The chemical structures of the most abundant flavonols in tomato are shown within the yellow box. Enzyme abbreviations are as follows: CHS, chalcone synthase; CHI, chalcone isomerase; F3H, flavanone 3 hydroxylase, F3′H, flavonoid 3′-hydroxylase; F3′5′H, flavonoid 3′5′-hydroxylase; FLS, flavonol synthase; DFR, dihydroflavonol reductase; ANS, anthocyanin synthase. The solid lines indicate single reactions, while the dotted line indicates multiple enzymatic steps.
Figure 2.
Figure 2.
Flavonols positively regulate pollen yield and protect pollen viability during heat stress. A) Quantification of the average number of live pollen grains per flower ± SEM in each genotype immediately upon harvesting. Three independent replicates were quantified with each replicate containing 4 flowers per genotype. B) Representative confocal micrographs of pollen grains of VF36, are, are complemented with a Pro35S:F3H transgene (are-T5), and VF36 transformed with this same transgene (VF36-T3). Pollen grains incubated at either 28 or 34 °C for 2 h and then costained with FDA (denoting live grains in green) and PI (denoting dead grains in magenta). Scale bar: 50 µm for all panels. C) Quantification of the percentage of viable pollen grains of VF36, are, are-T5, and VF36-T3 after 2-h incubation at 28 or 34 °C from 4 independent experiments with > 850 pollen grains for each sample. Error bars represent Se of the mean. Asterisks denote significant differences from VF36 at the same temperature, and hash marks denote significant differences between temperatures within the same genotype according to a 2-way ANOVA followed by a Tukey post hoc test with a P < 0.05.
Figure 3.
Figure 3.
Flavonols are present in the pollen tube at greater magnitudes in tomato lines with a functional F3H gene. A) Representative confocal micrographs of flavonol levels in VF36-are, are-T5, and VF36-T3 pollen tubes as visualized by DPBA staining. DPBA fluorescence is shown in yellow as well as converted to a LUT scale with the indicated scale. Size bar: 10 µm for all images. B) Quantification of the DPBA fluorescence intensity across a 50-pixel wide, 40 µm long line profile beginning at the pollen tube tip. The average of 3 independent experiments was quantified with each replicate containing 5 tubes per genotype with the gray shading denoting the Se of the mean. Asterisks denote significant differences between genotypes indicated by brackets according to a 1-way ANOVA followed by a Tukey post hoc test with a P < 0.05.
Figure 4.
Figure 4.
The negative effects of high temperature on tomato pollen germination and tube length are accentuated in are and reversed by an F3H transgene. A) Representative brightfield images of VF36, are, are-F3H-T5, and VF36-F3H-T3 pollen germination after 30 min at either 28 or 34 °C. Arrows denote ruptured pollen. Scale bar: 50 µm in all panels. B) Quantification of percent pollen germination that exhibited intact tubes after 30 min and the average and Se of the mean from 3 independent experiments (n > 90 pollen grains per genotype and treatment). C) Representative images of pollen tubes elongating for 120 min at 28 °C, or at 30 min at 28 °C, and then transferred to 34 °C for an additional 90 min. Five pollen tubes from each image are highlighted in blue to enhance visibility. Scale bar: 100 µm in all panels. D) Quantification of mean pollen tube length is shown for >200 pollen tubes per genotype and treatment. Error bars represent Se of the mean. B and D) Asterisks denote significant differences from VF36 at the corresponding temperature, and hash marks denote significant differences between temperatures within the same genotype according to a 2-way ANOVA followed by a Tukey post hoc test with a P < 0.05.
Figure 5.
Figure 5.
The heat accentuated rupturing of are pollen tubes is not improved by culturing with the VF36 parental line. A) Representative images of pollen tubes of VF36 ProLAT52:GFP (green) germinated along with untransformed are. Pollen was germinated in vitro and for 120 min at 28 °C or for 30 min at 28 °C followed by 90 min at 34 °C. B) Quantification of mean percent pollen tube rupture for VF36 ProLAT52:GFP and are (n > 500 pollen grains for each genotype from 3 biological replicates with 6 technical replicates within each sample). Error bars represent Se of the mean. C) Representative images of pollen tubes of VF36 germinated with are ProLAT52:GFP (green). D) Mean percent pollen tube rupture ± SEM for VF36 and are ProLAT52:GFP (n > 500 pollen grains for each genotype from 3 biological replicates with 6 technical replicates within each sample). A and C) Scale bar: 100 µm in both panels. Arrows denote ruptured pollen in are. Square insets show a magnified view of ruptured pollen tubes with a 40 µm scale bar in both inserts. Asterisks denote significant differences between genotype at the same temperature, and hash marks denote significant differences between temperatures within the same genotype according to a 2-way ANOVA followed by a Tukey post hoc test with a P < 0.05.
Figure 6.
Figure 6.
Heat-induced ROS accumulation in germinating pollen grains and elongating pollen tubes is reduced with increased flavonol synthesis. A) Representative confocal micrographs of pollen grains germinated for 10 min and then stained with CM-H2DCFDA for 20 min. DCF fluorescence has been converted to a LUT scale for visualization with the range shown in the color scale. Scale bar: 50 µm for all panels. B) The mean and Se of fluorescence of germinating pollen relative to VF36 at 28 °C across 4 to 5 independent experiments are reported (n > 89 grains per genotype and treatment). C) Representative fluorescent images of pollen tubes germinated for 30 min at 28 °C and then transferred to 28 or 34 °C for an additional 90 min. Pollen tubes were then stained with CM-H2DCFDA for 20 min. DCF fluorescence has been converted to a LUT scale for visualization with the range shown as a color scale. The VF36-T3 images are zoomed out as these pollen tubes are longer. Scale bars: 100 µm for all pollen tube images. D) The mean fluorescence of elongating pollen tubes relative to VF36 at 28 °C across 3 independent experiments is reported with the error bars representing the Se of the mean (n > 85 tubes per genotype and treatment). Fluorescence values were normalized to the VF36 pollen germinated at 28 °C. Asterisks denote significant differences from VF36 at the same temperature, and hash marks denote significant differences between temperatures within the same genotype according to a 2-way ANOVA followed by a Tukey post hoc test with a P < 0.05.
Figure 7.
Figure 7.
Elevated temperature increases H2O2 accumulation in VF36, and are pollen tubes, but not are-T5 nor VF36-T3. A) Representative confocal micrographs of PO1 fluorescence in VF36-are, are-T5, and VF36-T3 pollen tubes germinated for 30 min at 28 °C and then transferred to 28 °C (blue line) or 34 °C (black line) for an additional 90 min. PO1 signal intensity is converted to a LUT scale with the relative range of intensity shown in the color scale. Scale bar: 10 µm. B) Quantification of the PO1 fluorescence intensity across a 50-pixel wide, 40 µm long line profile beginning at the pollen tube tip. Three independent experiments were quantified with each replicate containing 5 tubes per genotype, and the blue represents fluorescence in 28 °C samples and the black line in 34 °C samples. The average is graphed with the gray shading representing the Se of the mean. The hash symbols denote significant differences between 28 and 34 °C within the same genotype according to a one-way ANOVA followed by a Tukey post hoc test with a P < 0.05.
Figure 8.
Figure 8.
Impaired pollen germination in are is reversed by supplementation with the flavonol kaempferol. A) The percentage of VF36 and are pollen grains that germinate with and without exogenous kaempferol treatment was examined at doses of 0, 5, or 30 μm at 28 or 34 °C. The mean and Se are reported for percent germination in the presence and absence of flavonols were determined in 3 to 4 independent experiments with n > 80 grains per sample. B) The mean and Se of fluorescence intensity of DCF in germinating pollen grains incubated with 0, 5, or 30 μm kaempferol are reported relative to VF36 at 28 °C across 4 independent experiments (n > 40 grains per genotype and treatment). A and B) Asterisks denote significant differences from 0 μm flavonol treatment within genotype and temperature treatment according to a 2-way ANOVA followed by a Tukey post hoc test with a P < 0.05.
Figure 9.
Figure 9.
Flavonols in the pollen are necessary for pollen tube penetration through the stigma. A) Representative images of flavonol levels in VF36 and are stigmas as visualized by DPBA staining (yellow). B) The mean and Se of DPBA fluorescence intensity in VF36 and are stigmas are reported relative to VF36 levels (n ≥ 9 stigmas per each genotype from 3 independent experiments). Asterisk denotes a significant difference between VF36 and are according to a Student's t test with P < 0.05. C) Representative images of VF36 and are stigmas stained with PO1 to detect H2O2 (orange). D) The mean and Se of the mean of PO1 fluorescence intensity are reported relative to the VF36 stigma in VF36 and are stigmas (n ≥ 11 stigmas per genotype from 4 independent experiments). Asterisk denotes a significant difference between VF36 and are according to a Student's t test with P < 0.05. E) Representative confocal micrographs of pollen tubes growing through the female reproductive tract as visualized by decolorized aniline blue. The contrast and brightness of each image were adjusted differently to maximize visualization of pollen tubes to allow for accurate counting. F) Quantification of the number of pollen tubes that penetrated through the stigma region ± SEM. Different letters denote significant differences according to a 1-way ANOVA followed by a Tukey post hoc test with P < 0.05 (n ≥ 19 pollinated pistils for each cross from at least 5 independent experiments). The scale bar is 250 µm for all images.
Figure 10.
Figure 10.
Inhibition of RBOH activity reduces heat-induced ROS accumulation and impaired pollen performance. A) Representative confocal micrographs of DCF fluorescence intensity of elongating pollen tubes treated with 1 μm of the pan-RBOH inhibitor VAS2870 (green). Quantification of average and SEM of B) DCF fluorescence intensity, C) pollen tube length, and D) germination in PGM containing VAS2870 across 4 independent experiments is reported (n > 200 grains or 62 tubes per genotype and treatment). Pollen was incubated at 28 or 34 °C. Asterisks denote significant differences from 0 μm VAS2870 treatment within a particular genotype and temperature treatment according to 2-way ANOVA followed by a Tukey post hoc test with a P < 0.05. The scale bar is 100 µm for all images.
Figure 11.
Figure 11.
PCA plots highlight distinct transcriptional responses between are and the other 2 genotypes and in response to elevated temperature. A) PCA plot for all samples analyzed via RNA-seq. The samples in the right cluster are all are samples, while the group on the left contains both VF36 and the VF36-T3 samples. Individual PCA plots for each genotype reveal the time and temperature response within each genotype with B)are, C) VF36, and D) VF36-T3 samples.
Figure 12.
Figure 12.
Transcriptional responses increase across the duration of temperature stress and are accentuated in the are mutant. A) The number of DE genes at 34 °C relative to 28 °C within each genotype as determined using EdgeR is graphed as a function of time of pollen tube growth for VF36, are, and VF36-F3H-T3. These genes were defined as DE if they had an adjusted P < 0.05 and log fold change greater than or less than 1. B to D) Volcano plots of the log fold change at 34 °C relative to 28 °C and P-values for all samples. The dotted lines represent P-value cutoffs of 0.05 and log2FC of 1. B)are, C) VF36, and D) VF36-F3H-T3. Blue circles denote genes that are downregulated (log2FC below 1), red crosses indicate genes that are upregulated (log2FC above 1), while gray circles denote genes that do not display a log2FC above or below the cutoff of 1.
Figure 13.
Figure 13.
The heat-dependent transcriptional response of are occurs more rapidly and contains a greater number of unique transcripts. A) Upset plot of temperature-dependent DE genes within each genotype after 75 min heat treatment (105 min total growth). Numbers above bars represent the number of temperature-regulated DE genes that are shared between genotypes connected by lines. Set size refers to the number of DE genes at this specific timepoint for each genotype. B) Biological processes that are significantly enriched in transcripts that are DE at the elevated temperature in the are mutant were determined using String. Groups that were significantly enriched in the are mutant are reported. The number of genes in each group was determined for the other genotypes. Asterisk indicates the groups for which enrichment was significant relative to genome. C) PaLD generated network of 56 genes that were found to be DE in 2 or more genotypes after 75 min heat treatment (105 min total growth) with nodes color coded for each group of like responding transcripts. D) Heatmap of the 56 genes used in the PaLD analysis, with the first column representing the PaLD groups from C) (Khoury et al. 2023). The temperature-dependent log2FC of these genes was then mapped back to pollen samples taken at the earlier timepoints. Gray boxes represent no detected expression at that timepoint.
Figure 14.
Figure 14.
The are mutant displays an upregulated heat response even at optimal temperatures. Heatmap of the 36 genes encoding heat shock factors that were found between are and VF36 at 28 °C. log2FC of are relative to VF36 for these genes was then mapped back to pollen samples taken at the earlier timepoints. Genes are ranked by highest logFC in are at the 75 min timepoint (105 min total growth). Gray boxes represent no detected expression at that timepoint.

Update of

References

    1. Agati G, Azzarello E, Pollastri S, Tattini M. Flavonoids as antioxidants in plants: location and functional significance. Plant Sci. 2012:196:67–76. 10.1016/j.plantsci.2012.07.014 - DOI - PubMed
    1. Ali MF, Muday GK. Reactive oxygen species are signaling molecules that modulate plant reproduction. Plant Cell Environ. 2024:47(5):1592–1605. 10.1111/pce.14837 - DOI - PubMed
    1. Alseekh S, Perez de Souza L, Benina M, Fernie AR. The style and substance of plant flavonoid decoration; towards defining both structure and function. Phytochemistry. 2020:174:112347. 10.1016/j.phytochem.2020.112347 - DOI - PubMed
    1. Begcy K, Nosenko T, Zhou L-Z, Fragner L, Weckwerth W, Dresselhaus T. Male sterility in maize after transient heat stress during the tetrad stage of pollen development. Plant Physiol. 2019:181(2):683–700. 10.1104/pp.19.00707 - DOI - PMC - PubMed
    1. Berenhaut KS, Moore KE, Melvin RL. A social perspective on perceived distances reveals deep community structure. Proc Natl Acad Sci U S A. 2022:119(4):e2003634119.10.1073/pnas.2003634119 - DOI - PMC - PubMed

MeSH terms

LinkOut - more resources