. 2024 Oct:380:114907.
doi: 10.1016/j.expneurol.2024.114907. Epub 2024 Aug 3.

Cerebral hypoperfusion exacerbates vascular dysfunction after traumatic brain injury

Affiliations

Cerebral hypoperfusion exacerbates vascular dysfunction after traumatic brain injury

Bailey Whitehead et al. Exp Neurol. 2024 Oct.

Abstract

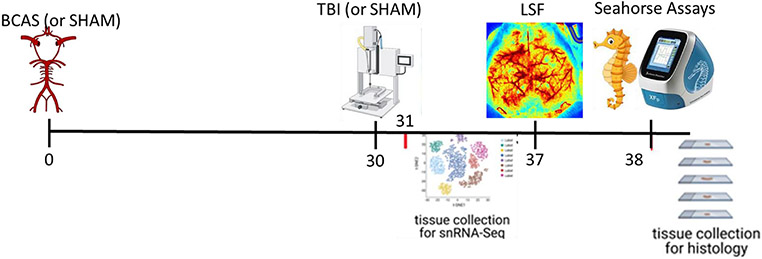
Traumatic brain injuries are extremely common, and although most patients recover from their injuries many TBI patients suffer prolonged symptoms and remain at a higher risk for developing cardiovascular disease and neurodegeneration. Moreover, it remains challenging to identify predictors of poor long-term outcomes. Here, we tested the hypothesis that preexisting cerebrovascular impairment exacerbates metabolic and vascular dysfunction and leads to worse outcomes after TBI. Male mice underwent a mild surgical reduction in cerebral blood flow using a model of bilateral carotid artery stenosis (BCAS) wherein steel microcoils were implanted around the carotid arteries. Then, 30 days post coil implantation, mice underwent TBI or sham surgery. Gene expression profiles, cerebral blood flow, metabolic function, oxidative damage, vascular health and angiogenesis were assessed. Single nuclei RNA sequencing of endothelial cells isolated from mice after TBI showed differential gene expression profiles after TBI and BCAS, that were further altered when mice underwent both challenges. TBI but not BCAS increased mitochondrial oxidative metabolism. Both BCAS and TBI decreased cerebrovascular responses to repeated whisker stimulation. BCAS induced oxidative damage and inflammation in the vasculature as well as loss of vascular density, and reduced the numbers of angiogenic tip cells. Finally, intravascular protein accumulation was increased among mice that experienced both BCAS and TBI. Overall, our findings reveal that a prior vascular impairment significantly alters the profile of vascular health and function of the cerebrovasculature, and when combined with TBI may result in worsened outcomes.

Keywords: Cerebrovasculature; Metabolism; Mice; TBI; Vascular health.


Conflict of interest statement

Declaration of competing interest None.

Figures

Fig 1.
Fig 1.. Timeline of experimental procedures:
BCAS procedure is induced on Day 0, with 30 days allowed for recovery. TBI is induced on Day 30. One cohort of tissue is collected on day 31, 24 hours post-TBI. Another cohort underwent laser speckle flowmetry (LSF) one week after injury (Day 37) before having tissue collected on day 38 for Seahorse Metabolic Assays. The final cohort underwent BCAS surgery and/or TBI surgery before having tissue collected on Day 38 for immunohistochemical analyses.
Figure 2.
Figure 2.. Hypoperfusion and TBI significantly alter endothelial gene expression profiles:
Representative gene ontology terms generated from differentially expressed genes in endothelial nuclei. Eight lists of genes were generated (up- and down-regulated expressed genes comparing BCAS to Sham, TBI to Sham, BCAS-TBI to Sham, and BCAS-TBI to TBI) and representative gene ontology terms for each comparison are plotted in a heat map (red significantly upregulated and blue significantly down regulated) (A). Upset plot showing gene intersections among the eight gene lists (B).
Figure 3.
Figure 3.. Cerebral blood flow responses to whisker stimulation are dynamically altered after injury.
Representative images with highlighted region of interest in left barrel cortex (LB) without stimulation (left panel) and with whisker stimulation (right panel) (A). Sample timeline of flux for left barrel cortex (Stimulation 1 = 2:30-3:00, Stimulation 2 = 5:30-6:00, Stimulation3 = 8:30-9:00, highlighted in red. Baseline measurements highlighted at 4:00-4:30 in blue) (B). Baseline CBF (C). Non-invasive mean arterial blood pressure measurements (D). Whisker stimulation-induced changes in CBF normalized to baseline (E), Ratio of CBF response to stimulations 1 and 3 (F); p<0.05 vs control animals, means (+/− SEM).
Figure 4.
Figure 4.. Glycolysis is not significantly altered after injury or hypoperfusion.
Raw extracellular acidification rate (ECAR) data (A), non-glycolytic acid production (B), mean glycolysis (C), glycolytic capacity (D), glycolytic reserve (E) percent glycolytic reserve (F), and acute respiration (G). p>0.05 vs control animals, means (+/− SEM).
Figure 5.
Figure 5.. Mitochondrial respiration is increased after injury but not hypoperfusion.
TBI increased the raw oxygen consumption rates (OCR) (A); basal respiration (B), proton leak (C), maximum respiration (D), and spare respiratory capacity (E), but there were no BCAS or TBI effects on non-mitochondrial respiration (F) or ATP production (G). P<0.05 vs control animals, means (+/− SEM).
Figure 6.
Figure 6.. BCAS but not TBI increases oxidative damage in cerebral blood vessels.
Intensity of 4-hydroxynonenal (green) staining colocalized with tomato lectin (purple). Representative images of Control (A), TBI (B), BCAS (C), and BCAS-TBI (D) mice, with quantification of mean pixel intensity (E). p<0.05 vs control animals, means (+/− SEM).
Figure 7.
Figure 7.. BCAS but not TBI induces systemic inflammation with increased TNFα over time.
MSD immunoassay plate measured protein levels of TNFα at 7 Days post-injury (A) and 30 Days post-injury (B). p<0.05 vs control animals, means (+/− SEM).
Figure 8.
Figure 8.. BCAS but not TBI reduces vascular density.
Vascular density as assessed by proportional area measurements of tomato-lectin-stained vessels (red) in: corpus callosum (A-D) and CA1 of the hippocampus (F-I), with quantification of staining in corpus callosum (E) and CA1 (J) . A/F = Control, B/G= TBI, C/H= BCAS, D/I= BCAS-TBI. p<0.05 vs control animals, means (+/− SEM).
Figure 9.
Figure 9.. BCAS but not TBI reduces endothelial tip cell presence.
CD34 staining (green) against tomato-lectin-stained vessels (red) in the motor cortex (A-D), with quantification of proportional area of combined regions (E). p<0.05 vs control animals, means (+/− SEM).
Figure 10.
Figure 10.. TBI in BCAS mice promotes intraluminal protein aggregation.
Persistent blood vessel accumulation of fibrinogen and IgG in the CA1 field of the hippocampus (A-D), and cortex (E-H) in BCAS-TBI mice but not BCAS or TBI alone. A/E = Control, B/F= TBI, C/H= BCAS, D/H= BCAS-TBI. Qualitative scoring of fibrin(ogen) (I) or IgG (J) accumulation, p<0.05 vs control animals, means (+/− SEM).

References

    1. Angleys H, Ostergaard L & Jespersen SN (2015) The effects of capillary transit time heterogeneity (CTH) on brain oxygenation. J Cereb Blood Flow Metab, 35, 806–817. - PMC - PubMed
    1. Bowman CE, Scafidi J & Scafidi S (2019) Metabolic perturbations after pediatric TBI: It's not just about glucose. Exp Neurol, 316, 74–84. - PMC - PubMed
    1. Cao Y, Wang X & Peng G (2020) SCSA: A Cell Type Annotation Tool for Single-Cell RNA-seq Data. Front Genet, 11, 490. - PMC - PubMed
    1. Du W, Ren L, Hamblin MH & Fan Y (2021) Endothelial Cell Glucose Metabolism and Angiogenesis. Biomedicines, 9. - PMC - PubMed
    1. Freitas-Andrade M, Raman-Nair J & Lacoste B (2020) Structural and Functional Remodeling of the Brain Vasculature Following Stroke. Front Physiol, 11, 948. - PMC - PubMed

MeSH terms

LinkOut - more resources