. 2024 Aug 5;7(10):e202402702.
doi: 10.26508/lsa.202402702. Print 2024 Oct.

Chaperone BiP controls ER stress sensor Ire1 through interactions with its oligomers

Affiliations

Chaperone BiP controls ER stress sensor Ire1 through interactions with its oligomers

Sam Dawes et al. Life Sci Alliance. .

Abstract

The complex multistep activation cascade of Ire1 involves changes in the Ire1 conformation and oligomeric state. Ire1 activation enhances ER folding capacity, in part by overexpressing the ER Hsp70 molecular chaperone BiP; in turn, BiP provides tight negative control of Ire1 activation. This study demonstrates that BiP regulates Ire1 activation through a direct interaction with Ire1 oligomers. Particularly, we demonstrated that the binding of Ire1 luminal domain (LD) to unfolded protein substrates not only trigger conformational changes in Ire1-LD that favour the formation of Ire1-LD oligomers but also exposes BiP binding motifs, enabling the molecular chaperone BiP to directly bind to Ire1-LD in an ATP-dependent manner. These transient interactions between BiP and two short motifs in the disordered region of Ire1-LD are reminiscent of interactions between clathrin and another Hsp70, cytoplasmic Hsc70. BiP binding to substrate-bound Ire1-LD oligomers enables unfolded protein substrates and BiP to synergistically and dynamically control Ire1-LD oligomerisation, helping to return Ire1 to its deactivated state when an ER stress response is no longer required.


Conflict of interest statement

The authors declare that they have no conflict of interest.

Figures

Figure 1.
Figure 1.. Ire1-LD binding to unfolded protein substrate results in its oligomerization.
(A) The oligomerization state of apo Ire1-LD monitored by MST and SEC. The fraction of monomeric Ire1-LD as a function of the Ire1-LD concentration was plotted using normalized MST (empty squares, Fig S1) and SEC (red circles, Fig S2) data. The black line represents the best fit of MST data (with the apparent dimerization constant K1/2 of 0.5 ± 0.17 μM). Error bars indicate ±SE for three replicate experiments. (B) The oligomerization of 5 μM Ire1-LD in the absence (in black) and in the presence (in green) of the 10 μM ΔEspP monitored by DLS (regularisation plots are shown). The monomeric peak from the dimerization-deficient D123P variant (12) of Ire1-LD is shown in grey. (C) Formation of large insoluble Ire1-LD oligomers monitored by the solubility assay; the experiments were performed for 20 μM Ire1-LD in the presence of the different (0–128 μM) concentrations of ΔEspP. (D) TEM image of elongated Ire1-LD oligomers obtained in the presence of 128 μM ΔEspP (same as for Fig 1C, dark green).
Figure S1.
Figure S1.. The oligomeric state of apo WT Ire1-LD and its D123P variant monitored by microscale thermophoresis.
Microscale thermophoresis traces were obtained from 0.5 μM FITC-labelled Ire1-LD titrated with unlabelled Ire1-LD. Either WT Ire1-LD or the dimerization-deficient D123P variant (12) was used for these measurements. Only WT Ire1-LD titration by WT Ire1-LD shows the dimerization pattern (black). As expected, the titration of D123P variant by either the D123P variant (blue) or WT Ire1-LD (red) results in no dimerization. Error bars indicate ±SE for three replicate experiments.
Figure S2.
Figure S2.. The oligomeric state of apo WT Ire1-LD and its D123P variant monitored by size exclusion chromatography.
(A, B) Size exclusion chromatograph elution profiles of WT Ire1-LD (A) and the dimerization-deficient D123P variant (12) (B) at different protein concentrations (from 7.5 to 60 μM, coloured as annotated); the fraction of monomeric Ire1-LD for Fig 1A was calculated from the peak position at the corresponding concentration of Ire1-LD. For calculations of peak positions, we assumed that the D123P variant is monomeric at these concentrations.
Figure S3.
Figure S3.. The oligomeric state of apo WT Ire1-LD monitored by native mass spectrometry.
Native MS of 5 μM Ire1-LD showing the presence of monomers (highlighted in red, Mw is 49,658.65±1.17), dimers (highlighted in black, Mw is 99,320±1.68) and tetramers (highlighted in blue, Mw is 198,796.66±11.01). The sample was sprayed from 100 mM ammonium acetate at pH 6.8.
Figure S4.
Figure S4.. Formation of insoluble Ire1-LD oligomers in the presence of the high-affinity ΔEspP substrate.
(A) The turbidity measurements of 20 μM Ire1-LD in the presence of ΔEspP at different (0–128 μM) concentrations. Error bars represent standard deviations for replicate experiments. (B) The amount of insoluble Ire1-LD as a function of ΔEspP measured by the solubility assay. The amount of insoluble Ire1-LD was calculated as the total Ire1-LD concentration (20 μM) minus the amount of soluble Ire1-LD measured by the Bradford assay. (C) The calibration curve (27) of the amount of insoluble Ire1-LD oligomers versus OD at 400 nm for the corresponding ΔEspP concentration. (A, C, D) The amount of aggregated protein over time calculated from (A) using the calibration curve from (C) as a function of time. (A, B) The fraction of insoluble Ire1-LD oligomers as a function of ΔEspP concentration was calculated as described by Borgia et al (27) using the turbidity measurements at different ΔEspP concentrations (A) and the amount of insoluble protein (B) as a function of ΔEspP.
Figure S5.
Figure S5.. Substrate-induced oligomerisation of Ire1-LD monitored by fluorescence polarisation.
(A) The fluorescence polarisation assay to measure ΔEspP-dependent oligomerisation of Ire1-LD. 50 nM FITC-labelled Ire1-LD was incubated with increasing concentrations of ΔEspP for 30 min; the apparent constant for this peptide-dependent oligomerisation is 20.6 ± 1.13 μM. Error bars indicate ±SE for three replicate experiments. (B) The fraction of insoluble Ire1-LD oligomers obtained from the turbidity measurements (Fig S4D). Error bars indicate ±SE for three replicate experiments. (A) The apparent constant for this ΔEspP-dependent formation of insoluble oligomers is 30.5 ± 5 μM, in good agreement with K1/2 of formation of soluble oligomers obtained from fluorescence polarisation assay (A).
Figure S6.
Figure S6.. Formation of insoluble Ire1-LD oligomers in the presence of the low-affinity MPZ1 substrate.
The turbidity measurements of 20 μM Ire1-LD in the presence of MPZ1 at different (0–359 μM, annotated) concentrations. Only the highest (359 μM) concentrations of MPZ1 promoted the formation of insoluble Ire1-LD oligomers. Error bars represent standard deviations for replicate experiments.
Figure S7.
Figure S7.. Perturbations in the dimerization and oligomerisation interfaces significantly disturb the formation of insoluble Ire1-LD oligomers.
(A, B) Turbidity measurements of D123P (A) and 359WLLI362 to GSSG (B) variants of Ire1-LD in the presence of ΔEspP at different concentrations. Error bars represent standard deviations for replicate experiments. (C) The fraction of insoluble Ire1-LD and its variants (calculated from turbidity assay as described in Fig S4C and D) versus ΔEspP concentration. For both variants, the formation of insoluble oligomers was observed at significantly higher peptide concentrations as compared with the WT Ire1-LD, demonstrating that perturbation of Ire1-LD dimerization (in the D123P variant) and formation of soluble oligomers (in the 358WLLI362 to GSSG variant) significantly affect the formation of insoluble Ire1-LD oligomers.
Figure S8.
Figure S8.. The building blocks of Ire1-LD insoluble oligomers are folded Ire1-LD dimers.
(A) 1H-15N 2D correlation ssNMR spectra of insoluble Ire1-LD oligomers formed in the presence of the ΔEspP recorded using cross-polarisation (CP, red) and INEPT (black) based 1H-15N polarisation transfer. The INEPT-based spectrum (black) contains very few peaks, suggesting that the oligomers contain only few long-disordered regions with high mobility on the fast timescales and that most of the protein is immobilised; furthermore, the CP spectrum (red) has a good dispersion of 1H peaks, indicative of a folded protein conformation. (B) A plausible model structure of Ire1-LD oligomers based on the AlphaFold model of human Ire1α-LD (AF-A0A7P0TAB0, only residues 24–365 are shown); the model was built in PyMol using the dimerization and oligomerization interfaces previously suggested by (12, 13). (C) A representative TEM image of insoluble Ire1-LD oligomers formed in the presence of the ΔEspP peptide (same as in (A)), demonstrating that the diameter of the elongated oligomers is consistent with the diameter of the Ire1-LD dimer in the model structure (from (B)).
Figure 2.
Figure 2.. BiP interacts with Ire1-LD oligomers in a chaperone-like manner.
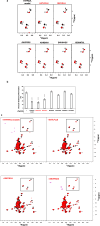
(A) BiP reduces the size of soluble oligomers. The DLS measurements were performed using 5 μM Ire1-LD in the presence of 10 μM ΔEspP and in the absence (black, same as for Fig 1B) and presence (red) of 5 μM BiP.ATP. (B) BiP solubilises large insoluble Ire1-LD oligomers as monitored by the solubility assay. The solubility assay was performed on 20 μM Ire1-LD in the absence and presence of 170 μM ΔEspP. Error bars represent standard deviations. At these concentrations, the peptide induces the formation of insoluble Ire1-LD oligomers, whereas adding BiP and ATP results in solubilisation of these oligomers (left, red). Sub-stoichiometric BiP concentrations are sufficient to solubilised insoluble Ire1-LD oligomers (left, pink); no de-oligomerisation occurs in the absence of ATP (left, grey) or in the presence of chaperone-inactive variants of BiP, which compromise ATPase activity (T229G (29)) and substrate binding (V461F (30)) (middle), suggesting that BiP disturbs Ire1-LD oligomerisation in a chaperone-like manner. Moreover, BiP does not affect misfolded Ire1-LD aggregates obtained by heat denaturation (right). (C) In the absence of ATP, BiP co-precipitates with Ire1-LD insoluble oligomers. The SDS–PAGE gel shows the soluble and insoluble fractions of Ire1-LD ΔEspP samples in the presence and in the absence of 20 μM BiP in the absence and presence of ATP. (D) The addition of ATP results in BiP dissociation from Ire1-LD insoluble oligomers and their solubilisation. The SDS–PAGE gel shows the soluble and insoluble fractions of Ire1-LD ΔEspP samples in the presence 20 μM BiP at different times (15–180 min) after the addition of 40 mM ATP. 20 μM Ire1-LD was incubated with 170 μM ΔEspP for 3 h before the addition of ATP.
Figure S9.
Figure S9.. The size of Ire1-LD oligomers characterized by flow-induced dispersion analysis.
(A) Representative taylograms for samples containing 10 μM of Ire1-LD and 1 μM ΔEspP in the presence and absence of BiP and ATP. The 1:10 ΔEspP:Ire1-LD ratio was used to achieve a good signal-to-noise ratio but avoid the formation of insoluble oligomers during the experiments. (B) The apparent hydrodynamic radius of Ire1-LD oligomers in the absence and presence of BiP. Sub-stoichiometric concentrations of BiP (1:10 [1 μM BiP] and 1:100 [0.1 μM BiP] in red and pink, respectively) were sufficient to reduce the size of Ire1-LD oligomers. Error bars indicate ±SE for at least three replicate experiments.
Figure S10.
Figure S10.. BiP does not form a stable complex with small Ire1-LD oligomers.
The isoleucine region of methyl-TROSY spectra of ATP-/ADP-bound and apo full-length U{2H,12C}, Ile-Cδ1-13CH3 WT BiP (in black) overlaid with the spectra of corresponding nucleotide-bound state of BiP in the presence of 50 μM Ire1-LD and 100 μM ΔEsp (in red). Ire1-LD was preincubated with BiP and if required 40 mM ATP for 1 h and the spectra were recorded immediately after the addition of ΔEsp to monitor BiP interactions with NMR-visible Ire1-LD species (by monitoring changes in peak positions and peak intensities upon interactions). Because of ATP hydrolysis during the experiments, peaks for both ATP- and ADP-bound BiP are present. Within experimental time (ca. 30 min), no significant changes in peak intensities/positions were observed. The absence of any changes in the BiP spectra demonstrates that either ATP-bound or unbound BiP do not interact with either soluble Ire1 species or ΔEsp. In the absence of ATP, after incubations for longer than 1 h, BiP peaks in NMR spectra gradually decreased because of BiP interactions with insoluble Ire1-LD.ΔEsp oligomers.
Figure 3.
Figure 3.. BiP binds to two distinct disordered motifs in Ire1-LD.
(A) Two Ire1-derived peptides result in substrate-like perturbations in the BiP conformational landscape: The representative region of the methyl-TROSY spectra of ATP-bound full-length U{2H,12C}, Ile-Cδ1-13CH3 BiP* T229G in the absence (black) and the presence of 7 aa peptides (red): the model BiP substrate HTFPAVL (left) and two Ire1-derived BiP-binding peptides GSTLPLLE (middle) and RNYWLLI (right). No changes in spectra were observed in the presence of the other Ire1-derived peptides (Fig S11). (B) The GSTLPLLE and RNYWLLI peptides result in the substrate-like stimulation of the ATPase activity in BiP. The ATPase activity of 1 μM BiP* was measured in the absence of any substrate and the presence of 1 mM of either the model BiP substrate HTFPAVL or either GSTLPLLE and RNYWLLI peptide. Error bars represent standard deviations. The asterisk (*) represents the P-value of the statistical test. *P < 0.05, **P < 0.001.
Figure S11.
Figure S11.. NMR identification of BiP binders.
(A) The representative isoleucine region of methyl-TROSY spectra of ATP-bound full-length BiP* T229G in the presence of the model substrate HTFPAVL (1 mM) and Ire1-derived binders: 50 μM GSTLPLL, 50 μM RNYWLLI, or Ire1-derived non-binders: 1 mM AVVPRGS, 1 mM KHRENVI, 1 mM ENVIPADS, or 1 mM KDMATIIL (Table S1). (C) The full spectra are shown in (C). Binding to the substrate (either HTFPAVL, GSTLPLL, or RNYWLLI) stabilizes the domain-undocked conformation of BiP as monitored by a decrease in the intensities of peaks, corresponding to the domain-docked conformation and an increase in intensities of peaks corresponding to the domain-undocked conformation (33). (A, B) Bar chart showing the percentage of domain-docked conformation for the three representative doublet peaks from (A), calculated as described previously (33). Error bars indicate ± SE for three doubles. The asterisk (*) represents the P-value of the statistical test. ***P < 0.0001. (C) The full methyl-TROSY spectra of ATP-bound full-length BiP* T229G in the presence of the model substrate HTFPAVL (1 mM), Ire1-derived binders: 50 μM 310GSTLPLL316, 50 μM 356RNYWLLI362, or Ire1-derived non-binder: 1 mM 388ENVIPADS395 (the other three non-binders have identical spectra). (A) The boxes highlight the regions shown in (A).
Figure S12.
Figure S12.. Perturbations in either BiP binding motif are insufficient to prevent substrate-induced oligomerization and BiP-dependent de-oligomerization.
The SDS–PAGE analysis of de-oligomerization of WT Ire1-LD and its 315LL316 to DA and 359WLLI362 to GSSG variants (annotated) in the presence and the absence of BiP and ATP. 30 μM Ire1-LD were incubated 400 μM ΔEspP for 3 h; if required 3 μM BiP and 40 mM ATP were added to the reaction and incubated for another 3 h, after which soluble and insoluble fractions were collected. The addition of 400 μM ΔEspP results in the formation of insoluble oligomers for WT Ire1-LD and the variants, which partially de-oligomerized in the presence of BiP and ATP.
Figure S13.
Figure S13.. The sequence conservation of Ire1-LD.
(A) Consurf (35, 36) conservation scores across the Ire1-LD amino acid sequence. The human Ire1 sequence (UniProt ID O75460) was used as an input sequence for the analysis, resulting in 124 HMMER-identified homologues with a minimal percentage identity between homologues of 30%. (B) Simplified circular graph of the phylogenetic tree constructed by the Consurf (35, 36) and visualized by iTOL (37); Ire1α or Ire1β sub-family members (6) are highlighted by red and blue colours, respectively.
Figure S14.
Figure S14.. The effect of C-terminal truncations on Ire1-LD expression and solubility.
The SDS–PAGE analysis of the E. coli expression of WT Ire1-LD (residues 24–449, left) and its truncated variants. (A, B) The proteins were expressed at 37oC (A) and 20oC (B). For the variant that consists of residues 24–390 (middle), the entire juxtamembrane region (residues 391–449) was truncated. The variant that consists of residues 24–356 (right) also lacks the significant part of the oligomerization interface, including the highly conserved 363GHH365 β-strand. The whole cell E. coli lysate, along with its soluble and insoluble fractions, are shown. Truncation of the juxtamembrane region led to a slight increase in the amount of the insoluble protein when the protein was expressed at 37°C. However, at lower temperature (at 20°C), the 24–390 variant is predominantly soluble. In contrast, the truncation of the 363GHH365 β-strand significantly impacted Ire1-LD solubility at both temperatures.
Figure S15.
Figure S15.. Dynamic properties of the Ire1-LD C-terminal region.
(A) The amide 2D spectrum of WT Ire1-LD (black) overlaid with the spectrum of the core Ire1-LD (residues 24–390) that lacks the C-terminal region391-449 but contains BiP-binding motifs (green). For the core Ire1-LD construct, only 24 amide peaks (from ca. 300 and 90 expected for the folded Ire1-LD and flexible region 301–390) were visible in the 2D spectrum. (B) In full agreement with previous observations (13), the lack of peaks for most of the core Ire1-LD and low peak intensities of the visible 24 peaks (also in (B)) suggest that the entire core region, including residues 301–390, is affected by μs-ms conformational dynamics. Consequently, the flexible region comprising residues 301–390 is predominantly “NMR invisible,” suggesting direct communication between residues 301–390 and the folded part of Ire1-LD. (B) In contrast, most residues from the region that comprises residues 391–449 are present in the NMR spectrum (57 peaks from 59 expected), and the peaks from this region have significantly higher intensities (also in (B)), suggesting that residues 391–449 are not significantly affected by the μs-ms process in the core and, thus, do not directly communicate with the folded part of Ire1-LD. (B) Peak intensities (calculated as a corresponding peak height divided by the noise level) for individual peaks in the amide 2D spectrum of WT Ire1-LD ((A), black). The visible peaks were separated into two groups: (i) peak from flexible regions located in the core Ire1-LD (green) and (ii) peaks from the flexible region comprising residues 391–449 (black). Most (>85%) of the peaks for residues 391–449 have peak intensities larger than 10 (S/N), whereas most (>80%) of the peaks from disordered core regions (residues <390) have peak intensity smaller than 10 (S/N). Significantly higher peak intensities for the residues 391–449 suggest that this region is largely independent of folded Ire1-LD and, thus, significantly less affected by its μs-ms conformational dynamics. (C) Amide temperature gradients (ppb/K) calculated from chemical shifts obtained from the amide spectra of WT Ire1-LD recorded at 5, 10, 15, 20, and 25°C using linear regression. All residues with temperature gradients that occur within the threshold of −3.6 ppb/K were considered to adopt no secondary structure (38). The temperature gradients were plotted separately for the C-terminal region 391–449 and the core region (residues <390). (A) With low proton dispersions observed in the amide spectrum (A), characteristic amide temperature gradients for these peaks indicate that only disordered regions of Ire1-LD are NMR visible, whereas the folded part of Ire1-LD is NMR invisible.
Figure S16.
Figure S16.. Conformational properties of the Ire1-LD C-terminal region.
(Top) Secondary structure elements observed in the high-resolution X-ray structures of Ire1-LD (PDB IDs 2HZ6 (12) and 6SHC (18)). The 306VVP308 and 363GHH365 β-strands observed in both structures are shown in blue; whereas the α-helix adjacent to 363GHH365 (pink) is only formed in the 6SHC structure. The residues that wee unresolved in the X-ray structures are shown in yellow; grey shows the residues that were truncated from the X-ray constructs. (Bottom) Predictions of disordered regions by several prediction algorithms, including IUPred (39), ESpritz (40), DISOPRED3 (41), MoreRONN (42), PONDR (43), and MobiDP lite (44, 45). Predicted regions of disorder are shown in yellow; the rest is coloured in white. The analysis revealed that the juxtamembrane region (residues 390–449) has classical characteristics of an IDR as most of this region is predicted to be disordered by all algorithms. In contrast, all algorithms failed to predict conformational disorder for most residues 301–390.
Figure 4.
Figure 4.. Conformational rearrangements in the C-terminal oligomerisation subdomain of Ire1-LD.
(A) Three representative AlphaFold models of Ire1 luminal domain are shown, depicting the region corresponding to residues 24–365 in human Ire1, to illustrate three distinct conformations of the C-terminal subdomain of Ire1-LD. The oligomerization interface is shaded in grey for clarity; the β-strands 306VVP308 and 333VIT335 (as in human Ire1) are highlighted in orange; the 363GHH365 β-strand is highlighted in yellow; the adjacent β-hairpin (residues 281–300) is shown in red; two BiP binding sites, 310GSTLPLL316 and 356RNYWLLI362 in human Ire1, are depicted in cyan and labelled. The dimerization interface, as suggested previously (12, 13) is annotated. The AlphaFold structures used for this comparison are AF-A8JR46 (Drosophila melanogaster, left), AF-A0A7P0TAB0 (Homo sapiens, middle), and AF-A0A668SMD8 (Oreochromis aureus, right). The cartoons at the bottom represent three different conformations of the oligomerization subdomain. (B) The oligomerization interface of Ire1-LD is highly conserved, as evidenced by Consurf conservation scores. Briefly, a total of 124 unique sequences, including Ire1α and Ire1β paralogues from metazoans (6) (Fig S13), were selected and analysed using the ConSurf server. The highest conservation scores were observed for β-strands 306VVP308, 333VIT335, and 363GHH365, and the adjacent β-hairpin (highlighted by the same colours as in (A)). (A, B, C) Sequence conservation logos for the BiP binding motifs 310GSTLPLLE317 and 356RNYWLLI362 are shown in cyan as in (A, B). The paralogue-specific amino acid conservation, representing amino acid types found exclusively in the Ire1α and Ire1β paralogues (6), is denoted in red (Ire1α) and blue (Ire1β); amino acid types found in the same position across the entire family without paralogue-specific conservations are represented in black. The conservation level, as calculated in iTOL (37), is indicated by the height of the symbols representing amino acid types with the one-letter code used for representation.
Figure 5.
Figure 5.. Multivalent regulation of Ire1 activity by molecular chaperone BiP.
(i) In the absence of stress Ire1-LD co-exists in an equilibrium between inactive monomers and dimers. With the assistance of its co-chaperone ERdj4, BiP binds to Ire1-LD dimers, favouring monomers (15, 18). (ii) Accumulation of unfolded proteins results in BiP dissociation from the Ire1-LD (15, 18), enabling Ire1 dimerization. In addition, unfolded proteins bind to the Ire1-LD dimers, resulting in conformational changes in the Ire1-LD oligomerization interface (yellow) (13). (iii) Conformational changes at the oligomerization interface result in Ire1-LD oligomerization and consequent activation of Ire1 cytoplasmic domain, which leads to overexpression of ER protein quality control enzymes, including the molecular chaperone BiP (5, 17). (iv) The same stress-induced conformational changes in Ire1-LD enable BiP interactions near the oligomerization interface and, thus, provide additional control for the Ire1-LD activation process. Upon reduction in stress level, when the chaperone becomes available, BiP transiently “bites” the oligomerization interface of Ire1-LD, destabilizing Ire1 oligomers and, thus, facilitating Ire1 deactivation.
Figure S17.
Figure S17.. BiP solubilises insoluble Ire1-LD oligomer in the presence of 1–40 mM ATP.
(A) The SDS–PAGE analysis of de-oligomerization of WT Ire1-LD in the presence and absence of BiP and different concentrations of ATP. 20 μM Ire1-LD was incubated 0 and 200 μM ΔEspP for 3 h. If required 2 μM BiP and 0, 1, 10, or 40 mM ATP were added to the reaction and incubated for another 30 min, after which soluble and insoluble fractions were collected. 10 μM lysozyme (band around 14 kD) was added to each reaction as a loading control. (A, B) The fraction of soluble Ire1-LD (same conditions as for (A)) monitored by the solubility assay.

References

    1. Wiseman RL, Mesgarzadeh JS, Hendershot LM (2022) Reshaping endoplasmic reticulum quality control through the unfolded protein response. Mol Cell 82: 1477–1491. 10.1016/j.molcel.2022.03.025 - DOI - PMC - PubMed
    1. Radanovic T, Ernst R (2021) The unfolded protein response as a guardian of the secretory pathway. Cells 10: 2965. 10.3390/cells10112965 - DOI - PMC - PubMed
    1. Hetz C, Zhang K, Kaufman RJ (2020) Mechanisms, regulation and functions of the unfolded protein response. Nat Rev Mol Cell Biol 21: 421–438. 10.1038/s41580-020-0250-z - DOI - PMC - PubMed
    1. Gardner BM, Pincus D, Gotthardt K, Gallagher CM, Walter P (2013) Endoplasmic reticulum stress sensing in the unfolded protein response. Cold Spring Harb Perspect Biol 5: a013169. 10.1101/cshperspect.a013169 - DOI - PMC - PubMed
    1. Walter P, Ron D (2011) The unfolded protein response: From stress pathway to homeostatic regulation. Science 334: 1081–1086. 10.1126/science.1209038 - DOI - PubMed

MeSH terms