. 2024 Aug 5;15(1):6648.
doi: 10.1038/s41467-024-50411-z.

Multiplexed volumetric CLEM enabled by scFvs provides insights into the cytology of cerebellar cortex

Affiliations

Multiplexed volumetric CLEM enabled by scFvs provides insights into the cytology of cerebellar cortex

Xiaomeng Han et al. Nat Commun. .

Abstract

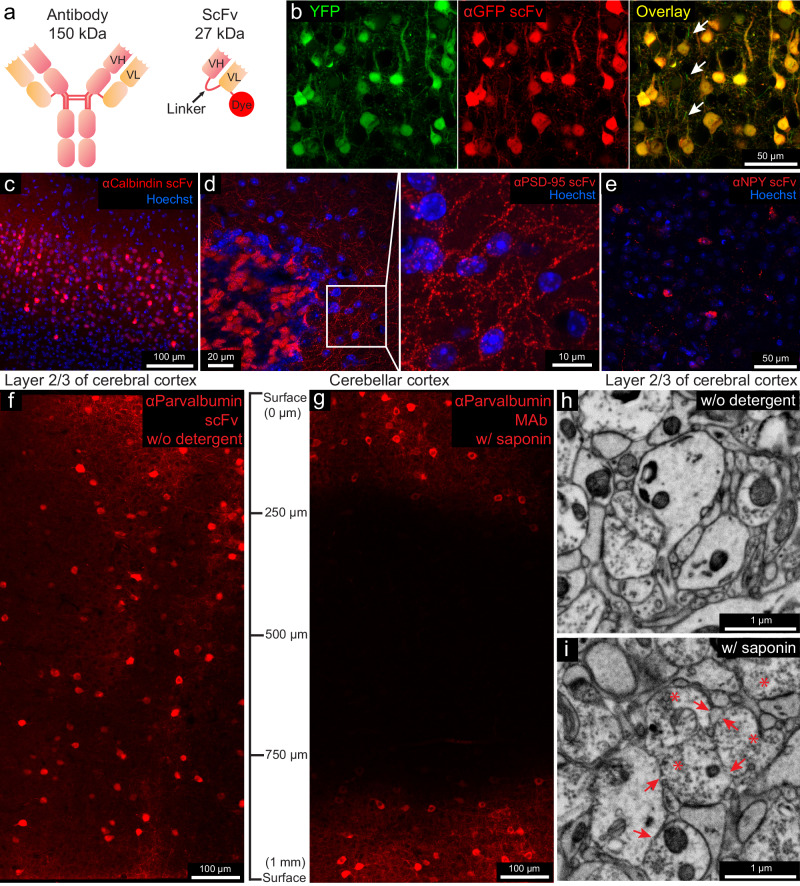
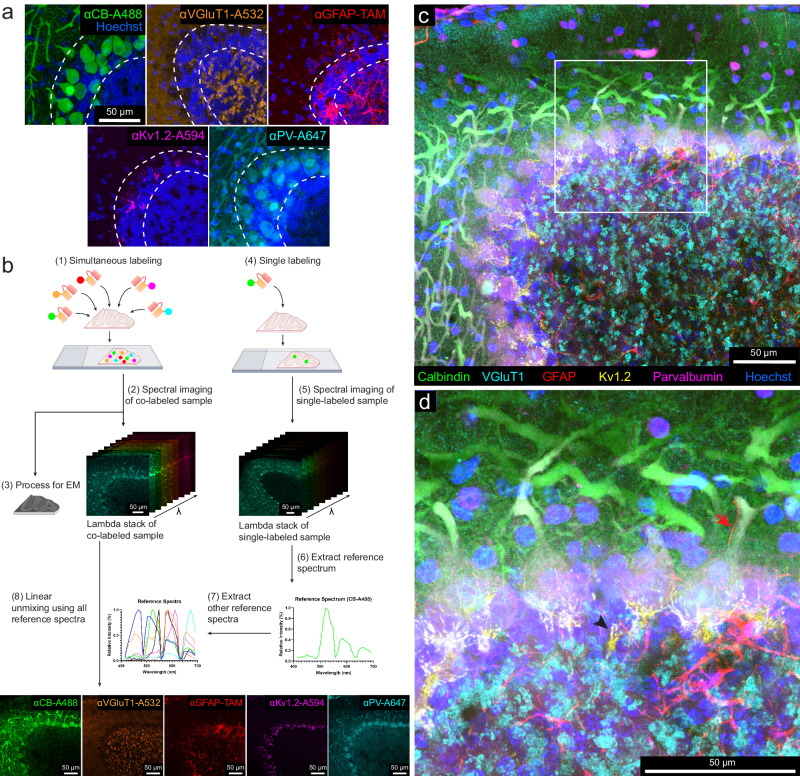
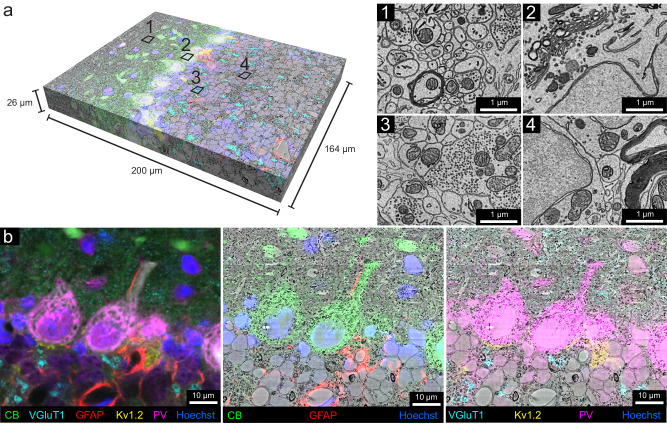
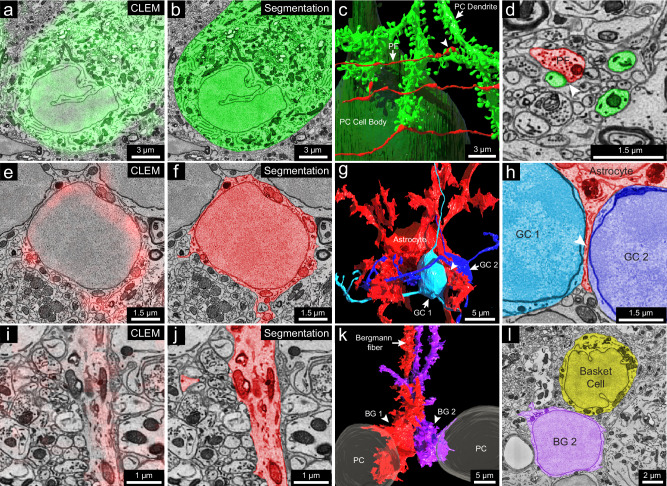
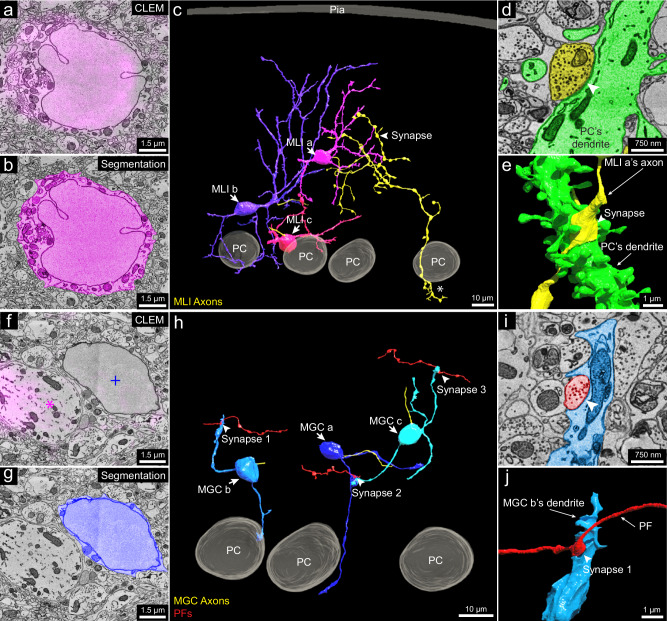
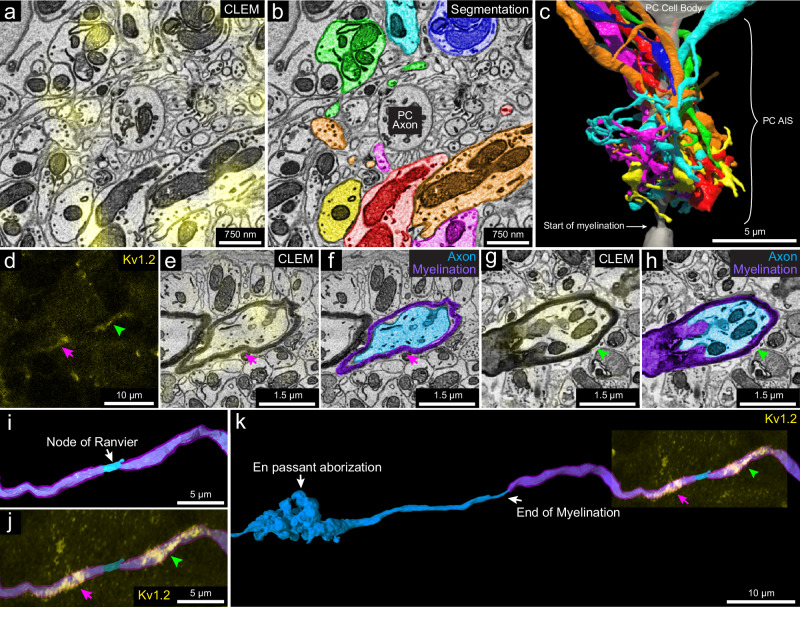
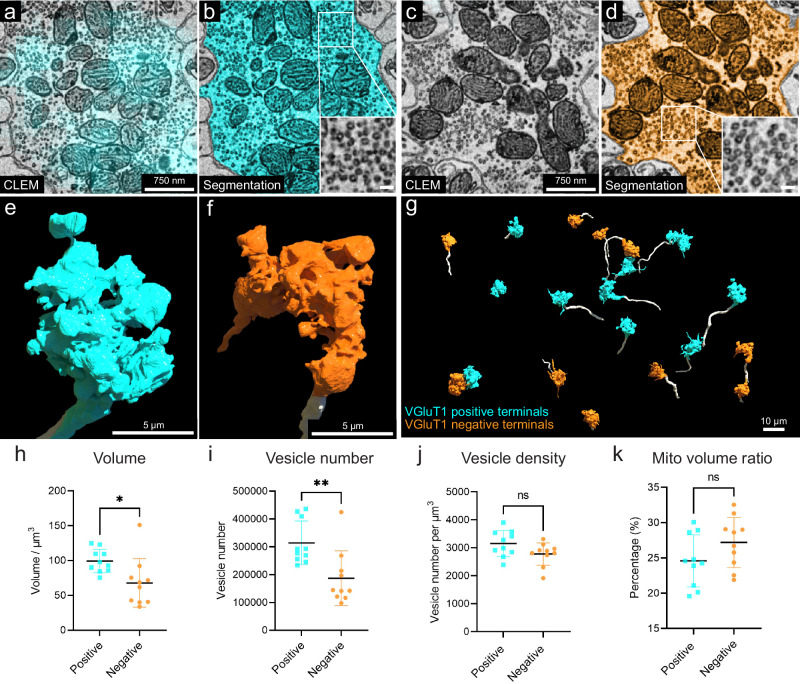
Mapping neuronal networks is a central focus in neuroscience. While volume electron microscopy (vEM) can reveal the fine structure of neuronal networks (connectomics), it does not provide molecular information to identify cell types or functions. We developed an approach that uses fluorescent single-chain variable fragments (scFvs) to perform multiplexed detergent-free immunolabeling and volumetric-correlated-light-and-electron-microscopy on the same sample. We generated eight fluorescent scFvs targeting brain markers. Six fluorescent probes were imaged in the cerebellum of a female mouse, using confocal microscopy with spectral unmixing, followed by vEM of the same sample. The results provide excellent ultrastructure superimposed with multiple fluorescence channels. Using this approach, we documented a poorly described cell type, two types of mossy fiber terminals, and the subcellular localization of one type of ion channel. Because scFvs can be derived from existing monoclonal antibodies, hundreds of such probes can be generated to enable molecular overlays for connectomic studies.


Conflict of interest statement

The authors declare no competing interests.

Figures

Fig. 1
Fig. 1. Fluorescent scFv probes label brain tissues without detergents, preserving electron microscopy ultrastructure.
a Schematic of a full-length IgG antibody and an scFv probe with a fluorescent dye. b Confocal images from the cerebral cortex of a YFP-H mouse labeled with a GFP-specific scFv probe conjugated with 5-TAMRA (n = 3 experiments, all experiments mentioned refer to independent experiments). Arrows indicate unlabeled thinner neuronal processes. c Layer 2/3 of the cerebral cortex labeled with a calbindin-specific scFv probe (n = 3 experiments). d Cerebellar cortex labeled with PSD-95-specific scFv (n = 3 experiments), with an enlarged inset. e Cerebral cortex labeled with an NPY-specific scFv (n = 3 experiments). f, g Penetration depth comparison of a parvalbumin-specific scFv without detergent versus parental mAbs with 0.05% saponin (n = 2 experiments). h, i Ultrastructure comparison after 7 days incubation without detergent versus 0.05% saponin (n = 2 experiments). Arrows indicate membrane breaks; asterisks indicate abnormal vesicle-filled axonal terminals.
Fig. 2
Fig. 2. Multicolor immunofluorescence enabled by scFv probes and linear unmixing of confocal micrographs.
a Representative confocal images (n = 3 experiments in each category) of different sections from the cerebellum labeled with: a calbindin-specific scFv probe conjugated with Alexa Fluor 488, a VGluT1-specific scFv probe conjugated with Alexa Fluor 532, a GFAP-specific scFv probe conjugated with 5-TAMRA, a Kv1.2-specific scFv probe conjugated with Alexa Fluor 594, and a parvalbumin-specific scFv probe conjugated with Alexa Fluor 647. The double dotted lines delineate the Purkinje cell layer. (see Supplementary Figs. 12 and 15 for larger fields of view). CB calbindin, VGluT1 vesicular glutamate transporter 1, GFAP glial fibrillary acidic protein, Kv1.2 potassium voltage-gated channel subfamily A member 2, PV parvalbumin, TAM 5-TAMRA. b Workflow of multicolor imaging enabled by scFv probes and linear unmixing (see the text). c Representative maximum intensity projection of the multicolor fluorescence image stack acquired by linear unmixing of confocal images (n = 3 experiments). The signal of each fluorescent dye was pseudo-colored for better visualization. d Enlarged boxed inset from (c). The arrow indicates a Bergmann fiber (GFAP-positive) adjacent to the main dendrite of a Purkinje cell. Arrowhead indicates sites where axons form a pinceau structure labeled by the Kv1.2-specific scFv probe.
Fig. 3
Fig. 3. Multicolor volumetric CLEM enabled by scFv-assisted immunofluorescence.
a The high-resolution EM volume acquired from the cerebellar lobule, Crus 1 with multicolor immunofluorescence from scFv probes separated by linear unmixing (n = 1 experiment). The multicolor fluorescence data was co-registered with the high-resolution EM data. The Neuroglancer link to access the dataset is provided in the source data file. Numbers 1–4 indicate approximate regions where the ultrastructure was examined at high resolution (n = 12 experiments). Owing to the absence of detergent in immunofluorescence labeling, fine ultrastructure was preserved throughout the EM volume, such as in the molecular layer (1), in the Purkinje cell layer (2), in the glomeruli in the granule cell layer (3), and in the granule cell bodies (4). b Demonstration of the overlay between fluorescence signals and EM ultrastructure. Left panel shows the multicolor six-channel fluorescent image of slice 250 (n = 848 slices) of the spatially transformed fluorescence image volume. The middle panel shows three fluorescence channels corresponding to the labeling of CB, GFAP, and Hoechst overlaid onto the EM micrograph of slice 250. Right panel shows four fluorescent channels corresponding to the labeling of VGluT1, Kv1.2, PV, and Hoechst overlaid onto the EM micrograph of slice 250. Other examples of fluorescence overlay are shown in Supplementary Fig. 23.
Fig. 4
Fig. 4. 3D reconstruction of cells labeled by calbindin-specific and GFAP-specific scFv probes.
a 2D CLEM image showing the fluorescence signal (green) of the calbindin-specific scFv probe overlapping with the cell body of a Purkinje cell. b EM image showing 2D segmentation (green) of the calbindin-positive Purkinje cell (n = 1). c 3D reconstruction of the Purkinje cell labeled in a (n = 1), with the cell body in dark green and a dendritic branch in light green; three parallel fibers (red) make synapses on three spine heads of the dendritic branch (arrow indicates a parallel fiber (PF); arrowhead indicates a synapse). d EM image showing 2D segmentation of the synapse (arrowhead) between a parallel fiber (red) and a spine head of the dendritic branch (green) (n = 1). e 2D CLEM image showing fluorescence signals (red) of the GFAP-specific scFv probe overlapping with the cell body of a velate astrocyte in the granule cell layer (n = 1). f EM image showing 2D segmentation (red) of the velate astrocyte in (e) (n = 1). g 3D reconstruction of the velate astrocyte (red) labeled in (e) and two nearby granule cells (GC1 and GC2, light and dark blue) (n = 2); the astrocyte extends a veil-like glial process (arrowhead) between the two granule cells. h EM image showing 2D segmentation of the glial process (arrowhead) between GC1 and GC2 (n = 1). i 2D CLEM image showing fluorescence signals (red) of the GFAP-specific scFv probe overlapping with a Bergmann fiber (n = 1). j EM image showing 2D segmentation (red) of the Bergmann fiber in (i) (n = 1). k 3D reconstruction of two Bergmann glial cells (BG1 and BG2) (n = 2) traced from their Bergmann fibers labeled by the GFAP-specific scFv probe. l EM image showing 2D segmentation of the cell body of BG2 (n = 1) and a nearby basket cell (n = 1), noting the lack of infoldings in BG2’s nuclear membrane compared to the basket cell. n indicates an example.
Fig. 5
Fig. 5. 3D reconstruction of molecular layer interneurons and granule cells distinguished by PV-specific scFv probes.
a Representative 2D CLEM image (n = 22) showing fluorescence signals (magenta) of the parvalbumin-specific scFv probe overlapping a molecular layer interneuron (MLI) cell body. b EM image showing 2D segmentation (magenta) of the MLI in (a) (n = 1). c 3D reconstruction of MLIs (MLI a, MLI b, MLI c) (n = 3) relative to the pia and Purkinje cell layer, with axons in yellow. MLI a, farthest from the Purkinje cell layer, has an axon branching extensively and innervating a Purkinje cell’s dendritic shaft at arrowhead (dendritic shaft not shown; the synapse is shown in d and e) and forming part of the pinceau structure around another Purkinje cell’s axon initial segment at asterisk (axon initial segment not shown; the pinceau is shown in Supplementary Fig. 27e). This suggests MLI a is a deep axon stellate cell. d EM image showing 2D segmentation of the synapse (arrowhead) between MLI a’s axon (yellow) and a Purkinje cell dendrite (green) (n = 1). e 3D reconstruction of the synapse in (d) (n = 1). f Representative 2D CLEM image showing fluorescence signal (magenta) of the PV-specific scFv probe overlapping Purkinje cell dendrites (magenta asterisk) but not labeling a molecular layer granule cell (MGC) (blue plus sign) (n = 7). g EM image showing 2D segmentation (dark blue) of the MGC cell body in (f) (n = 1). h 3D reconstructions of MGCs (MGC a, MGC b, MGC c) (n = 3) relative to three Purkinje cells. Unlike granule cells in the granule cell layer, these MGCs received synapses from parallel fibers. Three such synapses between parallel fibers (red) and the MGCs are labeled. i EM image showing 2D segmentation of synapse 1 in (h) (n = 1). j 3D reconstruction of synapse 1 (n = 1) labeled by the arrowhead in (i). n indicates an example.
Fig. 6
Fig. 6. 3D reconstruction of subcellular components labeled with the Kv1.2-specific scFv probe.
a 2D CLEM image showing the fluorescence signals (yellow) of the Kv1.2-specific scFv probe overlapping with axonal terminals of MLIs at a pinceau structure surrounding the axon initial segment of a Purkinje cell (n = 1). b EM image showing the 2D segmentations of some (n = 7) of the axon terminals labeled in (a). c 3D reconstruction of the seven axonal terminals in (b) (see Supplementary Fig. 28a for the morphology of these axonal terminals). d A representative pair of juxtaparanodal punctate labeling sites of the Kv1.2-specific scFv probe in the granule cell layer (n = 15). The magenta arrow and green arrowhead show each side of the juxtaparanodal labeling. e Representative 2D CLEM image (n = 15 examples) showing one side of the juxtaparanodal punctate labeling (yellow, magenta arrow) of the axon in (d). f Shows the 2D segmentation of the axon in (e) (n = 1). g Representative 2D CLEM image (n = 15) showing another side of the juxtaparanodal punctate labeling (yellow, green arrowhead) of the Kv1.2-specific scFv probe at the other side of the juxtaparanodal segment of the same node of Ranvier. h EM image showing the 2D segmentation of the axon in (g) (n = 1). i 3D reconstruction of the node of Ranvier of the axon labeled in (dh) (myelination labeled in purple). j The juxtaparanodal labeling by the Kv1.2-specific probe in (d) overlaid onto the reconstructed node of Ranvier. k Extended 3D reconstruction of the axon in (i) shows that it had an en passant arborization and another terminal arborization (not shown) in the granule cell layer, that appeared to be mossy fiber synapses. n indicates an example.
Fig. 7
Fig. 7. 3D reconstruction and analysis of VGluT1-positive and -negative mossy fiber terminals based on labeling with the VGluT1-specific scFv probe.
a Representative 2D CLEM image showing the fluorescence signals (cyan) of the VGluT1-specific scFv probe overlapping with a mossy fiber terminal (n = 10). b EM image showing the 2D segmentation (cyan) of the mossy fiber terminal labeled in (a) (n = 1). The enlarged inset shows the morphology of synaptic vesicles in this terminal. c Representative 2D CLEM image showing a mossy fiber terminal lacking VGluT1 fluorescence signal (n = 10). d EM image showing the 2D segmentation (orange) of the mossy fiber terminal labeled in (c) (n = 1). The enlarged inset shows the morphology of synaptic vesicles in this terminal. e 3D reconstruction of the VGLUT1-positive mossy fiber terminal (cyan) in (b). The axon leading to the terminal arises from the bottom of the panel. f 3D reconstruction of the VGluT1-negative mossy fiber terminal (orange) in (c). The axon leading to the terminal arises from the bottom of the panel. g 3D reconstruction of ten VGluT1-positive mossy fiber terminals (cyan) and ten VGluT1-negative mossy fiber terminals (orange). The axons are labeled in white. h Volume, i vesicle number, j vesicle density, k mitochondria volume ratio per terminal volume were measured for each of the 10 VGluT1-positive terminals (n = 10), cyan, and the 10 VGluT1-negative terminals (n = 10), orange. Mean values with SD are shown on each graph. Two-sided unpaired t test was performed. For volume (h), P = 0.0191; P < 0.05; t = 2.575, df = 18; For vesicle number (i), P = 0.0050; P < 0.01; t = 3.200, df = 18; For vesicle density (j), P = 0.0705; P < 0.1; t = 1.922, df = 18; For mitochondria volume ratio (k), P = 0.1285; P > 0.1; t = 1.593, df = 18. Mito mitochondria. n indicates example. Source data are provided as a Source Data file.

Update of

References

    1. Peddie, C. J. et al. Volume electron microscopy. Nat. Rev. Methods Prim.2, 51 (2022).10.1038/s43586-022-00131-9 - DOI - PMC - PubMed
    1. Richards, J. G., Schoch, P., Häring, P., Takacs, B. & Möhler, H. Resolving GABAA/benzodiazepine receptors: cellular and subcellular localization in the CNS with monoclonal antibodies. J. Neurosci.7, 1866–1886 (1987). 10.1523/JNEUROSCI.07-06-01866.1987 - DOI - PMC - PubMed
    1. Baude, A. et al. The metabotropic glutamate receptor (mGluRlα) is concentrated at perisynaptic membrane of neuronal subpopulations as detected by immunogold reaction. Neuron11, 771–787 (1993). 10.1016/0896-6273(93)90086-7 - DOI - PubMed
    1. Nusser, Z., Sieghart, W. & Somogyi, P. Segregation of different GABAA receptors to synaptic and extrasynaptic membranes of cerebellar granule cells. J. Neurosci.18, 1693–1703 (1998). 10.1523/JNEUROSCI.18-05-01693.1998 - DOI - PMC - PubMed
    1. Humbel, B. M., de Jong, M. D., Müller, W. H. & Verkleij, A. J. Pre-embedding immunolabeling for electron microscopy: an evaluation of permeabilization methods and markers. Microsc. Res. Tech.42, 43–58 (1998). 10.1002/(SICI)1097-0029(19980701)42:1<43::AID-JEMT6>3.0.CO;2-S - DOI - PubMed

Substances