. 2024 Aug 5;15(1):6643.
doi: 10.1038/s41467-024-50964-z.

A neurodevelopmental disorder mutation locks G proteins in the transitory pre-activated state

Affiliations

A neurodevelopmental disorder mutation locks G proteins in the transitory pre-activated state

Kevin M Knight et al. Nat Commun. .

Abstract

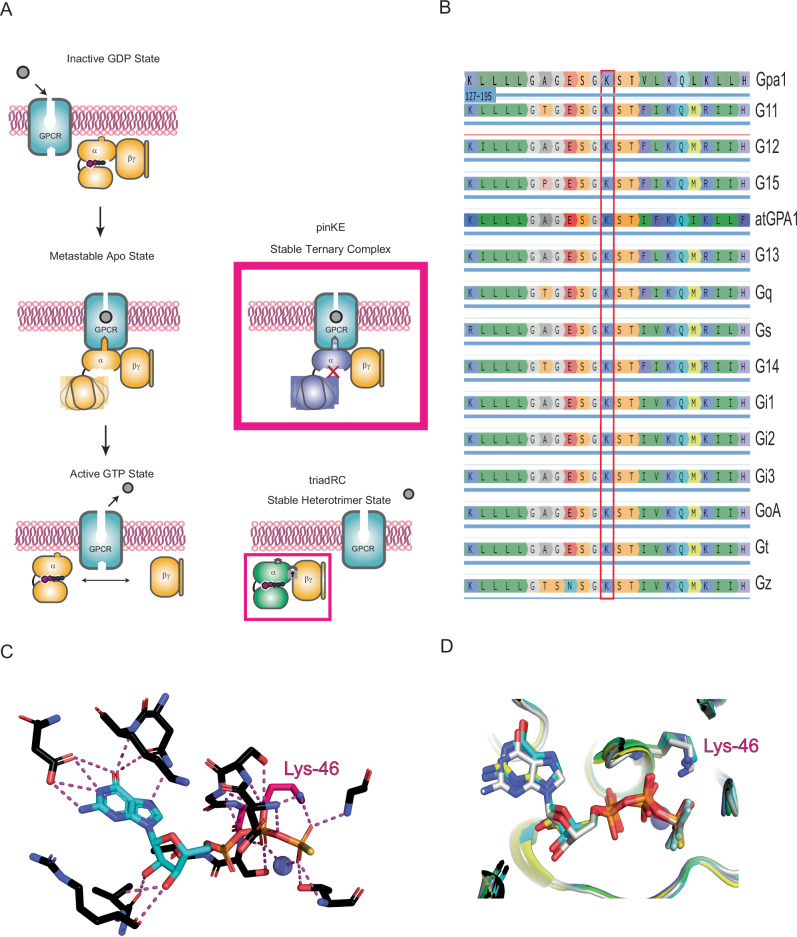
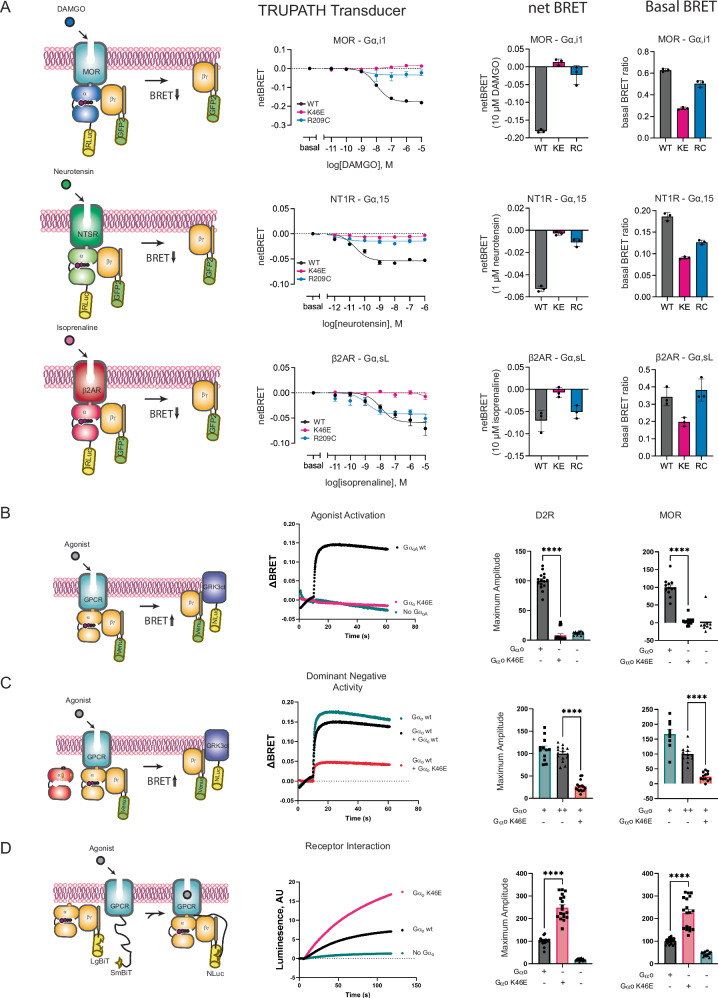
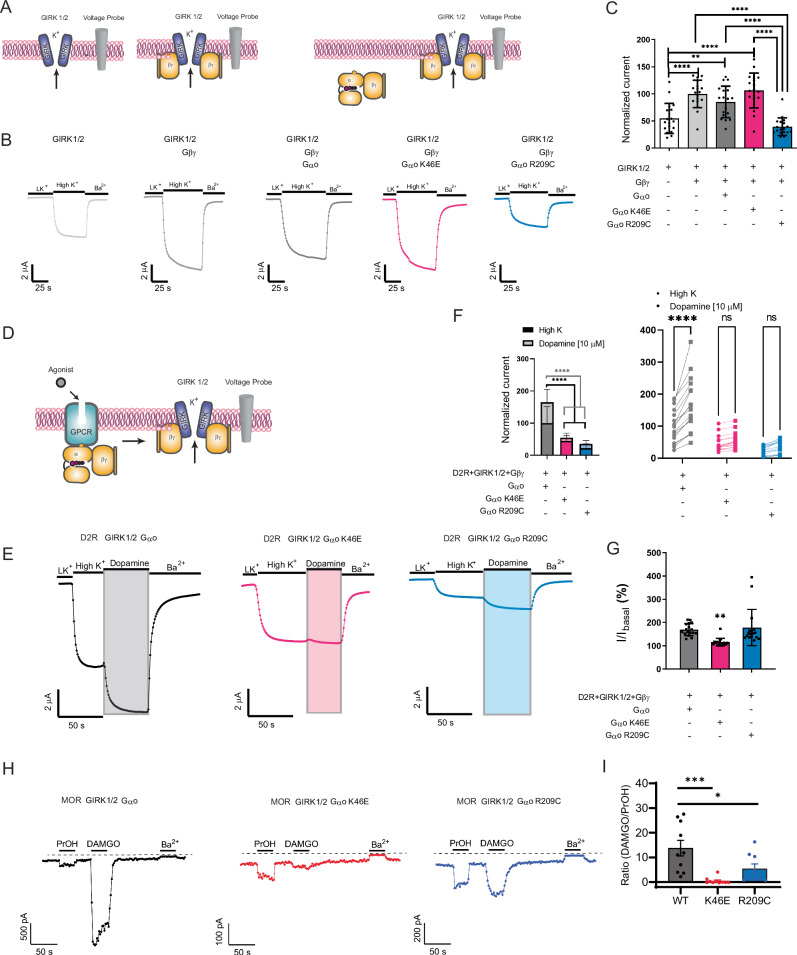
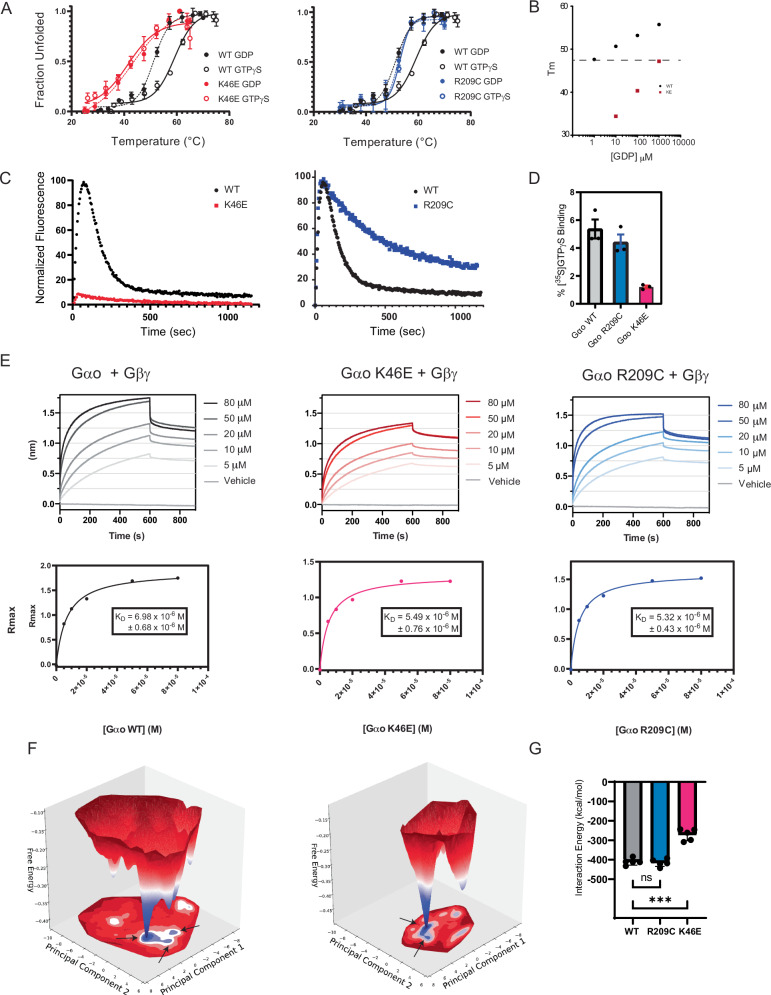
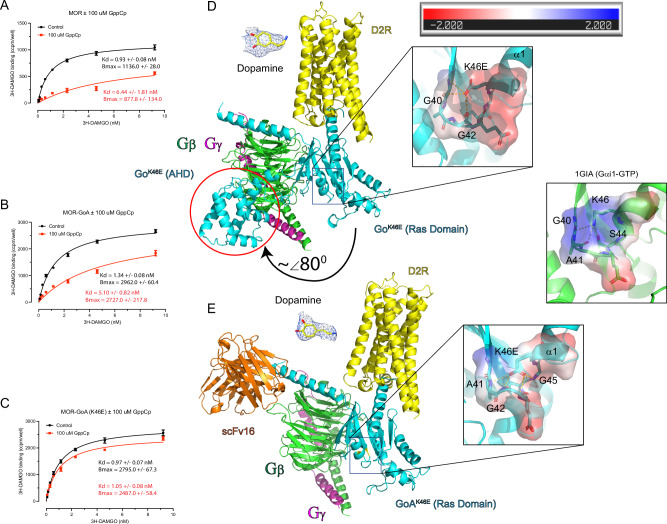
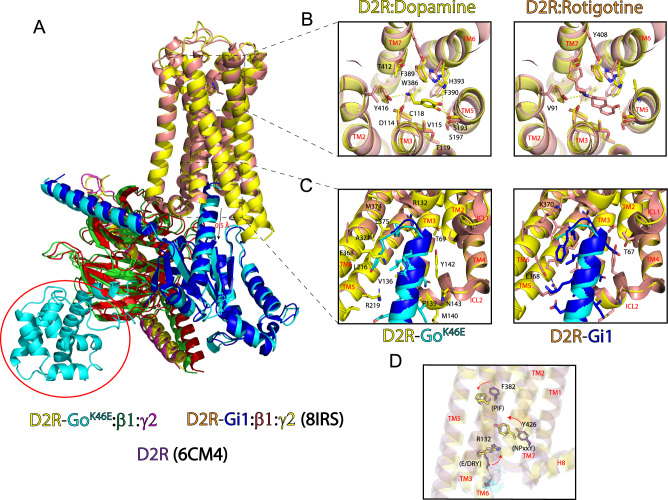
Many neurotransmitter receptors activate G proteins through exchange of GDP for GTP. The intermediate nucleotide-free state has eluded characterization, due largely to its inherent instability. Here we characterize a G protein variant associated with a rare neurological disorder in humans. GαoK46E has a charge reversal that clashes with the phosphate groups of GDP and GTP. As anticipated, the purified protein binds poorly to guanine nucleotides yet retains wild-type affinity for G protein βγ subunits. In cells with physiological concentrations of nucleotide, GαoK46E forms a stable complex with receptors and Gβγ, impeding effector activation. Further, we demonstrate that the mutant can be easily purified in complex with dopamine-bound D2 receptors, and use cryo-electron microscopy to determine the structure, including both domains of Gαo, without nucleotide or stabilizing nanobodies. These findings reveal the molecular basis for the first committed step of G protein activation, establish a mechanistic basis for a neurological disorder, provide a simplified strategy to determine receptor-G protein structures, and a method to detect high affinity agonist binding in cells.


Conflict of interest statement

B.L.R. is an SAB member of Escient, Septerna and Lassogen and UNC has licensed technology from his lab to many biotechnology and pharmaceutical companies. The remaining authors declare no competing interests.

Figures

Fig. 1
Fig. 1. The phosphate-interacting and neutralizing lysine (pinK) controls one of three binding and unbinding transformations in Gα.
A Agonist binding leads to stabilization of the nucleotide-free form of the G protein heterotrimer, while GTP binding leads to conformational changes in Gα and unbinding of Gα-GTP from the Gβγ subunits. Mutations disrupt GTP binding (pinKE) and GTP-dependent subunit dissociation (triadRC). B The conserved phosphate interacting and neutralizing lysine (pinK) is present in all human Gα proteins as well as Gα proteins from the yeast S. cerevisiae (Gpa1) and plant A. thaliana (AtGPA1). C pinK (Lys-46 in Gαo) forms polar interactions with GTP. D Overlay of multiple Gα structures from PDB ID: 1GIA (Gi1, green), 1AZT (Gs, cyan), 1TND (Gt, blue), 3C7K (Go, gray), and 1ZCA (G12, yellow), showing that pinK bridges the β and γ phosphates of GTP.
Fig. 2
Fig. 2. The pinKE mutation impedes G protein subunit dissociation.
A Agonist-induced dissociation of Gα and Gβγ subunits (left). HEK293T cells transfected with the indicated receptor, WT or mutant Gα-RLuc8 donor, Gβ and Gγ-GFP acceptor proteins (middle). Representative concentration-response measurements using the μ-opioid (MOR; Gi1), neurotensin (NT1R; Gq, G13), or β2-adrenergic receptor (β2AR; Gs) receptors, presented as fold decrease in dynamic range measured by comparing the energy transfer from donor to acceptor and reported as ΔBRET (GFP/Rluc8 per well minus Basal BRET, or GFP/Rluc8, at lowest dose of agonist) in comparison to basal activity, presented as raw BRET values prior to stimulus (right). Data are means ± SEM from 3 independent experiments, 2 measurements each. B Agonist-induced dissociation of Gβγ subunits (left). HEK293FT cells transfected with MOR or D2R, either empty vector (pcDNA3.1) or vector with wild-type or mutant Gαo, masGRK3ct-Nluc-HA donor and Venus-Gβγ acceptor proteins. Representative time-course measurements for D2R after dopamine addition, presented as ΔBRET (ratio of emission by Venus at 535 nm and Nluc at 475 nm; recorded prior to agonist stimulation and subtracted from the experimental BRET values, middle). Effect of mutations, quantified as maximum amplitude relative to wild type (right). Data are means ± SEM from 4 (vector) or 5 (Gαo or GαoK46E) independent experiments, 3 measurements each. C Dominant-negative inhibition of subunit release (left). HEK293 cells transfected as in B but with the addition of an equal amount of wild-type Gαo (middle), done by transfecting equivalent amounts of mutant and wild-type DNA. Effect of mutations quantified as maximum amplitude (right). BRET data are means ± SEM from 4 (vector) or 5 (Gαo or GαoK46E) independent experiments, 3 measurements each. D Agonist-induced association of GPCRs and G proteins (left). HEK293FT cells transfected with MOR or D2R fused to myc-SmBiT, Gαo, Gβ fused to LgBiT, and Gγ. Representative time-course measurements after dopamine addition leading to reconstitution of functional Nluc, presented as arbitrary luminesence units (ΔAU, middle). Effect of mutations, quantified as maximum amplitude (right). Data are means ± SEM from 6 independent experiments, 3 measurements each. Statistical analysis performed with 2-tailed unpaired t test; ****p < 0.0001. Source data are provided as a Source Data file.
Fig. 3
Fig. 3. The pinKE mutation impedes Gβγ-mediated effector activation.
A GIRK1/GIRK2 channel current without (left) and with Gβγ (middle) or Gαβγ (right). B Representative two-electrode voltage clamp (TEVC) recordings in Xenopus laevis oocytes expressing GIRK1/2, Gβ1γ2, and either Gαo (black), GαoK46E (red) or GαoR209C (blue) following treatment with high potassium solution (High K+) and barium (Ba2+), which directly activate and inactivate the channel, respectively. C Maximum voltage differences. Normalized current, normalized to the GIRK 1/2 + Gβγ condition (100%). Data are means ± SD from 3 independent experiments with 6 measurements each; ****p < 0.0001; **p = 0.0083. D GIRK1/GIRK2 channel current with Gαβγ and receptor. E Representative TEVC recordings in Xenopus laevis oocytes expressing dopamine D2 receptor, GIRK1/2, Gβ1γ2, and either Gαo (black), GαoK46E (red), or GαoR209C (blue) following treatment with high potassium solution (High K+) and barium (Ba2+), as well as dopamine, which activates the D2 receptor. F Normalized potassium- and dopamine-induced currents. Data are means ± SD from 3 independent experiments, with 6, 6, and 5 measurements each; ****p < 0.0001. G Normalized currents induced by dopamine divided by currents induced by high potassium (I/Ibasal). Data from (F) are means ± SD; **p = 0.0039. H Representative current recordings from HEK293T cells expressing MOR and the indicated Gαo subunit, showing activation with 1-propanol (PrOH), activation with DAMGO or inhibition with BaCl2. Each solution was delivered for 30 s. I Bar plot shows the ratio of DAMGO-activated to PrOH-activated current for each Gαo subunit. Data are means ± SD from 9 (R209C) or 10 (WT, K46E) independent experiments; ***p = 0.0003; *p = 0.0221. Statistical analysis in C and G performed with one-way ANOVA Tukey’s test. Statistical analysis in F performed by two-way ANOVA with Tukey’s multiple comparison (left) and Sidak pairwise comparison (right) tests. Statistical analysis in I performed with one-way ANOVA Dunett’s test. Source data are provided as a Source Data file.
Fig. 4
Fig. 4. The pinKE mutation preserves high affinity binding to Gβγ but not guanine nucleotides.
A Thermostability of purified Gαo (black), GαoK46E (red), and GαoR209C (blue) equilibrated in GTPγS (solid lines) or GDP (dashed lines). Tm values were quantified by fitting a two-state model of thermal unfolding. B Comparison Gαo and GαoK46E binding (Tm) to GDP. C Combination of purified Gαo, GαoK46E, and GαoR209C with BODIPY-GTP to monitor binding (increase in fluorescence) and hydrolysis (decrease in fluorescence). Normalized fluorescence, defined as percentage of maximum signal after subtracting the starting signal, for each experimental run. D Percent Gαo bound to GTPγ[35S] determined using the ratio of the measured activity per sample (cpm/pmol Gαo) to the average total specific activity of 35S added to each sample (cpm/pmol). E Purified biotinylated Gβ and Gγ immobilized on streptavidin were combined with the indicated concentration of purified Gαo (left), GαoK46E (middle), and GαoR209C (right). Binding is reported as a shift in the interference pattern (nanometers, nm). Rmax, defined as the absolute signal in nm after subtracting the starting (buffer) control. F Free energy surface of Gαo-apo system (left) and GαoK46E -apo system (right). Shown are representative structures from the local minima indicated by arrows on the free energy surface. G Interaction energy of GTP with proteins in the Gαo-GTP, GαoR209C-GTP, and GαoK46E -GTP systems. Data in A and D are means ± SEM, from 3 independent experiments, 3 measurements each. Data in B are means of 2 independent experiments. Data in C are representative of 3 or more independent experiments. Data in E are representative of 2 independent experiments, 2 measurements each. Data in G are means ± SEM, from 5 independent experiments; ***p = 0.0003. Source data are provided as a Source Data file.
Fig. 5
Fig. 5. The pinKE mutation stabilizes the high affinity agonist-bound form of the receptor.
A Saturation binding assays using [3H] DAMGO in the absence (black) and presence (red curve) of nonhydrolyzable GTP (GppCp) for μ-opioid receptor (MOR), 15 μg/well. B As in A, but for MOR fusion with Gαο, 15 μg/well. C As in A, but for MOR fusion with GαοK46E,12 μg/well. D Cryo-EM structure of the dopamine D2 receptor (D2R), GαοK46E and Gβγ complex. Insets show representative EM density for dopamine and the K46E region of Gαο (note occluded pocket and charge reversal). Distance lines are <4 Å. Black directional arrow, movement of the all-helical domain (AHD, enclosed by a red circle) away from Ras-like domain. Inset, electrostatic potential calculated using the APBS plugin for PyMol. Displayed is the colored surface with a range of ±2 KbT/ec. E Cryo-EM structure of D2R, GαοK46E, Gβγ, and scFv16 complex. Insets show representative EM density for dopamine and the Lys-46 region in Gαi1 (PDB ID: 1GIA, note positive charge of region). Distance lines are <4 Å. Inset, electrostatic potential calculated using the APBS plugin for PyMol. Displayed is the colored surface with a range of ±2 KbT/ec. Data in AC are presented as means ± SEM from independent experiments, 3 measurements each. Statistical differences of Kd values derived from concentration-response assays were determined using the Extra sum-of-squares F test function in GraphPad Prism 9.0 comparing ±100 μM GppCp: (A) p < 0.0001; F(1,185) = 35.5 (B), p < 0.0001; F(1,188) = 62.2; (C) p = 0.5185; F(1,186) = 0.4185. In panels D and E, superposition of loop region residues G40-S47 Cα reveal an RMSD of 1.094 Å and 0.598 Å when comparing Gαi1-GTP (PDB ID: 1GIA) with D2R-GoK46E and D2R-GoK46E + scFv16, respectively. Source data are provided as a Source Data file.
Fig. 6
Fig. 6. Structural comparison of D2R-GoK46E with D2R-Gi1 reveals conserved features.
A Superposition of D2R-Go K46E bound with dopamine and D2R-Gi1 bound with rotigotine (PDB ID: 8IRS) reveals an RMSD of 1.50 Å between the two receptors. GαοK46E is shifted downward approximately 0.5 Å relative to Gαο. B Top-down view of the extracellular region and orthosteric binding sites of D2R-Go K46E and D2R-Gi1. Stick figures are residues that interact with either dopamine or rotigotine. Yellow distance lines are <4 Å. Stick figures of residues and bound ligand correspond to the receptor complex. Left panel, stick figures are shared residues; right panel, residues specific for rotigotine. TMs are labeled in red. C Comparison of intracellular region of D2R-GoK46E and D2R-Gi1. Stick figures are interacting residues from D2R and the respective G protein C-terminal tails. Stick figures of residues correspond to the receptor complex. Left panel, stick figures of shared residues; right panel, additional residues specific for Gi1. TMs and intracellular loops (ICLs) are labeled in red. D Structural comparison of GPCR activation motifs in the D2R inactivate state (PDB ID: 6CM4) and those of D2R-GoK46E and D2R-Gi1. Stick figures, key residues in the PIF, E/DRY, and NPxxY activation motifs. Arrows, direction of movement in going from the inactive to the active state. Coloring is consistent with the corresponding D2R.

References

    1. Flock, T. et al. Universal allosteric mechanism for Galpha activation by GPCRs. Nature524, 173–179 (2015). 10.1038/nature14663 - DOI - PMC - PubMed
    1. Flock, T. et al. Selectivity determinants of GPCR-G-protein binding. Nature545, 317–322 (2017). 10.1038/nature22070 - DOI - PMC - PubMed
    1. Sprang, S. R. Invited review: activation of G proteins by GTP and the mechanism of Gα-catalyzed GTP hydrolysis. Biopolymers105, 449–462 (2016). 10.1002/bip.22836 - DOI - PMC - PubMed
    1. Hilger, D., Masureel, M. & Kobilka, B. K. Structure and dynamics of GPCR signaling complexes. Nat. Struct. Mol. Biol.25, 4–12 (2018). 10.1038/s41594-017-0011-7 - DOI - PMC - PubMed
    1. Muralidharan, K., Van Camp, M. M. & Lyon, A. M. Structure and regulation of phospholipase Cβ and ε at the membrane. Chem. Phys. Lipids235, 105050 (2021). 10.1016/j.chemphyslip.2021.105050 - DOI - PMC - PubMed

MeSH terms

Substances

Grants and funding

LinkOut - more resources