. 2024 Aug 5;12(1):43.
doi: 10.1038/s41413-024-00341-9.

Induction of osteoblast apoptosis stimulates macrophage efferocytosis and paradoxical bone formation

Affiliations

Induction of osteoblast apoptosis stimulates macrophage efferocytosis and paradoxical bone formation

Lena Batoon et al. Bone Res. .

Abstract

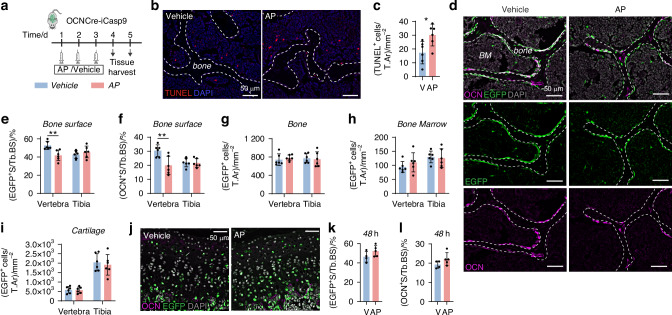
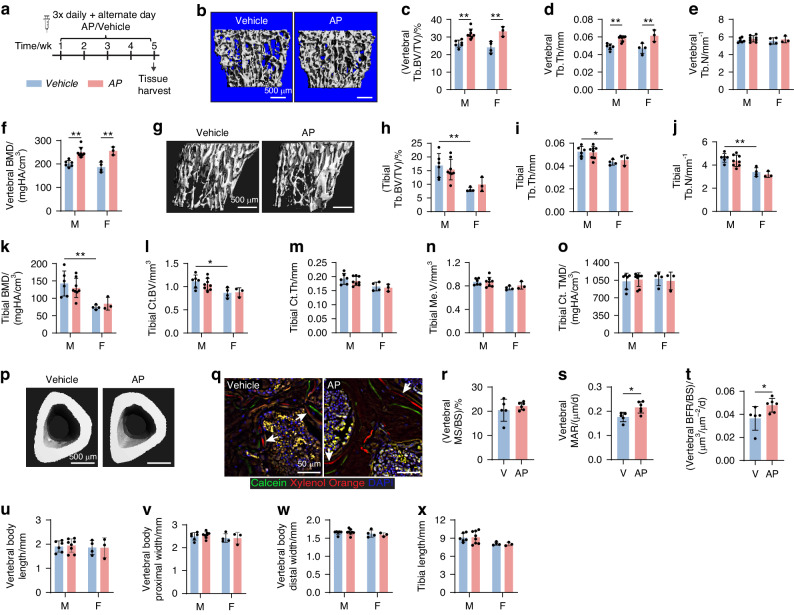
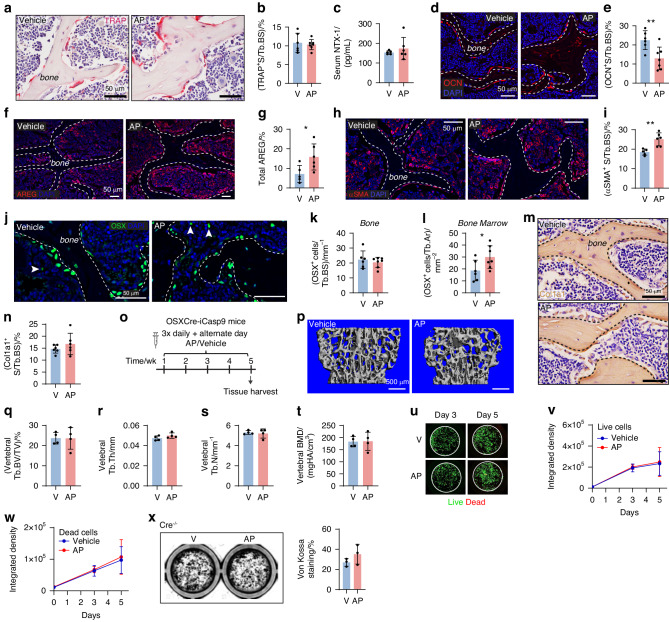
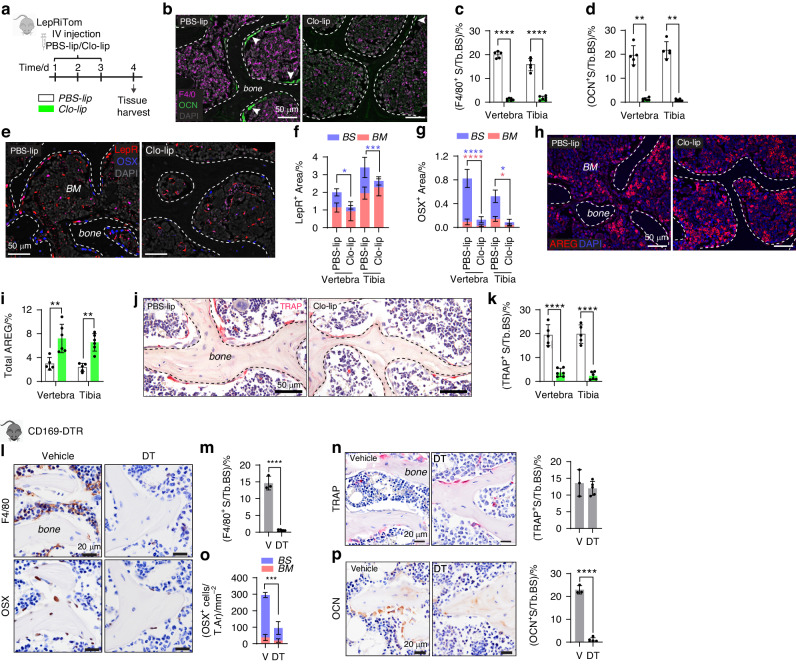
Apoptosis is crucial for tissue homeostasis and organ development. In bone, apoptosis is recognized to be a main fate of osteoblasts, yet the relevance of this process remains underexplored. Using our murine model with inducible Caspase 9, the enzyme that initiates intrinsic apoptosis, we triggered apoptosis in a proportion of mature osteocalcin (OCN+) osteoblasts and investigated the impact on postnatal bone development. Osteoblast apoptosis stimulated efferocytosis by osteal macrophages. A five-week stimulation of OCN+ osteoblast apoptosis in 3-week-old male and female mice significantly enhanced vertebral bone formation while increasing osteoblast precursors. A similar treatment regimen to stimulate osterix+ cell apoptosis had no impact on bone volume or density. The vertebral bone accrual following stimulation of OCN+ osteoblast apoptosis did not translate in improved mechanical strength due to disruption of the lacunocanalicular network. The observed bone phenotype was not influenced by changes in osteoclasts but was associated with stimulation of macrophage efferocytosis and vasculature formation. Phenotyping of efferocytic macrophages revealed a unique transcriptomic signature and expression of factors including VEGFA. To examine whether macrophages participated in the osteoblast precursor increase following osteoblast apoptosis, macrophage depletion models were employed. Depletion of macrophages via clodronate-liposomes and the CD169-diphtheria toxin receptor mouse model resulted in marked reduction in leptin receptor+ and osterix+ osteoblast precursors. Collectively, this work demonstrates the significance of osteoblast turnover via apoptosis and efferocytosis in postnatal bone formation. Importantly, it exposes the potential of targeting this mechanism to promote bone anabolism in the clinical setting.


Conflict of interest statement

The authors declare that the research was conducted in the absence of any commercial or financial relationships that could be construed as a potential conflict of interest.

Figures

Fig. 1
Fig. 1
A three daily AP treatment in OCNcre-iCasp9 mice induced selective osteoblast apoptosis in the vertebra. a Schematic detailing the treatment regimen in 3-week-old OCNCre-iCasp9 mice and tissue harvest. b TUNEL staining with DAPI counterstain and (c) quantification of the number of TUNEL+ cells per tissue area (T.Ar) in the vertebrae of vehicle- or AP-treated OCNcre-iCasp9 mouse at 24 h post treatment. d Representative images showing distribution of EGFP and OCN expression with DAPI counterstain. BM bone marrow. Quantification in the vertebra and tibia of: (e) EGFP+ surface (S) per trabecular bone surface (Tb.BS), (f) OCN+ S per Tb.BS and (g) EGFP+ cell number per trabecular bone area (Tb.Ar) at 24 h post treatment. Number of EGFP+ cells in the (h) bone marrow or (i) cartilage expressed as per T.Ar at 24 h post treatment. j Images of EGFP and OCN expression in vertebral epiphyseal endplate with DAPI counterstain. Percentage of (k) EGFP+ S and (l) OCN+ S per Tb.BS at 48 h after the final injection. Statistical significance was determined using two-tailed unpaired t-test (c, k, l) or two-way ANOVA with Sidak’s multiple comparisons test (ei). *P < 0.05; **P < 0.01. Error bars represent standard deviation. Each data point represents a single mouse. bj n = 6 mice/group; (k, l) V n = 4 mice, AP n = 5 mice
Fig. 2
Fig. 2
Osteoblast apoptosis in OCNCre-iCasp9 mice stimulated macrophage efferocytosis. a Quantification of the number of Ly6G+ cells directly associated with vertebral trabecular bone surface (Tb.BS) and representative images showing Ly6G expression with DAPI counterstain. b TRAP+ surface (S) per Tb.BS quantified using colorimetric TRAP assay counterstained with hematoxylin. c Quantification of percent F4/80+ S per Tb.BS and representative images of F4/80 staining with DAPI counterstain. Arrows indicate macrophages adjacent to bone. d Quantification of CD68+F4/80neg S and (e) CD68+F4/80+ S per Tb.BS using (f) dual staining for CD68 and F4/80 expression. Arrowheads indicate cells with double positivity for CD68 and F4/80. Arrows indicate CD68+ cells negative for F4/80 expression. g Multiplex staining for F4/80, EGFP and CD68 expression used to quantify (h) F4/80+ cells that also expressed CD68 and EGFP. i Enumeration of the F4/80+ signals in the entire vertebral section expressed as number per tissue area (T.Ar). j Quantification of F4/80+Ki67+ cells in the entire vertebral section showing the proportion of signals on the bone surface (BS, mm) and in the bone marrow (BM, tissue area/T.Ar, mm2) and (k) representative images showing dual staining for Ki67 and F4/80 expression with DAPI counterstain. Arrowhead indicate a Ki67+F4/80+ cell. Statistical significance was determined using two-tailed unpaired t-tests or two-way ANOVA with Sidak’s multiple comparisons test. *P < 0.05; **P < 0.01. Error bars represent standard deviation. Each data point represents a single mouse. n = 6 mice/group
Fig. 3
Fig. 3
AP treatment for 5 weeks in OCNCre-iCasp9 mice increased vertebral bone formation. a Schematic detailing treatment regimen and timing of tissue harvest. b Representative micro-CT 3D reconstruction and analysis of the vertebrae showing trabecular (Tb) (c) bone volume (BV) per tissue volume (TV), (d) thickness (Th), (e) number (N) and (f) bone mineral density (BMD). Data from male (M) and female (F) mice are presented separately. g Representative micro-CT 3D reconstruction of the metaphyseal trabecular bone in the tibia. Micro-CT analysis showing Tb (h) BV/TV, (i) Th, (j) N, and (k) BMD. Micro-CT analysis of the cortical (Ct) bone showing (l) BV, (m) Th, (n) medulla volume (Me.V), (o) tissue mineral density (TMD) and (p) representative images with transverse view. q Dynamic bone labeling using calcein (7 days) and xylenol orange (2 days) in vertebral trabeculae. Sections were stained with DAPI to visualize nuclei. r Mineralizing surface per bone surface (MS/BS), (s) mineral apposition rate (MAR) and (t) bone formation rate per unit of bone surface (BFR/BS) quantified in the vertebral trabeculae using dynamic bone labeling (q). Assessment of vertebral body size showing height (u) and width of the proximal (v) or distal (w) bone ends. x Length of the tibiae measured from the growth plate to the tibiofibular junction. V vehicle. Statistical significance was determined using two-way ANOVA with Sidak’s multiple comparisons test (cf, ho, ux) or two-tailed unpaired t-tests (rt). *P < 0.05; **P < 0.01. Error bars represent standard deviation. Each data point represents a single mouse. bp, ux vehicle M n = 6 mice, AP M n = 8 mice, vehicle F n = 4 mice; AP F n = 3 mice; (qt) vehicle n = 5 mice, AP n = 6 mice
Fig. 4
Fig. 4
Long-term AP treatment in OCNCre-iCasp9 mice did not alter vertebral bone strength but disrupted the lacuno-canalicular network. Outcome of L5 vertebrae compression testing showing (a) stiffness and (b) ultimate load to failure. V vehicle. c H&E staining of the vertebra used to enumerate (d) osteocyte number (Ot.N) per trabecular bone area (Tb.Ar) and (e) empty lacunae number (La.N) per Tb.Ar. f Silver nitrate staining used to quantify the (g) average length of the canaliculi and (h) average number of canaliculi per osteocyte. i Levels of circulating sclerostin (SOST) at the experimental endpoint. j Proportion of SOST+ and SOST osteocytes in the trabecular bone quantified using (k) dual collagen type 1 (Col1a1) and SOST staining with DAPI counterstain. Arrowheads indicate the osteocytes negative for SOST staining. Statistical significance was determined using two-tailed unpaired t-tests or two-way ANOVA with Sidak’s multiple comparisons test. Error bars represent standard deviation. *P < 0.05; **P < 0.01; ***P < 0.001; ****P < 0.000 1. Each data point represents a single mouse. a, b, i V n = 5 mice, AP n = 6 mice; (ch, jk) V n = 6 mice, AP n = 7 mice
Fig. 5
Fig. 5
Long-term AP treatment in OCNCre-iCasp9 mice increased osteoblast precursors. an Treatment for 5 weeks in 3-week-old OCNCre-iCasp9 mice. a Colorimetric TRAP staining with hematoxylin counterstain in the vertebra of vehicle (V)- and AP-treated mice used to quantify (b) TRAP+ surface (S) per trabecular bone surface (Tb.BS). c Serum levels of N-Terminal Telopeptide of Type I Collagen (NTX-1) at the experimental endpoint. d Representative images of OCN staining with DAPI nuclear stain and (e) quantification of OCN+ S per Tb.BS. f Amphiregulin (AREG) expression with DAPI nuclear stain and (g) quantification of percent AREG+ staining in the entire vertebral tissue. h αSMA expression with DAPI nuclear stain. i Percent αSMA+ staining on the bone surface. j OSX expression with DAPI nuclear stain. Arrowheads indicate OSX+ cells in the bone marrow space. Number of osterix+ cells (k) on the Tb.BS and (l) in the bone marrow expressed as number per tissue area (T.Ar). m Collagen Type 1 (Col1a1) staining counterstained with hematoxylin and (n) quantification of percent Col1a1+ surface per Tb.BS. ot Treatment for 5 weeks in 3-week-old OSXCre-iCasp9 mice of mixed gender. o Schematic detailing treatment regimen and timing of tissue harvest. p Micro-CT images of vehicle- or AP-treated OSXCre-iCasp9 mouse vertebra and analysis showing trabecular (Tb) (q) bone volume (BV) per tissue volume (TV), (r) thickness (Th), (s) number (N) and (t) bone mineral density (BMD). uw Representative images (u) and frequencies of live (v) and dead (w) cells in BMSC culture isolated from OCNCre−/− mice exposed to vehicle or AP. x Von Kossa staining of BMSCs isolated from OCNCre−/− mice and treated with vehicle or AP for 12 days. Statistical significance was determined using two-tailed unpaired t-tests (bt, x) or two-way ANOVA with Sidak’s multiple comparisons test (v, w). Error bars represent standard deviation. *P < 0.05; **P < 0.01. Each data point represents a single mouse. a, b, d, e, jl V n = 6 mice, AP n = 7 mice; (c, fi) V n = 5 mice, AP n = 6 mice; (m, n) n = 6 mice/group; (ot) n = 4 mice/group; (ux) n = 3 mice/group
Fig. 6
Fig. 6
Long-term AP treatment in OCNCre-iCasp9 mice stimulated macrophage efferocytosis and vasculature formation. Quantification of (a) the total F4/80 staining in vertebral tissue and (b) F4/80+ surface (S) per trabecular bone surface (Tb.BS) after long-term AP or vehicle treatment in OCNCre-iCasp9 mice. c Number of F4/80+ cells containing OCN+ remnants per Tb.BS quantified using (d) sections stained for F4/80 and OCN expression. Arrows indicate macrophages associated with bone. Boxed regions include z-stack images showing intracellular OCN+ remnant (arrowhead) within a macrophage. e EGFP and OCN staining showing very similar expression in the calvaria of 1-week-old OCNCre-iCasp9 and OSXCre-iCasp9 mice. f Schematic summarizing the experimental flow from cell isolation to single-cell RNA sequencing. Schematic created with BioRender.com. CT Cell Tracker (CFSE). g tSNE plot showing clustering of 8 391 “efferocytic” macrophages and 10 036 “control” macrophages based on gene expression. h Dot plots showing expression (log2) of Csf1r, Cd86, Cd80, Nos2, Adgre1, Cd200r1, Cd206 and Arg1. i Top 10 Gene Ontology (GO) biological process terms presented along with gene count, fold enrichment and statistical significance. List of top 15 upregulated genes within the GO term (j) “angiogenesis” and (k) “positive regulation of cell migration” ranked based on log2 fold-change. l Violin plot showing Vegfa expression in control (Ctrl) and efferocytic (Effero) macrophages. m Representative images showing VEGFA and F4/80 expression with DAPI counterstain. Arrowheads indicate some F4/80+VEGFA+ cells associated with bone. Quantification of (n) F4/80+VEGFA+ and (o) F4/80negVEGFA+ cell numbers per Tb.BS. p Laminin expression with DAPI counterstain. Quantification of (q) the number of laminin+ vessels per tissue area (T.Ar) separated based on size. r Percent area (Ar) of laminin+ vessels per bone marrow area (BM.Ar). s Percent area of laminin+ vessels per trabecular bone area (Tb.Ar). Statistical significance was determined using two-tailed unpaired t-tests (ac, no, rs) or two-way ANOVA with Sidak’s multiple comparisons test (q). Error bars represent standard deviation. *P < 0.05; #P = 0.067. Each data point represents a single mouse. a–d V n = 6 mice, AP n = 7 mice; (el) n = 3–4 mice/group; (ms) V n = 5 mice, AP n = 6 mice
Fig. 7
Fig. 7
Macrophage depletion reduced osteoblast precursors. a Schematic detailing the clodronate- or PBS-liposome treatment regimen in LepRiTom mice and tissue harvest. b Dual F4/80 and OCN staining with DAPI nuclear stain in the vertebra. Arrowheads indicate OCN+ staining on the bone surface. Quantification of (c) F4/80+ or (d) OCN+ surface (S) per trabecular bone surface (Tb.BS) in the vertebra and tibia. e LepR and OSX staining in the vertebra with DAPI counterstain. Area of (f) LepR+ or (g) OSX+ staining on the bone surface (BS) or bone marrow (BM) expressed as percentage of the total vertebral section. Significance of each group presented in the same color as the corresponding bar. h Amphiregulin (AREG) expression in the vertebra and (i) quantification of percent AREG+ staining per total area within the tissues examined. j TRAP staining and (k) quantification of percent TRAP+ S per Tb.BS. lp Histomorphometric analysis of the metaphyseal trabecular bone of CD169-DTR mouse tibia following vehicle (V) or DT treatment. l Near serial sections stained with F4/80 or OSX. Quantification of percent (m) F4/80+ and (n) TRAP+ S per Tb.BS with representative images. o Total number of OSX+ cells per area of tissue (T.Ar) examined with proportion on the bone surface (blue) versus marrow (red). p OCN expression and quantification of OCN+ surface expressed as a percentage of the Tb.BS. Statistical significance was determined using two-way ANOVA with Tukey’s multiple comparisons test (c, f, g, i, k), unpaired multiple Mann–Whitney t-test (d) or two-tailed unpaired t-tests (mp). Error bars represent standard deviation. *P < 0.05; **P < 0.01; ***P < 0.001; ****P < 0.000 1. Each data point represents a single mouse. bk PBS-lip n = 5 mice, clo-lip n = 6 mice; (lp) V n = 3 mice, DT n = 5 mice

References

    1. Denaxa, M., Neves, G., Burrone, J. & Pachnis, V. Homeostatic regulation of interneuron apoptosis during cortical development. J. Exp. Neurosci.12, 1179069518784277 (2018). 10.1177/1179069518784277 - DOI - PMC - PubMed
    1. Hojo, M. A. et al. Identification of a genomic enhancer that enforces proper apoptosis induction in thymic negative selection. Nat. Commun.10, 2603 (2019). 10.1038/s41467-019-10525-1 - DOI - PMC - PubMed
    1. Arandjelovic, S. & Ravichandran, K. S. Phagocytosis of apoptotic cells in homeostasis. Nat. Immunol.16, 907–917 (2015). 10.1038/ni.3253 - DOI - PMC - PubMed
    1. Gerlach, B. D. et al. Efferocytosis induces macrophage proliferation to help resolve tissue injury. Cell Metab.33, 2445–2463.e2448 (2021). 10.1016/j.cmet.2021.10.015 - DOI - PMC - PubMed
    1. Meriwether, D. et al. Macrophage COX2 mediates efferocytosis, resolution reprogramming, and intestinal epithelial repair. Cell. Mol. Gastroenterol. Hepatol.13, 1095–1120 (2022). 10.1016/j.jcmgh.2022.01.002 - DOI - PMC - PubMed

LinkOut - more resources