. 2024 Aug 5;14(1):18051.
doi: 10.1038/s41598-024-67623-4.

Plasmodium falciparum population dynamics in East Africa and genomic surveillance along the Kenya-Uganda border

Affiliations

Plasmodium falciparum population dynamics in East Africa and genomic surveillance along the Kenya-Uganda border

Ashley Osborne et al. Sci Rep. .

Abstract

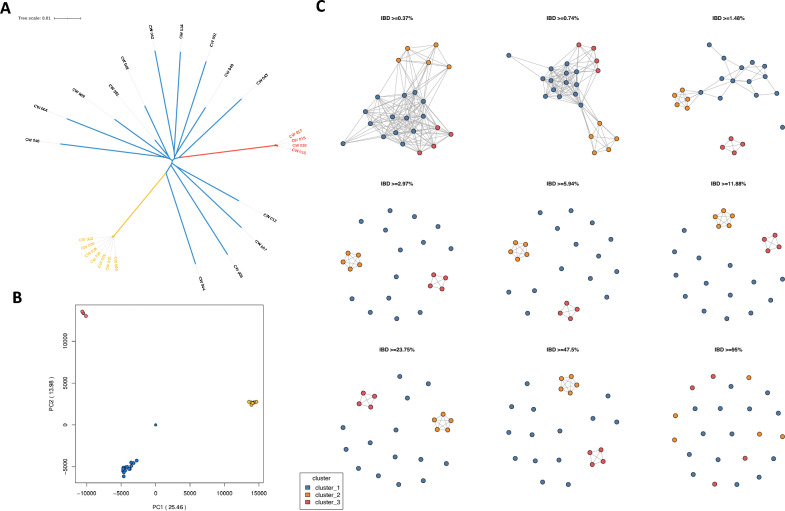
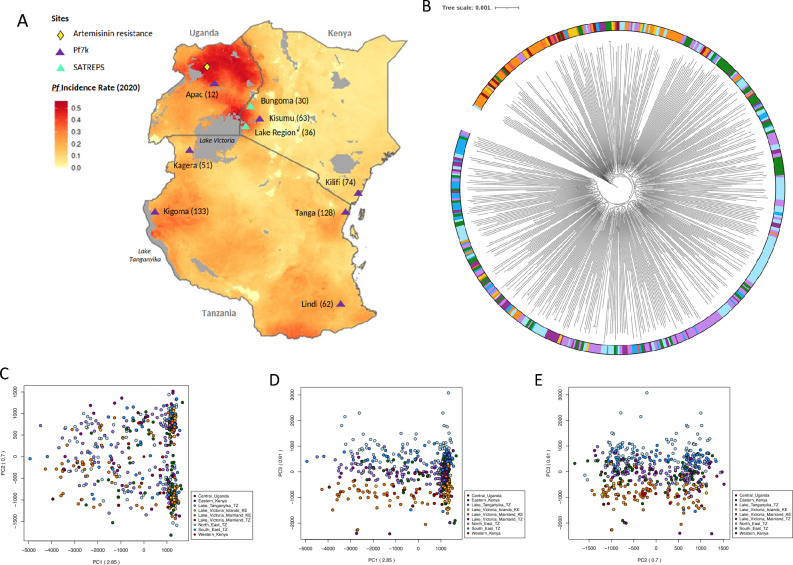
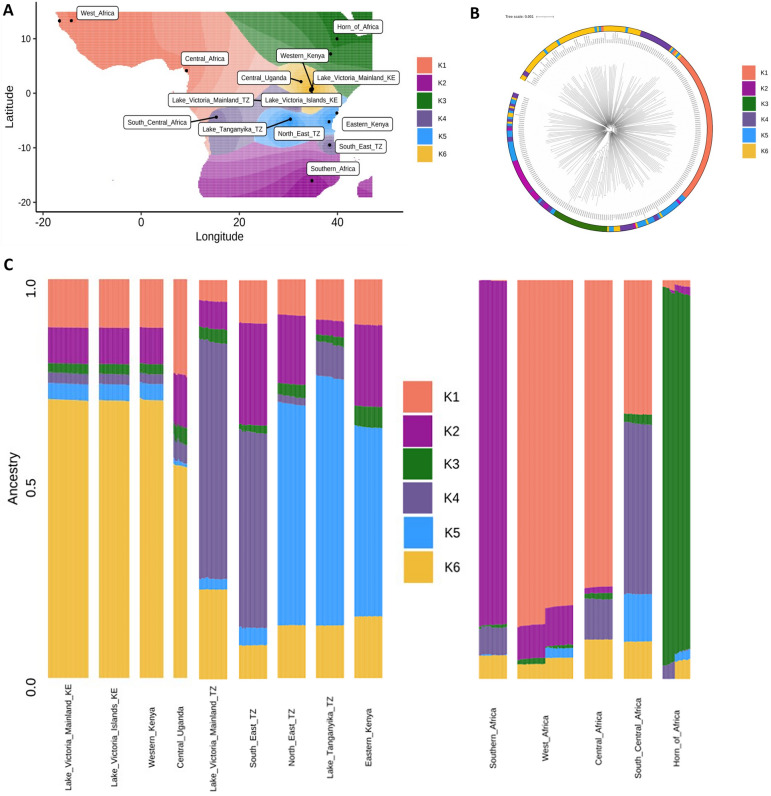
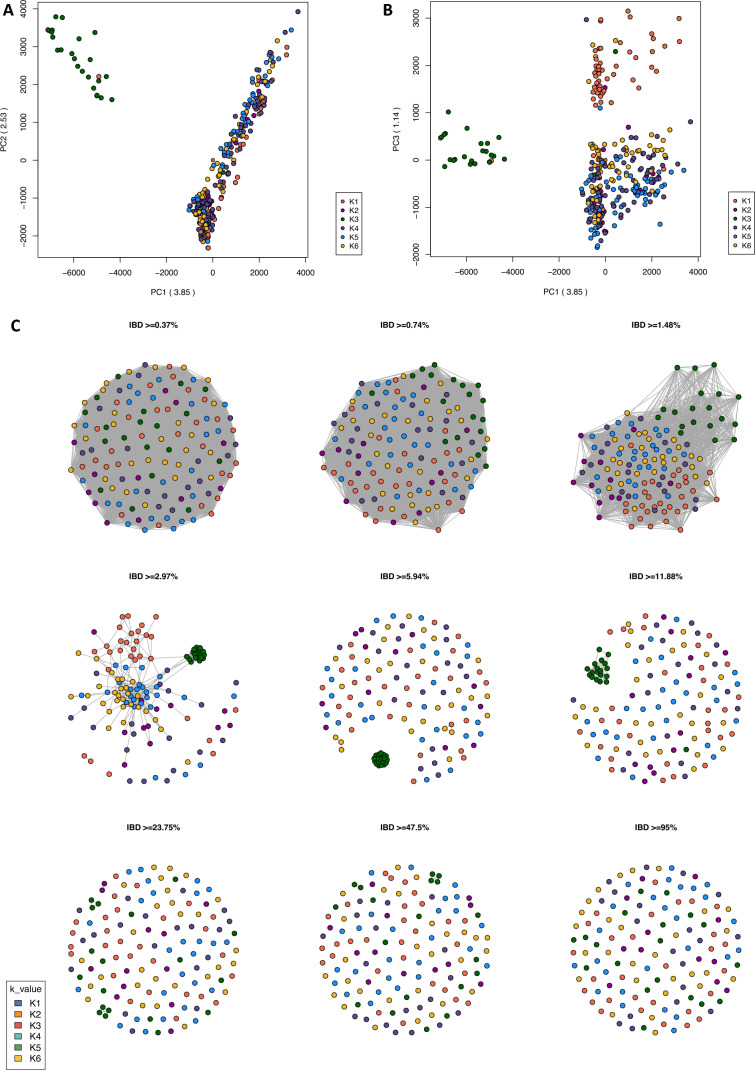
East African countries accounted for ~ 10% of all malaria prevalence worldwide in 2022, with an estimated 23.8 million cases and > 53,000 deaths. Despite recent increases in malaria incidence, high-resolution genome-wide analyses of Plasmodium parasite populations are sparse in Kenya, Tanzania, and Uganda. The Kenyan-Ugandan border region is a particular concern, with Uganda confirming the emergence and spread of artemisinin resistant P. falciparum parasites. To establish genomic surveillance along the Kenyan-Ugandan border and analyse P. falciparum population dynamics within East Africa, we generated whole-genome sequencing (WGS) data for 38 parasites from Bungoma, Western Kenya. These sequences were integrated into a genomic analysis of available East African isolate data (n = 599) and revealed parasite subpopulations with distinct genetic structure and diverse ancestral origins. Ancestral admixture analysis of these subpopulations alongside isolates from across Africa (n = 365) suggested potential independent ancestral populations from other major African populations. Within isolates from Western Kenya, the prevalence of biomarkers associated with chloroquine resistance (e.g. Pfcrt K76T) were significantly reduced compared to wider East African populations and a single isolate contained the PfK13 V568I variant, potentially linked to reduced susceptibility to artemisinin. Overall, our work provides baseline WGS data and analysis for future malaria genomic surveillance in the region.


Conflict of interest statement

The authors declare no competing interests.

Figures

Figure 1
Figure 1
Population structure of P. falciparum isolates from highland epidemic outbreaks in Western Kenya. (A) Maximum likelihood tree of 30 isolates from Western Kenya (284,667 genome-wide SNPs). (B) PCA of the genetic pairwise matrix used to generate the maximum likelihood tree, with clusters coloured accordingly. (C) Pairwise identity-by-descent (IBD) connectivity plots between clusters, highlighting high levels of IBD (IBD > 47.5%) between clusters in Western Kenya.
Figure 2
Figure 2
Genomic structure of P. falciparum isolates from East Africa form subpopulations. (A) Heatmap of P. falciparum incidence rates in 2020 across Kenya, Tanzania and Uganda with sampling sites and artemisinin resistance locations annotated (generated using malariaAtlas R-software). (B) A maximum likelihood tree for 587 isolates from Central Uganda, Eastern Kenya, Lake Victoria, Lake Tanganyika, North East Tanzania, South East Tanzania, and Western Kenya, based on 710,552 high-quality genome-wide SNPs. (C, D, and E) Principal component analysis (PCA) of East African subpopulations, showing the separation of isolates in PCs 1, 2, and 3.
Figure 3
Figure 3
Genome-wide ancestral admixture analysis of East African P. falciparum subpopulations and regional parasite populations from across Africa. (A) Geographic map displaying ancestry coefficients, where K is estimated to represent 6 distinct ancestral populations across Africa. (B) Maximum likelihood tree of 363 isolates, based on 640,596 genome-wide SNPs, coloured according to their predominant K proportion. (C) Barplot showing ancestry proportions for each isolate (rows) within each subpopulation (columns).
Figure 4
Figure 4
Connectivity between African P. falciparum ancestral populations. (A, B) Principal component analysis (PCA) generated based on pairwise genetic distance matrices of 640,596 high-quality genome-wide SNPs from 363 P. falciparum isolates. (C) Pairwise identity-by-descent (IBD) connectivity plots for isolates with an Fws value > 0.90 (n = 293).

References

    1. Geneva: World Health Organization (2022) World malaria report 2022. Licence: CC BY-NC-SA 3.0 IGO
    1. Weiss, D. J. et al. Indirect effects of the COVID-19 pandemic on malaria intervention coverage, morbidity, and mortality in Africa: A geospatial modelling analysis. Lancet. Infect. Dis21, 59–69 (2021). 10.1016/S1473-3099(20)30700-3 - DOI - PMC - PubMed
    1. Antinori, S., Galimberti, L., Milazzo, L. & Corbellino, M. Biology of human malaria plasmodia including Plasmodium knowlesi. Mediterr. J. Hematol. Infect. Dis.10.4084/MJHID.2012.013 (2012). 10.4084/MJHID.2012.013 - DOI - PMC - PubMed
    1. Kagaya, W. et al. Malaria resurgence after significant reduction by mass drug administration on Ngodhe Island, Kenya. Sci. Rep.9, 1–11 (2019). 10.1038/s41598-019-55437-8 - DOI - PMC - PubMed
    1. Osborne, A. et al. Characterizing the genomic variation and population dynamics of Plasmodium falciparum malaria parasites in and around Lake Victoria Kenya. Sci. Rep.11, 19809 (2021). 10.1038/s41598-021-99192-1 - DOI - PMC - PubMed

LinkOut - more resources