. 2024 Aug 5;14(1):18126.
doi: 10.1038/s41598-024-68868-9.

Metabolic adaptations underpin high productivity rates in relict subsurface water

Affiliations

Metabolic adaptations underpin high productivity rates in relict subsurface water

Betzabe Atencio et al. Sci Rep. .

Abstract

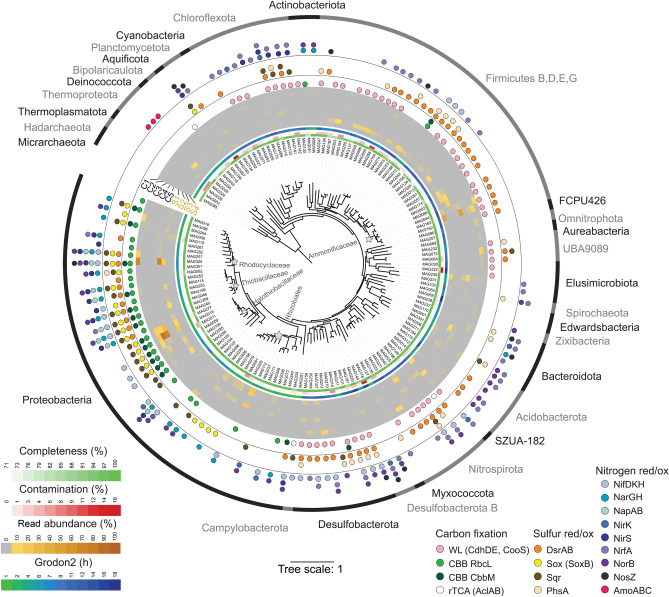
Groundwater aquifers are ecological hotspots with diverse microbes essential for biogeochemical cycles. Their ecophysiology has seldom been studied on a basin scale. In particular, our knowledge of chemosynthesis in the deep aquifers where temperatures reach 60 °C, is limited. Here, we investigated the diversity, activity, and metabolic potential of microbial communities from nine wells reaching ancient groundwater beneath Israel's Negev Desert, spanning two significant, deep (up to 1.5 km) aquifers, the Judea Group carbonate and Kurnub Group Nubian sandstone that contain fresh to brackish, hypoxic to anoxic water. We estimated chemosynthetic productivity rates ranging from 0.55 ± 0.06 to 0.82 ± 0.07 µg C L-1 d-1 (mean ± SD), suggesting that aquifer productivity may be underestimated. We showed that 60% of MAGs harbored genes for autotrophic pathways, mainly the Calvin-Benson-Bassham cycle and the Wood-Ljungdahl pathway, indicating a substantial chemosynthetic capacity within these microbial communities. We emphasize the potential metabolic versatility in the deep subsurface, enabling efficient carbon and energy use. This study set a precedent for global aquifer exploration, like the Nubian Sandstone Aquifer System in the Arabian and Western Deserts, and reconsiders their role as carbon sinks.

Keywords: Ancient groundwater; Carbon fixation; Deep terrestrial subsurface; Metagenomics; Primary production.


Conflict of interest statement

The authors declare no competing interests.

Figures

Figure 1
Figure 1
(a and b) Location of wells tapping the sandstone and overlying carbonate aquifers (S and C wells, respectively) along the eastern groundwater flow path (purple arrows) stretching from the southern central Sinai, through the eastern Negev Desert toward the outlet south of the Dead Sea. Also shown are sandstone and carbonate outcrops (orange and light blue shades, respectively) and major geological faults (gray lines) over the Negev Desert. Numbers in panel a indicate some of the major geological anticlines in the studied area: (1) Ramon, (2) Hatira, and (3) Hatzera. 81Kr ages,reported in thousands of years, are shown in panel b following previous studies–,. The four flow segments discussed in this paper are annotated as I (Shizafon), II (Paran), III (Zofar), and IV (Ein Yahav). (c) A schematic cross-section A–A' along the eastern flow path. Numbers designate δ18O values. amsl, above mean sea level. a and b generated with QGIS (https://www.qgis.org/). Geographic Information System. Open Source Geospatial Foundation Project (https://www.osgeo.org/). Satellite imagery source: Esri, Maxar, GeoEye, Earthstar Geographics, CNES/Airbus DS, USDA, USGS, AeroGRID, IGN, and the GIS User Community.) (Satellite imagery source: Esri, Maxar, GeoEye, Earthstar Geographics, CNES/Airbus DS, USDA, USGS, AeroGRID, IGN, and the GIS User Community.)
Figure 2
Figure 2
The phylogeny, diversity, and key functions of bacteria and archaea in sandstone and carbonate aquifers. The iTOL representation is based on the GTDB-tk marker gene set and treeing. Key metabolic pathways are indicated in different colors. A heat map shows the median read coverage of each metagenome-assembled genome (MAG) per sample site. MAGs representing the key lineages at the family level are highlighted in bold. Three MAGs were excluded from the tree due to insufficient marker gene hits (27—Riflebacteria, 189—Desulfotomaculaceae, and 217—Rhizobiales). Estimated growth rates for key lineages were calculated based on the Gordon 2 method in hours (h).
Figure 3
Figure 3
Key metabolic features of microbes in the carbonate aquifer (wells C1 to C5) and sandstone aquifer (wells S1-S4). The cumulative read abundance of metagenome-assembled genomes (MAGs) that encode: a carbon fixation; b hydrogenases; c nitrogen fixation and nitrification; d dissimilatory sulfur cycling. CBB—Calvin–Benson–Basham cycle; rTCA—reductive Krebs cycle; WL—Wood–Ljungdahl pathway; DSR/rDSR—dissimilatory sulfur metabolism. The stacked bar chart format presents the percentage of reads mapped to MAGs with these specific genes or pathways, showing the relative abundance of each metabolic feature in the aquifer samples.
Figure 4
Figure 4
Taxonomic affiliation of metabolic functions in the aquifer community. Key lineages are highlighted in colors. Vertex sizes correspond to the number of connections. Taxa are presented at the phylum level (only Gammaproteobacteria and Alphaproteobacteria are at the class level to display the marked differences within the Proteobacteria).
Figure 5
Figure 5
Metabolic reconstruction on the community scale along the eastern groundwater flow path of the two aquifers, iincluding some of the most abundant lineages colored and grouped by their taxonomic identity. The figure summarizes biogeochemical cycling processes (carbon, nitrogen, and sulfur cycles). Each arrow indicates a single step within the cycle; genomes involved in each stage are next to each arrow; some genes encoding key enzymes are also included. The pie plots represent the relative read abundances of selected MAGs across the sampling sites. Carbon-fixation pathways: CBB—Calvin–Benson–Basham cycle, (r)TCA—(reverse) Krebs cycle. Wells from the sandstone (orange) and carbonate (blue) aquifers are shown.

References

    1. Bar-On, Y. M., Phillips, R. & Milo, R. The biomass distribution on Earth. Proc. Natl. Acad. Sci. USA115(25), 6506–6511. 10.1073/pnas.1711842115 (2018). 10.1073/pnas.1711842115 - DOI - PMC - PubMed
    1. Magnabosco, C. et al. The biomass and biodiversity of the continental subsurface. Nat. Geosci.11(10), 707–717. 10.1038/s41561-018-0221-6 (2018). 10.1038/s41561-018-0221-6 - DOI
    1. Miettinen, H. et al. Microbiome composition and geochemical characteristics of deep subsurface high-pressure environment Pyhäsalmi mine Finland. Front. Microbiol.6, 1203. 10.3389/fmicb.2015.01203 (2015). 10.3389/fmicb.2015.01203 - DOI - PMC - PubMed
    1. Itävaara, M. et al. Characterization of bacterial diversity to a depth of 1500m in the Outokumpu deep borehole, Fennoscandian Shield. FEMS Microbiol. Ecol.77(2), 295–309. 10.1111/j.1574-6941.2011.01111.x (2011). 10.1111/j.1574-6941.2011.01111.x - DOI - PubMed
    1. Ragon, M., Van Driessche, A. E. S., García-Ruíz, J. M., Moreira, D. & López-García, P. Microbial diversity in the deep-subsurface hydrothermal aquifer feeding the giant gypsum crystal-bearing Naica Mine Mexico. Front. Microbiol.4, 37. 10.3389/fmicb.2013.00037 (2013). 10.3389/fmicb.2013.00037 - DOI - PMC - PubMed

LinkOut - more resources