. 2024 Aug 6;14(1):18156.
doi: 10.1038/s41598-024-69284-9.

A comprehensive single-cell RNA transcriptomic analysis identifies a unique SPP1+ macrophages subgroup in aging skeletal muscle

Affiliations

A comprehensive single-cell RNA transcriptomic analysis identifies a unique SPP1+ macrophages subgroup in aging skeletal muscle

Wen Bi et al. Sci Rep. .

Abstract

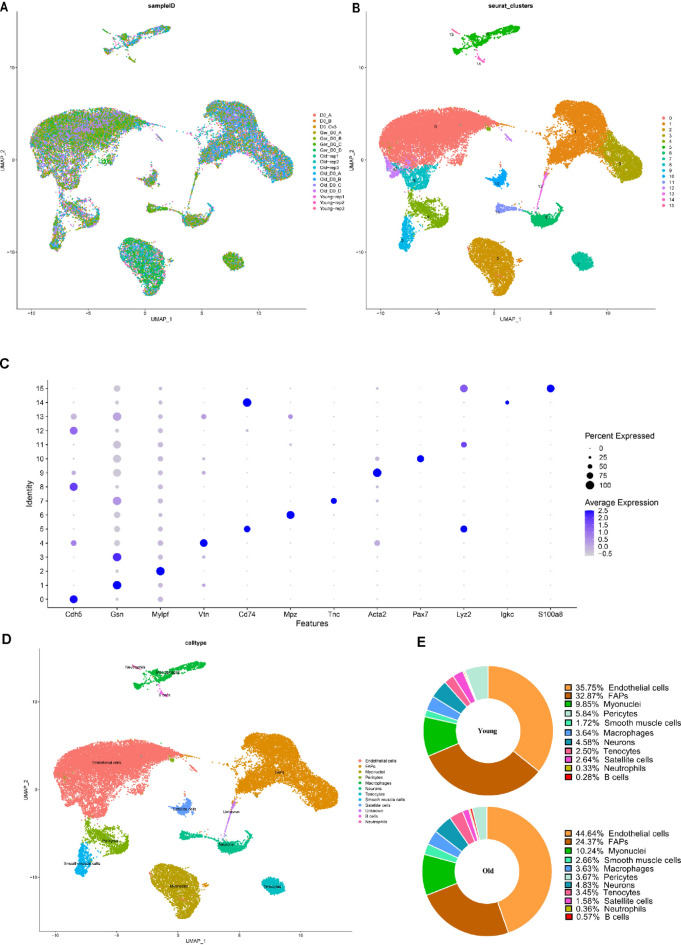
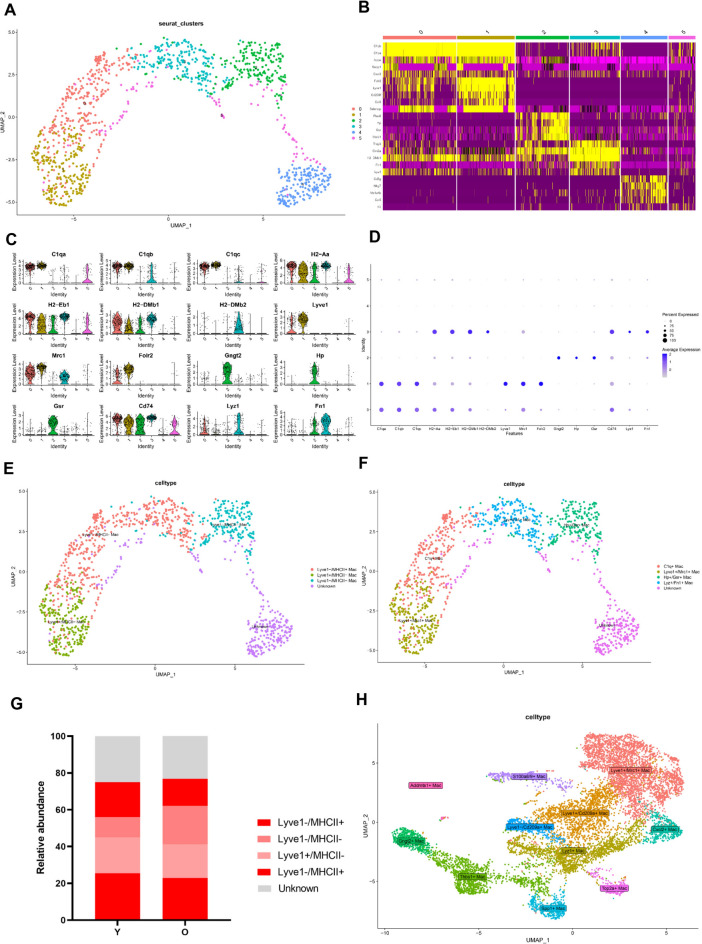
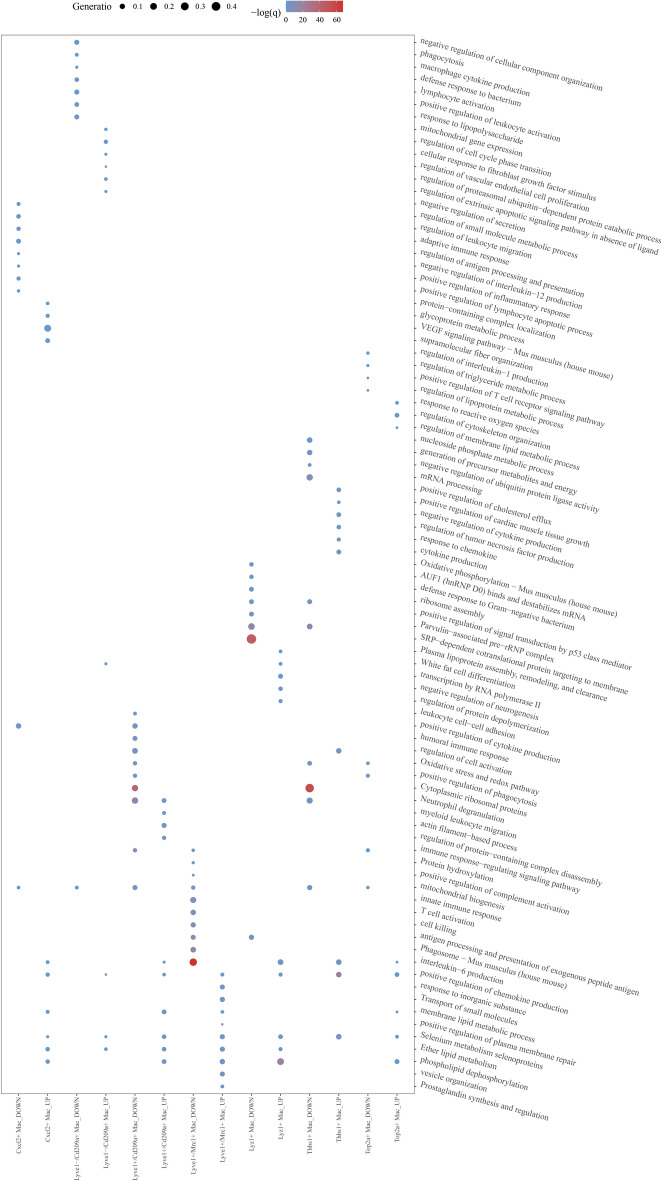
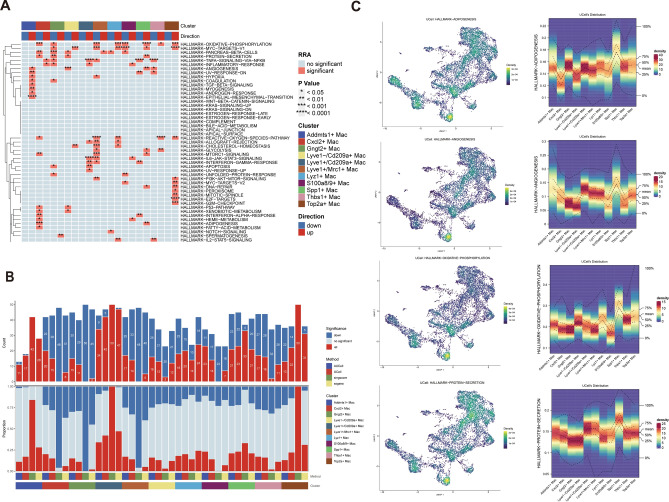
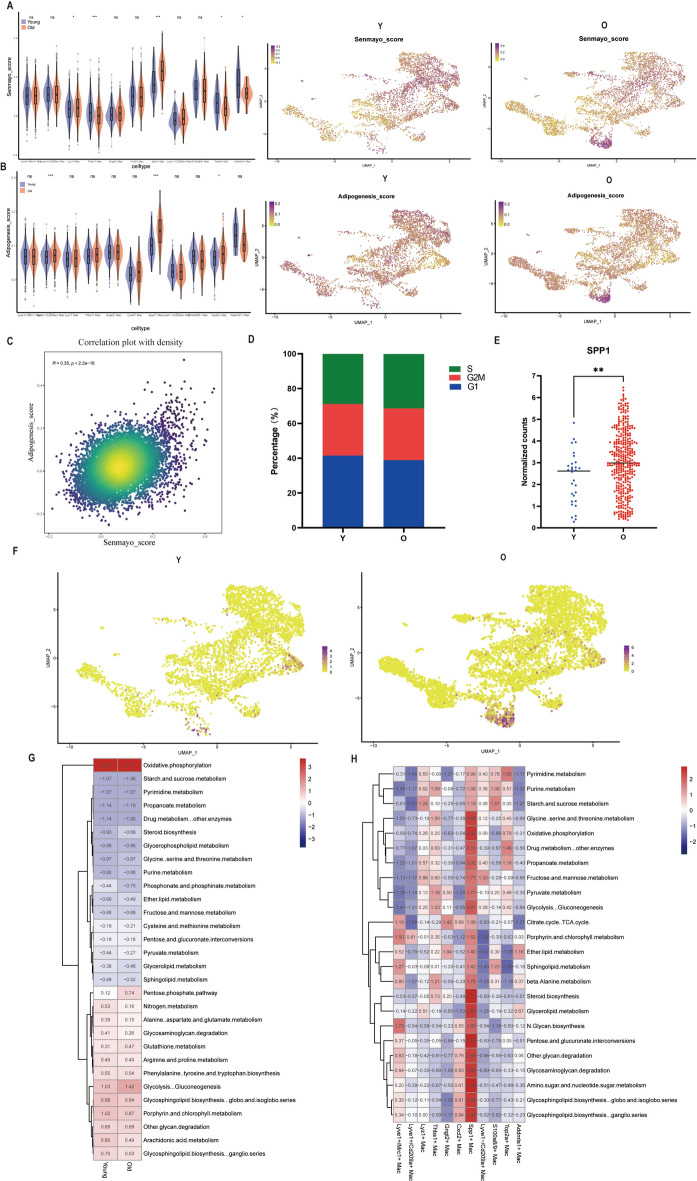
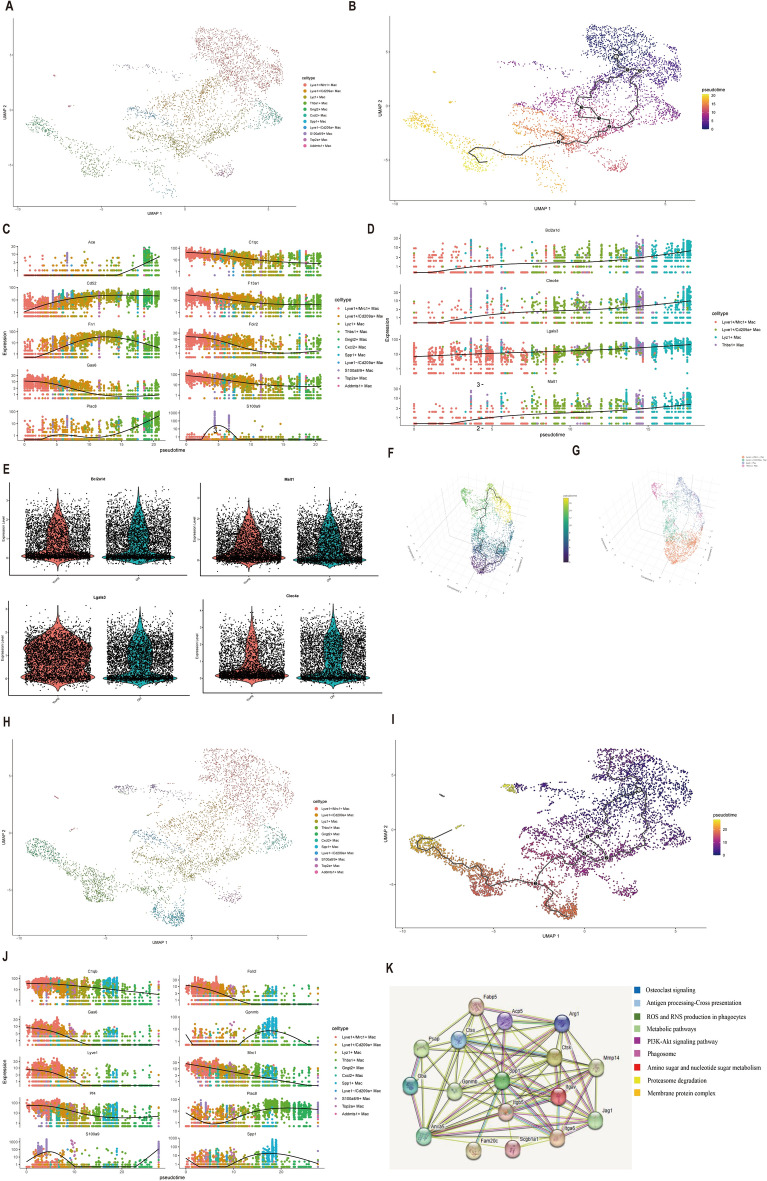
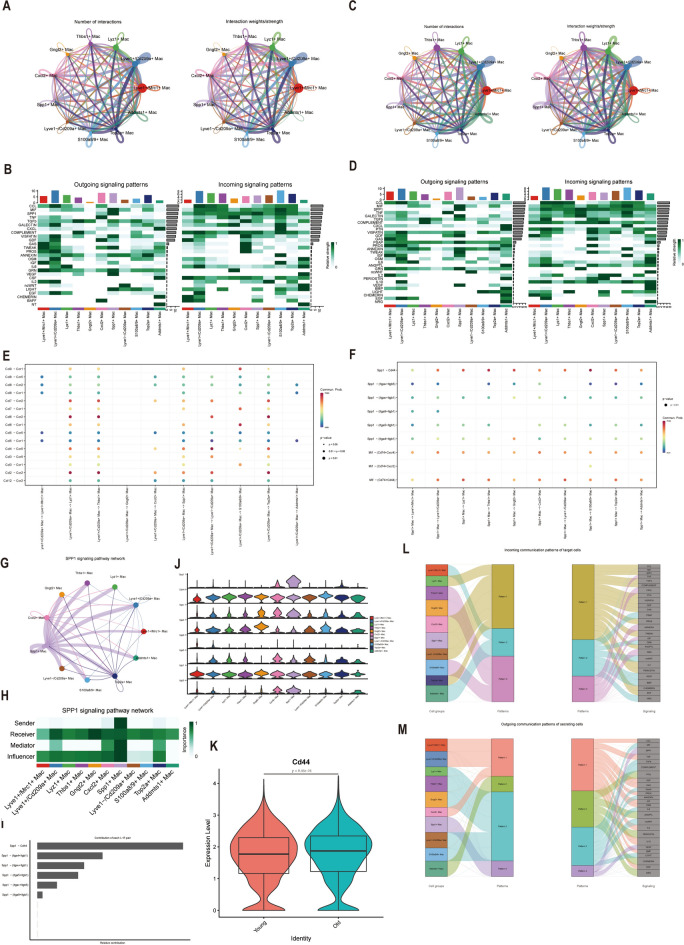
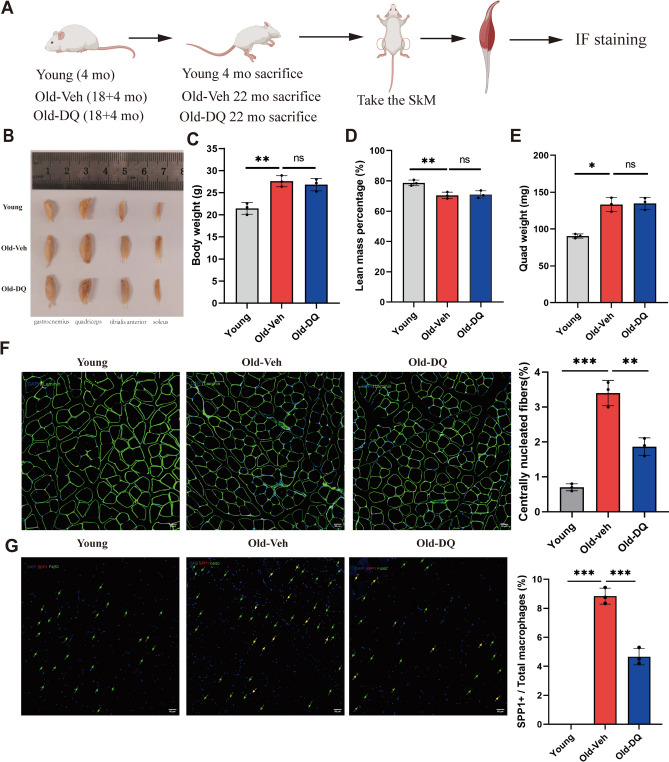
Senescence of skeletal muscle (SkM) has been a primary contributor to senior weakness and disability in recent years. The gradually declining SkM function associated with senescence has recently been connected to an imbalance between damage and repair. Macrophages (Mac) are involved in SkM aging, and different macrophage subgroups hold different biological functions. Through comprehensive single-cell transcriptomic analysis, we first compared the metabolic pathways and biological functions of different types of cells in young (Y) and old (O) mice SkM. Strikingly, the Mac population in mice SkM was also explored, and we identified a unique Mac subgroup in O SkM characterized by highly expressed SPP1 with strong senescence and adipogenesis features. Further work was carried out on the metabolic and biological processes for these Mac subgroups. Besides, we verified that the proportion of the SPP1+ Mac was increased significantly in the quadriceps tissues of O mice, and the senotherapeutic drug combination dasatinib + quercetin (D + Q) could dramatically reduce its proportion. Our study provides novel insight into the potential role of SPP1+ Mac in SkM, which may serve as a senotherapeutic target in SkM aging.

Keywords: Cell senescence; SPP1+ macrophages; Senolytics; Single-cell sequencing; Skeletal muscle.


Conflict of interest statement

The authors declare no competing interests.

Figures

Figure 1
Figure 1
Integration with Harmony method. (A) Skeletal muscle samples from 6 young, 7 old, and 4 geriatric mice were integrated with the Harmony method. (B) 16 clusters were recognized by Seurat 5.0.1. (C) Bubble plot showing the canonical markers of each cell type. (D) UMAP plot depicting the cell type in skeletal muscle. (E) Relative abundance of distinct cell types at different age in mice SkM.
Figure 2
Figure 2
Subclusters of macrophages and marker genes of each cluster in mice SkM. (A) The UMAP plot of the six identified clusters. (B) The heatmap, violin plot (C) and the dot plot (D) showing the representative markers across six clusters. (E) The UMAP plot illustrating the macrophages subgroups based on the Lyve1/MHCII expression levels and (F) their marker genes. (G) The relative abundance of macrophages subgroups in young and old mice SkM based on Lyve1/MHCII classification. (H) The UMAP plot representing 11 distinct SkM macrophages subgroups based on marker genes in GSE195507.
Figure 3
Figure 3
The dot plot exhibiting the homogeneity and heterogeneity in SkM macrophages subpopulations in Y and O mice.
Figure 4
Figure 4
Comprehensive enrichment analysis of different subpopulations of mice SkM macrophages. (A) Functional enrichment analysis of gene signature from GSEA. (B) The bar plot illustrating the number and proportion of up, down and no significant genes with 4 distinct methods. (C) Density scatterplots and density heatmaps exhibiting representative up or down-regulated pathways.
Figure 5
Figure 5
Characterization of SPP1+ macrophages in mice SkM. (A) The violin plot and the UMAP plot showing the distinction in Senmayo score in subgroups of mice young and old SkM macrophages. (B) The violin plot and the UMAP plot showing the distinction in adipogenesis score in subgroups of mice Y and O SkM macrophages. (C) The correlation plot exhibiting relation between adipogenesis and cellular senescence. (D) The bar plot showing the proportion of cell cycle in SkM macrophages of Y and O mice. (E) Comparison of SPP1 expression level in SPP1+ macrophages of Y and O mice SkM using scatterplot. (F) SPP1 expression level in SkM macrophages in Y and O mice using UMAP plot. (G) The heatmap showing metabolic pathway between Y and O macrophages of mice SkM. (H) The heatmap showing metabolic pathways in distinct macrophages subgroups of mice SkM. Y, young. O, old. SkM, skeletal muscle.
Figure 6
Figure 6
Pseudo-time analysis of SkM macrophages in mice. (A) UMAP plot exhibited SkM macrophage subpopulations of Y mice. (B) UMAP presenting pseudo-time trajectory of macrophages from Y mice SkM using Monocle 3. (C) Changes of canonical genes expressions in Y SkM macrophages along the pseudo-time trajectory. (D) Scatter plot showing the expression trend of genes related to the immune response-regulating signaling pathway. (E) Violin plot showing the expressions of Bcl2a1d, malt1, Lgals3, Clec4e in SkM macrophages of aging mice. (F) 3D Scatterplot representing Lyve1+/Mrc1+ Mac, Lyve1+/Cd209a+ Mac, Lyz1+ Mac, and Thbs1+ Mac. (G) 3D Scatterplot showing pseudo-time trajectory in Lyve1+/Mrc1+ Mac, Lyve1+ /Cd209a+ Mac, Lyz1+ Mac, and Thbs1+ Mac. (H) UMAP illustrates different SkM macrophage subpopulations in O mice with Monocle 3. (I) UMAP presents the pseudo-time trajectory of macrophages from aging mice SkM using Monocle 3. (J) Changes of canonical genes expressions in O SkM macrophages along the pseudo-time trajectory. (K) PPI network of SPP1 co-regulated genes. 3D, three-dimension; Y, young; O, old.
Figure 7
Figure 7
Developmental relationships and communication of SkM macrophages in Y and O mice. (A) The quantity and strength of signals for SkM macrophage subgroups in Y mice. (B) Comparison of the intensity of enriched outgoing and incoming signals in Mac subgroups from Y mice SkM. (C) The quantity and strength of signals for SkM macrophage subgroups in O mice. (D) Comparison of the intensity of enriched outgoing and incoming signals in Mac subgroups from O mice SkM. (E) L-R interaction contributions in signals emitted by Lyve1+/Cd209a+ Mac. (F) L-R interaction contributions in signals emitted by SPP1+ Mac. (G) Exhibition of SPP1 signaling pathway between distinct macrophage subgroups of mice SkM using circle plot. (H) Investigation of the function of distinct SkM macrophage subgroups in the SPP1 signaling pathway. (I) Exhibition of each L-R pair’s contribution in SPP1 signaling pathway using the bar plot. (J) Illustration of SPP1 signaling pathway-associated genes expressions in SkM macrophage subgroups via the violin plot. (K) Comparison of CD44 expression level in SPP1+ macrophages of Y and O mice SkM using a scatterplot. (L, M) Alluvial plot of targeted cells’ incoming and outgoing communication patterns. L-R, ligand-receptor. Y, young. O, old. Mac, macrophages.
Figure 8
Figure 8
SPP1+ macrophages were increased in SkM of the aging mice model, and senolytics decreased its proportion in vivo. (A) The diagram presents the experimental process. (BE) Illustration of the gastrocnemius, quadriceps, tibialis anterior, and soleus in young, Old-Veh, and Old-DQ male mice group (B). Comparison of body weight (C), lean mass percentage (D), and quadriceps muscle weight (E) between distinct groups (n = 3 per group). (F) IF pictures of quadriceps cross-sections stained for Laminin in different groups. (G) Confocal microscopy of quadriceps IF staining exhibited F4/80 (green) positive and SPP1 (red) double positive (yellow arrows) SPP1+ macrophages in quadriceps of different groups (n = 3 per group). IF, immunofluorescence. SkM, skeletal muscle. Ns, no significant *, **, *** represent p value less than 0.05, 0.01, 0.001 respectively. Y, young; O, old.

Similar articles

Cited by

References

    1. Chen, X. et al. The path to healthy ageing in China: A Peking University-lancet commission. Lancet (London, England)400(10367), 1967–2006 (2022). 10.1016/S0140-6736(22)01546-X - DOI - PMC - PubMed
    1. Hayes, N., Fogarty, M., Sadofsky, L. & Jones, H. S. Physiologically-obtainable polyphenol exposures modulate reactive oxygen and nitrogen species signaling in the C2C12 model of skeletal muscle ageing. Eur. J. Pharmacol.941, 175511 (2023). 10.1016/j.ejphar.2023.175511 - DOI - PubMed
    1. Jung, H. J., Lee, K. P., Kwon, K. S. & Suh, Y. MicroRNAs in skeletal muscle aging: Current issues and perspectives. J. Gerontol. A Biol. Sci. Med. Sci.74(7), 1008–1014 (2019). 10.1093/gerona/gly207 - DOI - PMC - PubMed
    1. Fukada, K. & Kajiya, K. Age-related structural alterations of skeletal muscles and associated capillaries. Angiogenesis23(2), 79–82 (2020). 10.1007/s10456-020-09705-1 - DOI - PubMed
    1. Cui, C. Y. et al. Skewed macrophage polarization in aging skeletal muscle. Aging Cell18(6), e13032 (2019). 10.1111/acel.13032 - DOI - PMC - PubMed