. 2024 Aug 5;14(1):18148.
doi: 10.1038/s41598-024-68026-1.

Urine biomarkers can predict prostate cancer and PI-RADS score prior to biopsy

Affiliations

Urine biomarkers can predict prostate cancer and PI-RADS score prior to biopsy

Blaz Pavlovic et al. Sci Rep. .

Abstract

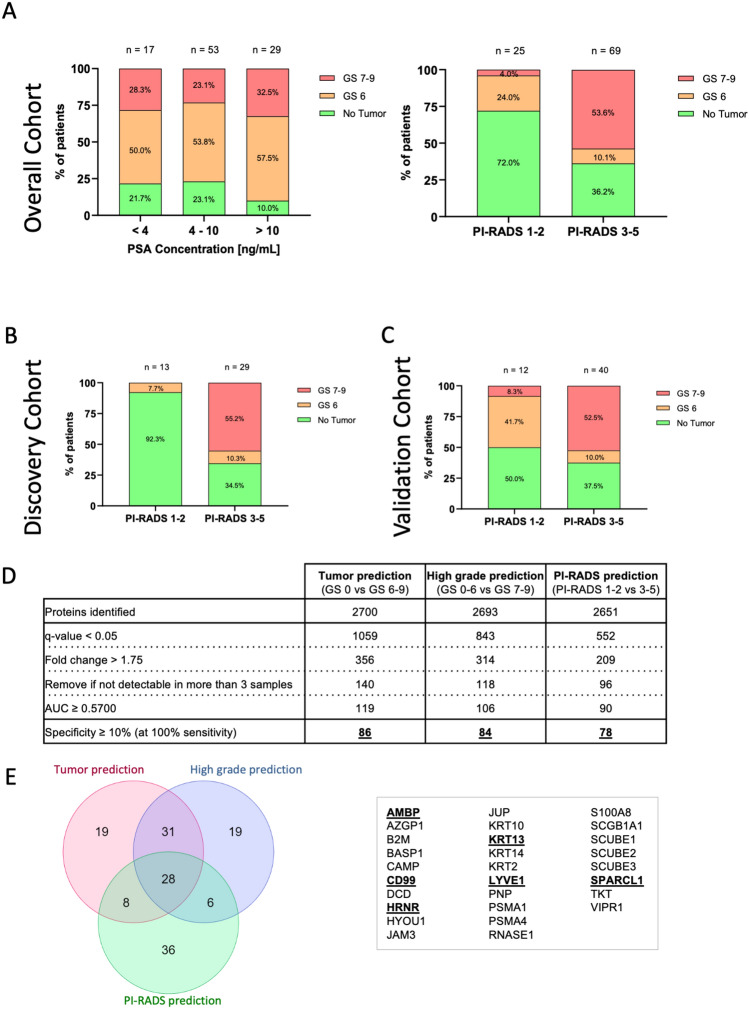
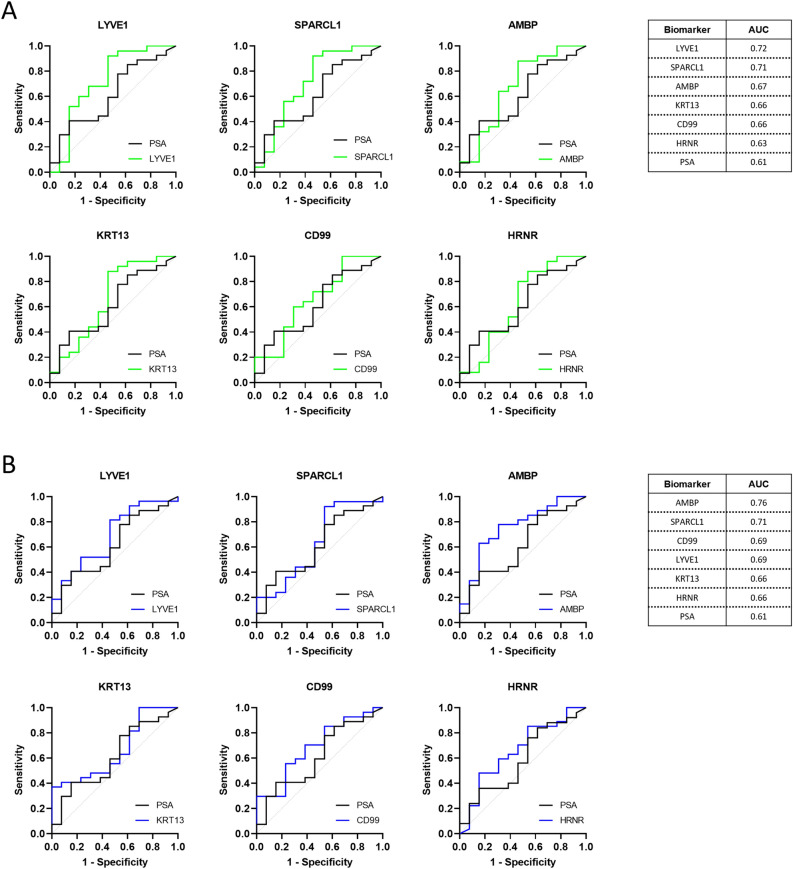
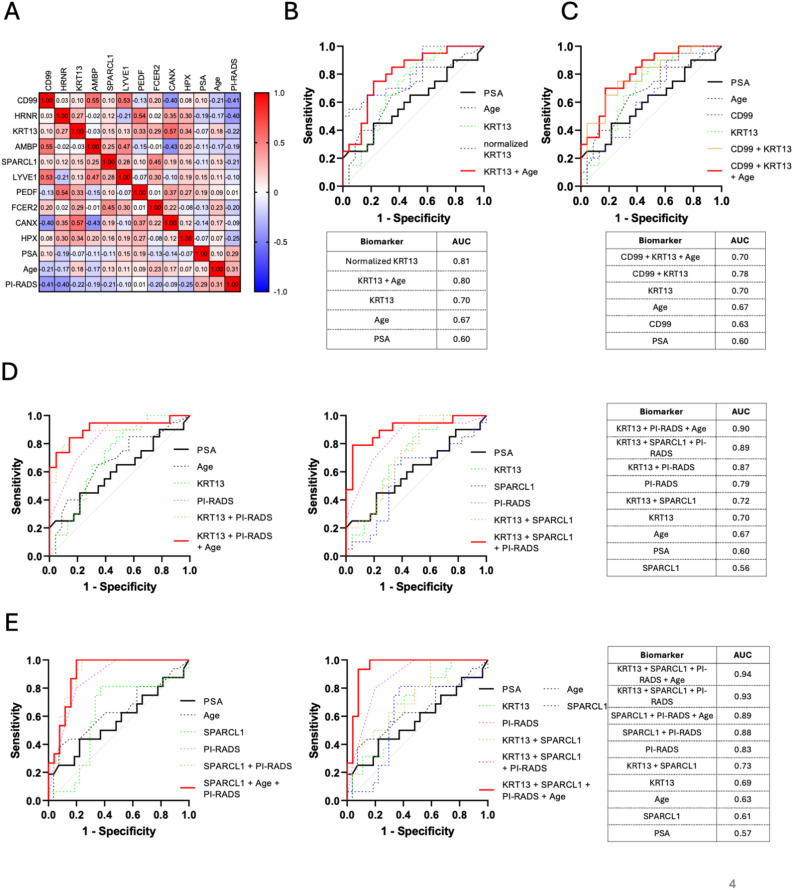
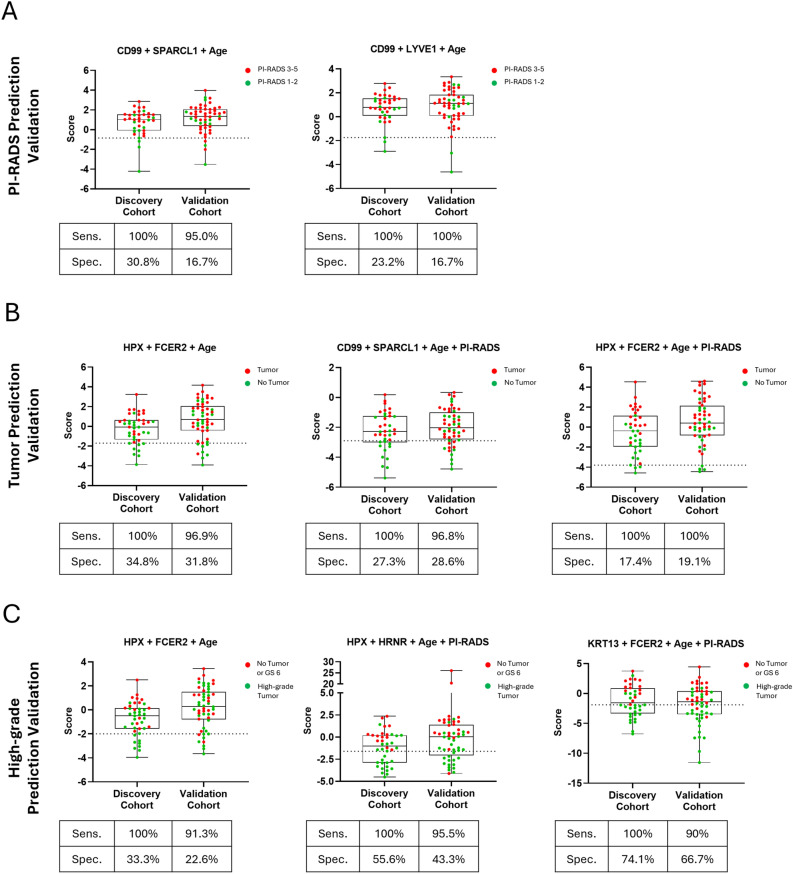
Prostate-Specific Antigen (PSA) based screening of prostate cancer (PCa) needs refinement. The aim of this study was the identification of urinary biomarkers to predict the Prostate Imaging-Reporting and Data System (PI-RADS) score and the presence of PCa prior to prostate biopsy. Urine samples from patients with elevated PSA were collected prior to prostate biopsy (cohort = 99). The re-analysis of mass spectrometry data from 45 samples was performed to identify urinary biomarkers to predict the PI-RADS score and the presence of PCa. The most promising candidates, i.e. SPARC-like protein 1 (SPARCL1), Lymphatic vessel endothelial hyaluronan receptor 1 (LYVE1), Alpha-1-microglobulin/bikunin precursor (AMBP), keratin 13 (KRT13), cluster of differentiation 99 (CD99) and hornerin (HRNR), were quantified by ELISA and validated in an independent cohort of 54 samples. Various biomarker combinations showed the ability to predict the PI-RADS score (AUC = 0.79). In combination with the PI-RADS score, the biomarkers improve the detection of prostate carcinoma-free men (AUC = 0.89) and of those with clinically significant PCa (AUC = 0.93). We have uncovered the potential of urinary biomarkers for a test that allows a more stringent prioritization of mpMRI use and improves the decision criteria for prostate biopsy, minimizing patient burden by decreasing the number of unnecessary prostate biopsies.

Keywords: Early detection; Non-invasive; PI-RADS score; PSA; Prostate biopsy; Prostate cancer; Prostate specific antigen; Screening of prostate cancer; Urinary biomarker; mpMRI.


Conflict of interest statement

Patents: This study was submitted for patent application (applicant: University of Zürich; inventors: I. Banzola, N. Alijaj, B. Pavlovic, D. Eberli). The patent application was submitted to the European patent office (application number: PCT/EP2022/086491). Conflicts of interest: N.J.R. discloses an advisory board function and receipt of honoraria from F. Hoffmann-La Roche AG. This study was submitted for patent application (applicant: University of Zürich; inventors: I. Banzola, N. Alijaj, B. Pavlovic, D. Eberli). The patent application was submitted to the European patent office (PCT/EP2022/086491). I. Banzola is founder and CEO of ONtrack Biomedical AG, a spin-off company of the University of Zurich and University Hospital Zurich, dedicated to developing PCa diagnostics. D. Eberli is also a founder of ONtrack Biomedical AG. Other authors do not have any conflict of interest.

Figures

Figure 1
Figure 1
Identification of six putative urinary biomarkers by mass spectrometry for the identification of all grades or clinically significant PCa and for prediction of PI-RADS scores. (A) Left: GS distribution divided in the different groups according to PSA values (cohort of 99 patients). Right: GS distribution divided by the Pi-RADS score groups. mpMRI was performed on 94 out of the 99 patients. (B) Results of the PI-RADS scores. mpMRI was performed on 42 out of the 45 patients of the discovery cohort. (C) Distribution of GS cases grouped by the PI-RADS scores in the validation cohort. mpMRI was performed on 52 out of the 54 patients of the validation cohort. (D) Table summarizing the biomarker selection process. (E) Venn diagram showing the distribution of the candidate biomarkers across the three prediction groups. Out of the 28 proteins shared between the three groups, 6 biomarkers were selected for further studies (AMBP, CD99, HRNR, KRT13, LYVE1 and SPARCL1).
Figure 2
Figure 2
Performance of the six candidate biomarkers for the prediction of the PI-RADS score in the discovery cohort. (A) Mass spectrometry quantification of the biomarkers AMBP, CD99, HRNR, KRT13, LYVE1 and SPARCL1 in the discovery cohort. Their performance in predicting the PI-RADS score was assessed with the receiver operating characteristic (ROC) analysis. (B) Validation of the candidate biomarkers with commercially available ELISA kits. The relative concentration of the biomarkers was normalized to two control molecules (CD44 and RNASE2) and results are represented as ROC curves.
Figure 3
Figure 3
Combinatorial analysis of the selected biomarkers for the detection of the PI-RADS score in the discovery cohort. (A) Correlation matrix by Spearman's rank test showing the correlation coefficients of the six biomarkers, age and serum PSA. (B) Multiple logistic regression analysis of the ELISA quantification for two possible biomarker combinations with patient age in the discovery cohort. Both combinations (red curves) showed higher diagnostic performances compared to single biomarkers and serum PSA.
Figure 4
Figure 4
Combinatorial analysis of the selected biomarkers for the detection of all grades and clinically significant prostate cancer (PCa) in the discovery cohort. (A) Correlation matrix by Spearman's rank test showing the correlation coefficients of the possible biomarkers, age serum PSA and PI-RADS score. The fact that PI-RADS has low correlation coefficients with the urinary biomarkers explains why the ranking of candidates is different when predicting PI-RADS and PCa, as different biomarkers have different ability to identify false positive and false negative results of the multiparametric-magnetic resonance imaging. (B) For the identification of all grades of PCa in the discovery cohort, the normalization or the combination of the single biomarkers with age markedly improves their performance (AUC) compared to serum PSA. (C) The performance of the biomarkers is further increased when two biomarkers are combined together. (D) The best performance for the identification of all grades of PCa is obtained with the addition of the PI-RADS score (left) or of the PI-RADS score and an additional biomarker (right) as variables in the combination. (E) Similarly, for the identification of GS 7–9 PCa in the discovery cohort, the addition of the PI-RADS score (left) or of the PI-RADS score and an additional biomarker (right) as variables leads to better performing biomarker combinations.
Figure 5
Figure 5
Visual representation of the validation method of selected biomarker combinations in an independent cohort. In order to evaluate the prediction potential of the biomarkers, the algorithms trained in the discovery cohort have been applied, at the values corresponding to the threshold of 100% sensitivity, to an independent validation cohort, and by calculating the resulting sensitivity and specificity. Below the threshold, the green dots represent True Negatives and the red the False Positives, above the threshold they represent the False Negatives and True Positives, respectively. In (A) two examples of algorithms predicting the PI-RADS score, in (B) three examples for all grades of PCa and (C) three examples for clinically significant PCa.
Figure 6
Figure 6
Immunohistochemical analysis of LYVE1, SPARCL1 and AMBP. (A) LYVE1, (B) SPARCL1 and (C) AMBP expression in three representative tissue samples. Overview: ×10 magnification; insets: ×40 magnification. Top inset: acinar adenocarcinoma/malignant prostatic glands; bottom inset (dashed lines): benign prostatic glands. Scale bars: overview 200 µm, inset 50 µm.

Similar articles

Cited by

References

    1. Draisma, G. et al. Lead times and overdetection due to prostate-specific antigen screening: Estimates from the European Randomized Study of Screening for Prostate Cancer. J. Natl. Cancer Inst.95(12), 868–878 (2003). 10.1093/jnci/95.12.868 - DOI - PubMed
    1. Walz, J. et al. Clinicians are poor raters of life-expectancy before radical prostatectomy or definitive radiotherapy for localized prostate cancer. BJU Int.100(6), 1254–1258 (2007). 10.1111/j.1464-410X.2007.07130.x - DOI - PubMed
    1. Loeb, S. et al. Overdiagnosis and overtreatment of prostate cancer. Eur. Urol.65(6), 1046–1055 (2014). 10.1016/j.eururo.2013.12.062 - DOI - PMC - PubMed
    1. Chun, F. K. et al. Significant upgrading affects a third of men diagnosed with prostate cancer: Predictive nomogram and internal validation. BJU Int.98(2), 329–334 (2006). 10.1111/j.1464-410X.2006.06262.x - DOI - PubMed
    1. Shariat, S. F., Kattan, M. W., Vickers, A. J., Karakiewicz, P. I. & Scardino, P. T. Critical review of prostate cancer predictive tools. Future Oncol.5(10), 1555–1584 (2009). 10.2217/fon.09.121 - DOI - PMC - PubMed

Substances