. 2024 Aug 5;14(1):18077.
doi: 10.1038/s41598-024-69139-3.

Insulin enhances acid-sensing ion channel currents in rat primary sensory neurons

Affiliations

Insulin enhances acid-sensing ion channel currents in rat primary sensory neurons

Zhong-Qing Xu et al. Sci Rep. .

Abstract

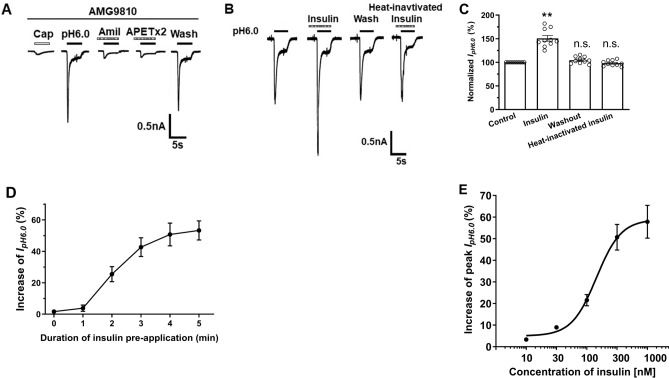
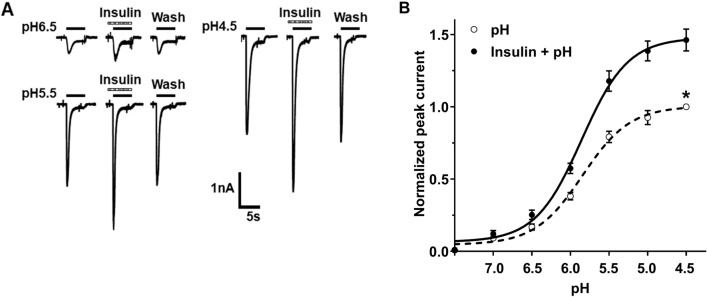
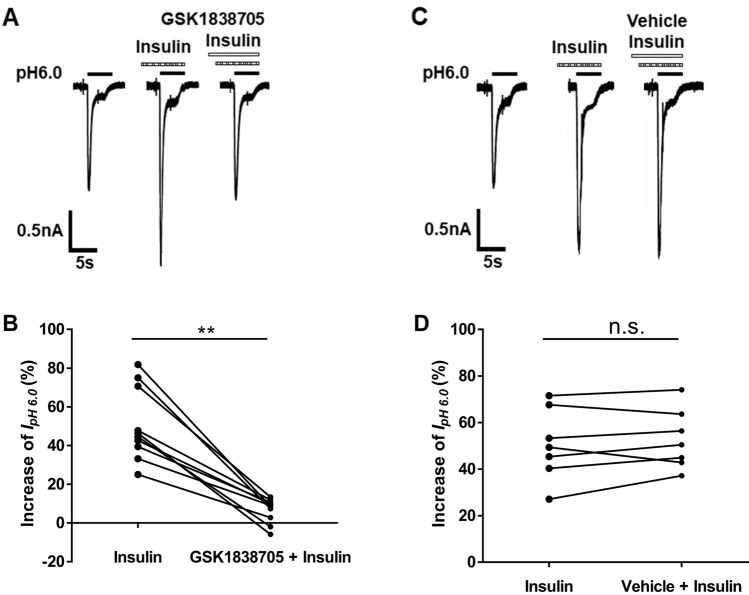
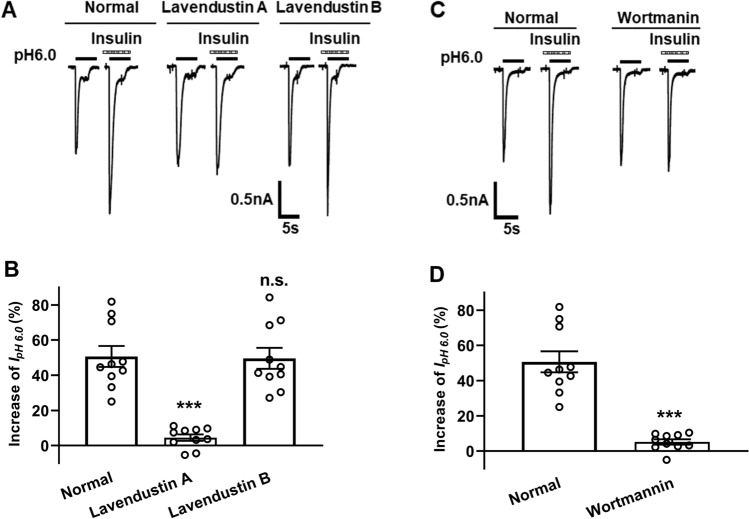
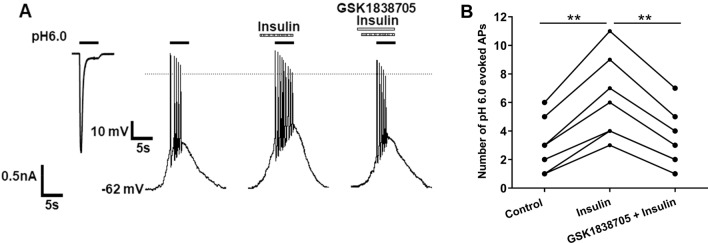
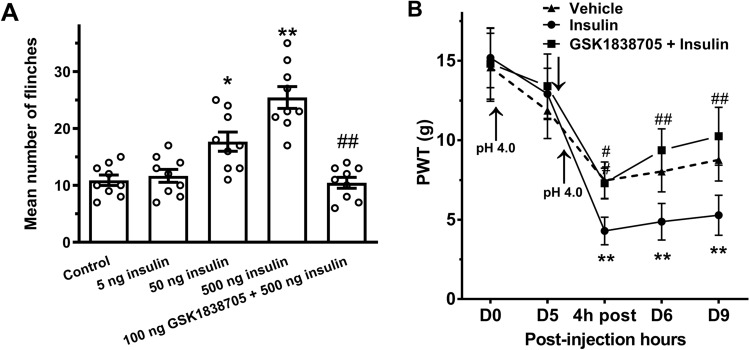
Insulin has been shown to modulate neuronal processes through insulin receptors. The ion channels located on neurons may be important targets for insulin/insulin receptor signaling. Both insulin receptors and acid-sensing ion channels (ASICs) are expressed in dorsal root ganglia (DRG) neurons. However, it is still unclear whether there is an interaction between them. Therefore, the purpose of this investigation was to determine the effects of insulin on the functional activity of ASICs. A 5 min application of insulin rapidly enhanced acid-evoked ASIC currents in rat DRG neurons in a concentration-dependent manner. Insulin shifted the concentration-response plot for ASIC currents upward, with an increase of 46.2 ± 7.6% in the maximal current response. The insulin-induced increase in ASIC currents was eliminated by the insulin receptor antagonist GSK1838705, the tyrosine kinase inhibitor lavendustin A, and the phosphatidylinositol-3 kinase antagonist wortmannin. Moreover, insulin increased the number of acid-triggered action potentials by activating insulin receptors. Finally, local administration of insulin exacerbated the spontaneous nociceptive behaviors induced by intraplantar acid injection and the mechanical hyperalgesia induced by intramuscular acid injections through peripheral insulin receptors. These results suggested that insulin/insulin receptor signaling enhanced the functional activity of ASICs via tyrosine kinase and phosphatidylinositol-3 kinase pathways. Our findings revealed that ASICs were targets in primary sensory neurons for insulin receptor signaling, which may underlie insulin modulation of pain.

Keywords: Acid-sensing ion channel; Current; Dorsal root ganglion neuron; Insulin; Nociceptive behavior.


Conflict of interest statement

The authors declare no competing interests.

Figures

Figure 1
Figure 1
Enhancement of ASIC currents by insulin in rat DRG neurons. (A) In the presence of 5 μM AMG9810, capsaicin (Cap, 100 nM) induced no membrane currents. However, a 5 s exposure of pH 6.0 acidic solution produced a rapid inward current (IpH6.0) in the same DRG neuron. The IpH6.0 was blocked by amiloride (Amil, 100 μM) and APETx2 (2 μM). (B) The IpH6.0 was enhanced by insulin pretreatment (300 nM for 5 min) and recovered after the washout of insulin. In contrast, the IpH6.0 was not affected by heat-inactivated insulin (300 nM). Insulin (300 nM) or heat-inactivated insulin (300 nM) was pre-applied to a recorded DRG cell for 5 min. (C) The bar graph shows that the amplitude of the IpH6.0 under different conditions. **p < 0.01, n.s., not significant, compared with the control. The data were analyzed by one-way ANOVA followed by Tukey’s post hoc test. n = 10 cells from 6 rats. (D) The enhancing effect of insulin (300 nM) on the IpH6.0 increased with increasing duration of insulin preapplication from 0 to 5 min. Each point represents the mean ± S.E.M. of 7–10 cells from 5–6 rats. (E) The graph shows the concentration-effect curve of insulin on IpH6.0 with an EC50 value of 142.6 ± 11.7 nM. Each point represents the mean ± S.E.M. of 8–10 cells from 5–6 rats.
Figure 2
Figure 2
Effects of insulin on the concentration–response curve for acidic stimuli. (A) Representative current traces showing that insulin pretreatment (300 nM for 5 min) enhanced the three ASICs currents stimulated by acidic solutions at pH 6.5, pH 5.5 and pH 4.5. (B) The graph shows that the concentration‒response curve for acid was shifted upward in the presence of 300 nM insulin, showing a significant increase in the normalized maximum response to acid. The curves were drawn according to the logistic equation I = Imax/[1 + (10^pH0.5/10^pH)n], where I is the normalized current response value, pH0.5 is the pH for half-maximal activation, and n is the Hill coefficient. All current values from the same cell were normalized to the current response, which was induced by pH 4.5 applied alone (marked with asterisk). Each point represents the mean ± S.E.M. of 8–10 cells from 5–6 rats.
Figure 3
Figure 3
Participation of insulin receptors in the insulin-mediated enhancement of ASIC currents. Representative current traces in (A and C) showing the recorded IpH6.0 in a DRG neuron under control, treatment with insulin (300 nM for 5 min) alone, co-treatment with insulin (300 nM for 5 min) and the insulin receptor antagonist GSK1838705 (20 nM for 6 min, A) or its vehicle (C) conditions. GSK1838705 or its vehicle was pre-applied to the recorded neuron for 1 min, and followed by coapplication with insulin for 5 min. The bar graph in (B and D) shows that the amplitude of the peak IpH6.0 was enhanced by the application of insulin (300 nM for 5 min) alone, and this effect was blocked by co-treatment with GSK1838705 (20 nM for 6 min), but not by co-treatment with vehicle (0.1%DMSO, v/v). ***p < 0.001, paired t-test, n = 10 cells from 6 rats; n.s., not significant, paired t-test, n = 7 cells from 4 rats.
Figure 4
Figure 4
Involvement of intracellular tyrosine kinase and PI3 kinase in the insulin-mediated enhancement of ASIC currents. The current traces in (A) and the bar graph in (B) show that the insulin (300 nM) mediated increase in ASIC currents was prevented by the tyrosine kinase inhibitor lavendustin A (5 μM), but not by its inactive analog lavendustin B (5 μM). ***p < 0.001, n.s., not significant, compared with the normal column. One-way ANOVA followed by Tukey's post hoc test. n = 10 cells from 6 rats in each column. The current traces in (C) and the bar graph in (D) show that IpH6.0 was enhanced by insulin (300 nM for 5 min) under conditions of normal internal solution, but not under conditions in which recording pipettes were filled with wortmannin (50 nM). ***p < 0.001, unpaired t-test, n = 10 cells from 6 rats in each column.
Figure 5
Figure 5
Potentiation of acid-triggered action potentials by insulin in rat DRG neurons. (A) In the presence of 5 μM AMG9810, an acid stimulus at pH 6.0 caused an inward current and action potentials (APs) in the same DRG cell under voltage-clamp and current-clamp conditions, respectively. The original traces in (A) and the graphs in (B) illustrate that the number of acid-triggered APs was increased by the application of insulin (300 nM for 5 min) alone. The enhancing effect of insulin was blocked by co-treatment with GSK1838705 (20 nM for 6 min). **p < 0.01, one-way ANOVA followed by Tukey's post hoc test, n = 7 cells from 5 rats.
Figure 6
Figure 6
Exacerbation of acid-induced nociceptive behaviors by insulin in rats. (A) Intraplantar injection of acetic acid (1%, 50 μl) resulted in significant flinching behaviors even in the presence of the TRPV1 inhibitor AMG9810 (10 μM). Intraplantar pretreatment with insulin (5, 50 or 500 ng) dose-dependently increased the number of acid-induced flinching. The effect of insulin (500 ng in 50 μl) on flinching behaviors was prevented by co-treatment with the insulin receptor antagonist GSK1838705 (100 ng). *p < 0.05, **p < 0.01, compared with the control; ##p < 0.01, compared with 500 ng insulin; one-way ANOVA followed by Tukey's post hoc test. Each column represents the mean ± S.E.M. of 9 rats. (B) Effects of intramuscular administration of insulin on mechanical hypersensitivity in the acid-induced muscle pain model. Acidic saline (pH 4.0) was injected into the gastrocnemius muscle of each rat twice, 5 days apart. Insulin (1 μg in 100 μl) was administered prior to the second acid injection. Mechanical hypersensitivity was assessed by measuring the paw withdrawal threshold (PWT, in g) to von Frey filament stimulation of the ipsilateral hind paws. **p < 0.01, compared with the vehicle group; ##p < 0.01, compared with the insulin group; two-way repeated measures ANOVA followed by Bonferroni's post hoc correction, n = 9 rats per group.

Similar articles

References

    1. Havrankova, J., Roth, J. & Brownstein, M. Insulin receptors are widely distributed in the central nervous system of the rat. Nature.272, 827–829 (1978). 10.1038/272827a0 - DOI - PubMed
    1. Schulingkamp, R. J., Pagano, T. C., Hung, D. & Raffa, R. B. Insulin receptors and insulin action in the brain: Review and clinical implications. Neurosci. Biobehav. Rev.24, 855–872 (2000). 10.1016/S0149-7634(00)00040-3 - DOI - PubMed
    1. Kleinridders, A., Ferris, H. A., Cai, W. & Kahn, C. R. Insulin action in brain regulates systemic metabolism and brain function. Diabetes.63, 2232–2243 (2014). 10.2337/db14-0568 - DOI - PMC - PubMed
    1. Ferrario, C. R. & Reagan, L. P. Insulin-mediated synaptic plasticity in the CNS: Anatomical, functional and temporal contexts. Neuropharmacology.136, 182–191 (2018). 10.1016/j.neuropharm.2017.12.001 - DOI - PMC - PubMed
    1. Soto, M., Cai, W., Konishi, M. & Kahn, C. R. Insulin signaling in the hippocampus and amygdala regulates metabolism and neurobehavior. Proc. Natl. Acad. Sci. USA.116, 6379–6384 (2019). 10.1073/pnas.1817391116 - DOI - PMC - PubMed

LinkOut - more resources