. 2024 Sep;21(9):1725-1735.
doi: 10.1038/s41592-024-02375-7. Epub 2024 Aug 5.

Rapid, biochemical tagging of cellular activity history in vivo

Affiliations

Rapid, biochemical tagging of cellular activity history in vivo

Run Zhang et al. Nat Methods. 2024 Sep.

Abstract

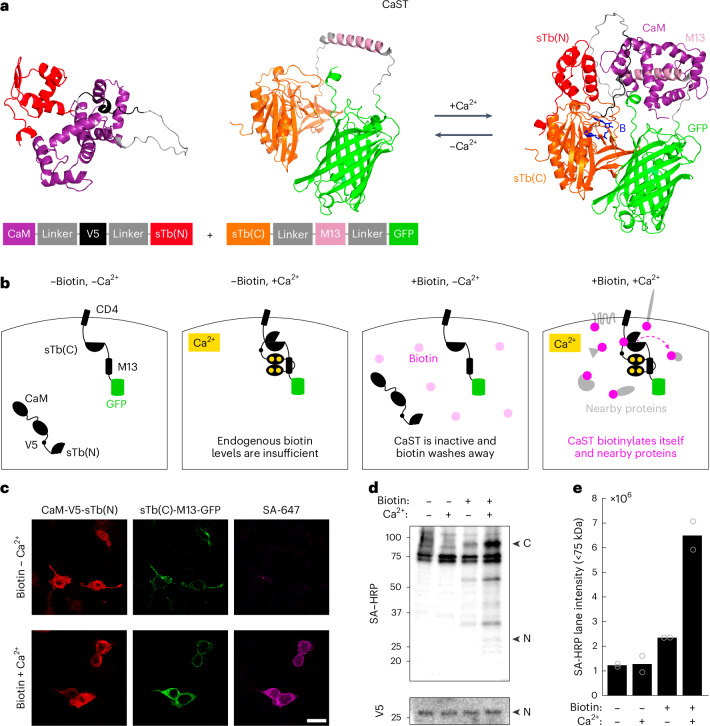
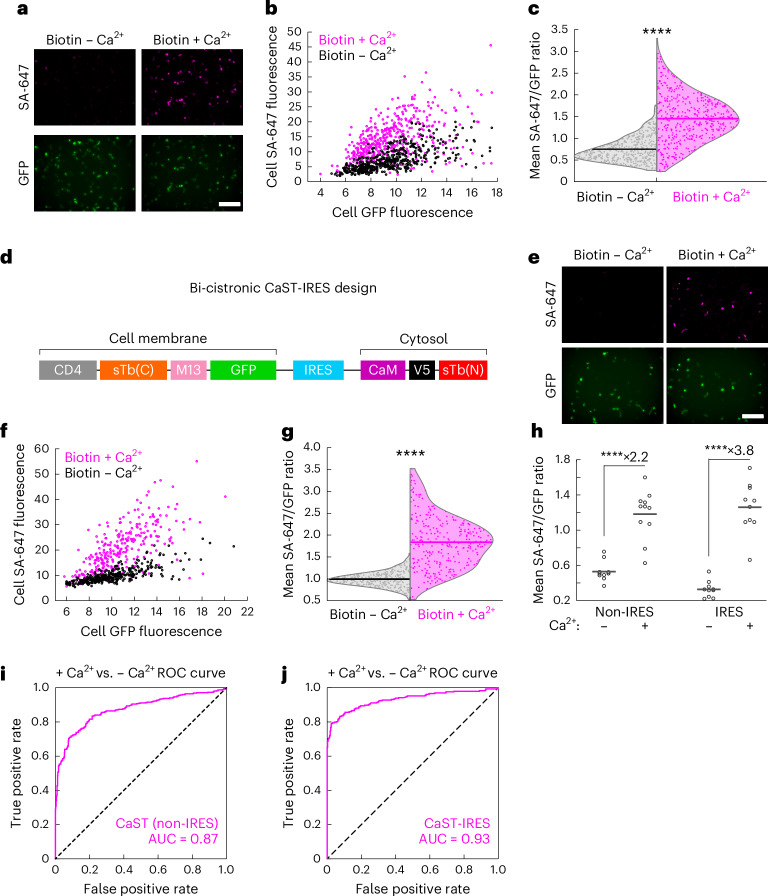
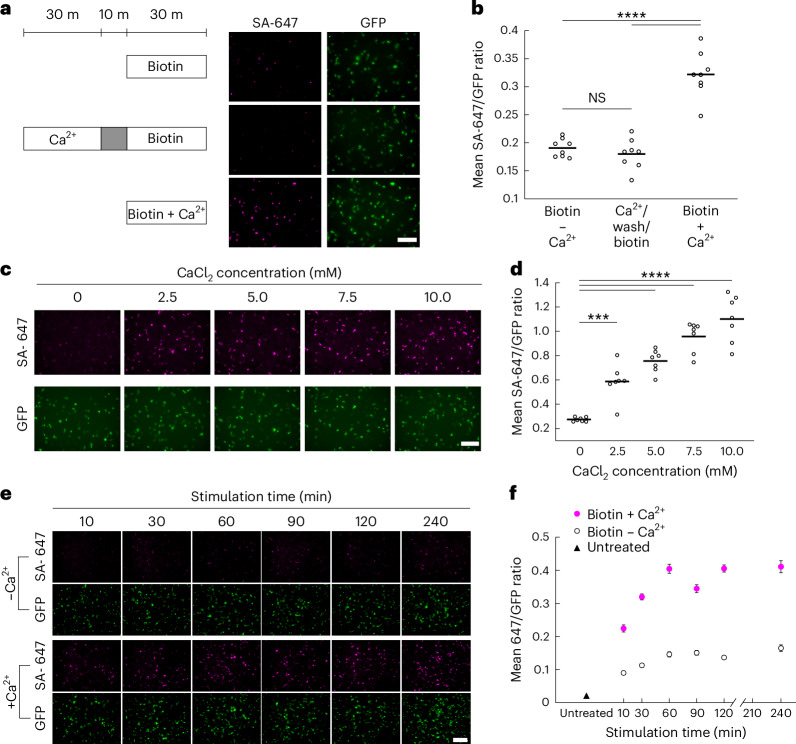
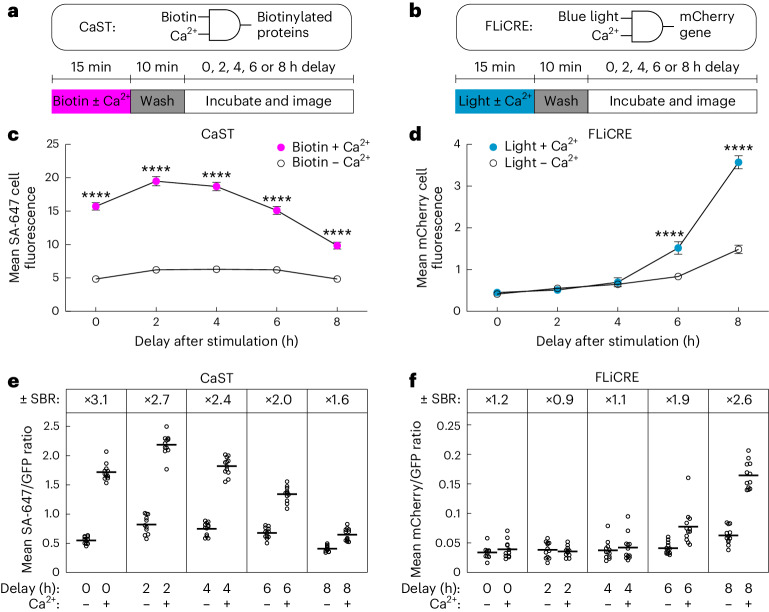
Intracellular calcium (Ca2+) is ubiquitous to cell signaling across biology. While existing fluorescent sensors and reporters can detect activated cells with elevated Ca2+ levels, these approaches require implants to deliver light to deep tissue, precluding their noninvasive use in freely behaving animals. Here we engineered an enzyme-catalyzed approach that rapidly and biochemically tags cells with elevated Ca2+ in vivo. Ca2+-activated split-TurboID (CaST) labels activated cells within 10 min with an exogenously delivered biotin molecule. The enzymatic signal increases with Ca2+ concentration and biotin labeling time, demonstrating that CaST is a time-gated integrator of total Ca2+ activity. Furthermore, the CaST readout can be performed immediately after activity labeling, in contrast to transcriptional reporters that require hours to produce signal. These capabilities allowed us to apply CaST to tag prefrontal cortex neurons activated by psilocybin, and to correlate the CaST signal with psilocybin-induced head-twitch responses in untethered mice.


Conflict of interest statement

D.E.O. is a cofounder of Delix Therapeutics and serves as the chief innovation officer and head of the scientific advisory board. The other authors declare no competing interests.

Figures

Fig. 1
Fig. 1. Design of CaST.
a, AlphaFold2 (refs. ,) prediction of the protein structures for the two halves of CaST either in isolation (left; as expected in the absence of Ca2+) or in complex (right; as expected in the presence of high Ca2+). The two CaST components reversibly reconstitute in a Ca2+-dependent manner. The predicted biotin binding site is shown in blue. b, Schematic of CaST design for expression in HEK cells. The component with sTb(C)-M13-GFP is tethered to the membrane via the transmembrane domain of a CD4 cell membrane protein, while the CaM-V5 epitope tag-sTb(N) component is expressed throughout the cytosol. CaST only tags proteins when cells are treated with biotin and exhibit elevated intracellular Ca2+. c, Example confocal images of HEK cells transfected with both components of CaST and treated with biotin ± Ca2+ for 30 min. Cells were washed, fixed and stained with anti-V5 and SA-647. The anti-V5 signal stains the CaM-sTb(N) component (left), while the GFP fluorescence shows the CD4-sTb(C)-M13 component (middle). Biotinylation of proteins is detected by SA-647 staining (right). Scale bar, 20 µm. d, HEK cells were transfected with CaST and treated with ±50 µM biotin and ±Ca2+ (5 mM CaCl2 and 1 µM ionomycin) for 30 min. Cells were then washed with Dulbecco’s phosphate buffered saline (DPBS), and whole-cell lysates were collected and analyzed using a western blot stained with streptavidin–horseradish peroxidase (SA–HRP) or anti-V5/HRP. ‘N’ indicates the expected size of the CaM-V5-sTb(N) fragment, while ‘C’ indicates the expected size of the CD4-sTb(C)-M13-GFP fragment. e, Quantification of biotinylated proteins present in western blot lanes of the experiment shown in d. Two independent biological replicates were quantified. The entire lane below the 75-kDa endogenously biotinylated bands was included in the quantification (sum of the total raw intensity pixel values). A line plot profile spanning the entire blot is shown in Extended Data Fig. 2. Source data
Fig. 2
Fig. 2. Quantification of CaST’s performance.
a, Example images of HEK cells transfected with CaST and treated with 50 µM biotin ± Ca2+ (5 mM CaCl2 and 1 µM ionomycin) for 30 min. Top row shows SA-647 staining of biotinylated proteins. Bottom row shows CD4-sTb(C)-M13-GFP. b, Scatterplot of the mean SA-647 versus mean GFP fluorescence calculated for every GFP+ cell detected across 11 FOVs treated with either biotin + Ca2+ (n = 451 cells; two-tailed Pearson’s R = 0.50, P = 6.2 × 10−30) or biotin − Ca2+ (n = 473 cells; two-tailed Pearson’s R = 0.69, P = 2.6 × 10−67). c, Violin plots showing the distributions of the mean SA-647/GFP fluorescence ratio per cell from data in b (P = 2.0 × 10−85, U = 27,234, two-tailed Mann–Whitney U test). d, Schematic of the bi-cistronic CaST-IRES construct design. e, Example images of HEK cells transfected with CaST-IRES and treated with biotin ± Ca2+ for 30 min, as in a. f, Scatterplot of the mean SA-647 versus mean GFP fluorescence calculated for each GFP+ cell detected across 10 FOVs treated with either biotin + Ca2+ (n = 293 cells; two-tailed Pearson’s R = 0.72, P = 1.5 × 10−47) or biotin − Ca2+ (n = 332 cells; two-tailed Pearson’s R = 0.78, P = 3.7 × 10−69). g, Violin plots showing the distributions of the mean SA-647/GFP fluorescence ratio per cell from data in f (P = 3.1 × 1077, U = 6,732, two-tailed Mann–Whitney U test). h, The FOV averages of the SA-647/GFP fluorescence ratio per cell from the non-IRES data shown in b (n = 11 FOVs per condition; P = 1.1 × 105, U = 2, two-tailed Mann–Whitney U test), and the IRES data shown in f (n = 10 FOVs per condition; P = 1.1 × 105, U = 0, two-tailed Mann–Whitney U test). i,j, ROC curves for distinguishing Ca2+-treated versus non-treated cell populations based on CaST non-IRES cells from c (i; AUC = 0.87, P = 2.0 × 1085, Wilson/Brown method) and CaST-IRES-transfected cells from g (j; AUC = 0.93, P = 3.1 × 1077, Wilson/Brown method). All scale bars, 300 µm. ****P < 0.0001. Source data
Fig. 3
Fig. 3. Characterization of reversibility, Ca2+ sensitivity and time integration of CaST.
a, To test the split enzyme’s reversibility, HEK cells were transfected with CaST-IRES and treated with biotin alone for 30 min (top), with Ca2+ for 30 min followed by a 10-min wash and then biotin for 30 min (middle), or with biotin + Ca2+ simultaneously for 30 min (bottom). Example images are shown for all three conditions with SA-647 staining of biotin and GFP expression of CaST-IRES. Scale bar, 300 µm. b, The FOV averages of the SA-647/GFP fluorescence ratio per cell for the three conditions shown in a (n = 8 FOVs per condition; biotin − Ca2+ versus Ca2+/wash/biotin: P = 0.75; biotin − Ca2+ versus biotin + Ca2+: P = 4.9 × 10−8; Ca2+/wash/biotin versus biotin + Ca2+: P = 1.3 × 10−8; Tukey’s post hoc multiple-comparison’s test following a one-way analysis of variance (ANOVA), F2,21 = 56.37, P = 3.6 × 10−9). c, Example FOVs of HEK cells transfected with CaST-IRES and treated with biotin and increasing concentrations of CaCl2 (and 1 µM ionomycin). d, The FOV averages of the SA-647/GFP fluorescence ratio per cell for the CaCl2 concentrations shown in c (n = 7 FOVs per condition; 0 mM versus 2.5 mM: P = 7.6 × 10−4; 0 mM versus 5 mM: P = 8.8 × 10−7; 0 mM versus 7.5 mM: P = 5.5 × 10−10; 0 mM versus 10 mM: P = 5.4 × 10−12; Tukey’s post hoc multiple-comparison’s test following a one-way ANOVA, F4,30 = 44.07, P = 3.8 × 10−12). The FOV average SA-647/GFP ratios were linearly correlated with CaCl2 concentration (two-tailed Pearson’s correlation coefficient R = 0.99, P = 0.001). e, Example FOVs of HEK cells transfected with CaST-IRES and treated with 50 µM biotin ± Ca2+ (5 mM CaCl2 and 1 µM ionomycin) for different durations. f, The mean FOV averages of the SA-647/GFP fluorescence ratio per cell for the different stimulation times shown in e (n = 10 FOVs per condition). The untreated condition is shown on the left. Data are plotted as the mean ± s.e.m. All scale bars, 300 µm. ***P < 0.001, ****P < 0.0001. NS, not significant. Source data
Fig. 4
Fig. 4. Comparison of CaST to an existing technology, FLiCRE.
a,b, Schematics of CaST (a) and FLiCRE (b) as AND logic gates, and the experimental paradigms used to test the time course of labeling detection after biotin + Ca2+ (CaST) and light + Ca2+ (FLiCRE) stimulation. Cells were transfected with either CaST-IRES or FLiCRE (Extended Data Fig. 4a) components. c, For CaST, the FOV average of the SA-647 cell fluorescence was calculated following a variable delay period after biotin ± Ca2+ stimulation (n = 12 FOVs for conditions with 0, 4, 6 and 8 h delay; n = 11 FOVs for conditions with 2 h delay; 0 h: P = 1.0 × 10−30; 2 h: P = 3.0 × 10−36; 4 h: P = 2.4 × 10−35; 6 h: P = 3.0 × 10−24; 8 h: P = 1.4 × 10−10; Sidak’s post hoc multiple-comparison’s test following a two-way ANOVA, F4,108 = 25.94, P = 4.5 × 10−15). d, For FLiCRE, the FOV average of the UAS::mCherry cell fluorescence was calculated following a variable delay period after light ± Ca2+ stimulation (n = 11 FOVs for conditions with 0 h delay; n = 12 FOVs for conditions with 2, 4, 6 and 8 h delay; 6 h: P = 4.6 × 10−5; 8 h: P = 2.4 × 10−28; Sidak’s post hoc multiple-comparison’s test following a two-way ANOVA, F4,108 = 46.46, P = 1.2 × 10−22). e,f, The ±Ca2+ SBR of normalized reporter expression is shown for both CaST (e) and FLiCRE (f). For CaST, the SA-647 fluorescence was divided by the GFP fluorescence (n = 12 FOVs for conditions with 0, 4, 6 and 8 h delay; n = 11 FOVs for conditions with 2 h delay). For FLiCRE, the UAS::mCherry fluorescence was divided by the GFP fluorescence (n = 11 FOVs for conditions with 0 h delay; n = 12 FOVs for conditions with 2, 4, 6 and 8 h delay). Data are plotted as the mean ± s.e.m. in c and d. ****P < 0.0001. Source data
Fig. 5
Fig. 5. CaST performance in cultured neurons.
a, Example FOVs of cultured rat hippocampal neurons infected with AAV2/1-Synapsin-CD4-sTb(C)-M13-GFP and AAV2/1-Synapsin-CaM-sTb(N) viruses and stimulated with ±biotin and ±KCl for 30 min. b, The FOV averages of the SA-647/GFP fluorescence ratio per cell for the data shown in a (n = 6 FOVs per condition; −biotin −KCl versus +biotin +KCl: P = 1.8 × 10−12; −biotin +KCl versus +biotin +KCl: P = 3.0 × 10−11; +biotin −KCl versus +biotin +KCl: P = 1.4 × 10−10; −biotin −KCl versus +biotin −KCl: P = 0.013; Sidak’s post hoc multiple-comparison’s test following a two-way ANOVA, F1,20 = 59.43, P = 2.1 × 10−7). c, Example FOVs of rat hippocampal neurons infected with CaST as in a but stimulated with biotin ± KCl for only 10 min. d, The FOV averages of the SA-647/GFP fluorescence ratio per cell for the data shown in c (n = 8 FOVs per condition; P = 0.015, U = 9, two-tailed Mann–Whitney U test). e, Fraction of all GFP+ neurons that are also SA-647+ (defined as having an SA-647 fluorescence value greater than the 90th percentile of neurons in the biotin − KCl group). Data are quantified for the 10-min labeling experiment shown in c (n = 8 FOVs per condition; P = 0.003, U = 5, two-tailed Mann–Whitney U test) and for a replicated 30-min labeling experiment shown in Extended Data Fig. 5b,c (n = 6 FOVs per condition; P = 0.002, U = 0, two-tailed Mann–Whitney U test). Data are plotted as the mean ± s.e.m. f, Example FOVs of rat hippocampal neurons infected with CaST as in a and treated with 50 µM biotin and 10 µM DA, 10 µM DOI or 30 mM KCl for 30 min. g, The FOV averages of the SA-647/GFP fluorescence ratio per cell for the conditions shown in f (n = 12 FOVs per condition; −KCl versus DA: P = 0.547; −KCl versus DOI: P = 0.008; −KCl versus KCl: P = 6.5 × 10−4, Tukey’s post hoc multiple-comparison’s test following a one-way ANOVA, F3,44 = 7.373, P = 4.2 × 10−4). All scale bars, 300 µm. *P < 0.05, **P < 0.01, ***P < 0.001, ****P < 0.0001. Source data
Fig. 6
Fig. 6. Noninvasive identification of psilocybin-activated neurons in vivo.
a, Schematic for using CaST to tag psilocybin-activated neurons during HTR measurement. b, Example mPFC images of SA-647 and CaST GFP fluorescence, for mice injected with biotin + saline, or biotin + psilocybin. c, Mean SA-647 versus GFP fluorescence for each GFP+ neuron detected in biotin + saline-injected mice (n = 218 neurons from 3 mice) or biotin + psilocybin-injected mice (n = 220 neurons from 3 mice). The horizontal dashed line indicates the 90th percentile threshold value of all SA-647 neurons in the biotin + saline group. d, FOV averages of the SA-647/GFP fluorescence ratios from c (n = 8 FOVs pooled from 3 mice in both conditions; P = 6.2 × 10−4, U = 38, two-tailed Mann–Whitney U test). e, Fraction of all GFP+ neurons that are SA-647+ (thresholded using the dashed line in c; n = 8 FOVs pooled from 3 mice in both conditions; P = 1.6 × 10−4, U = 36, two-tailed Mann–Whitney U test). f, Cell masks of SA-647+ mPFC neurons identified during HTR measurements. FOVs with the same number of HTRs were taken from the same mice, but from independent CaST injections on opposite hemispheres. g, Number of HTRs versus the number of SA-647+ neurons per mm2 for data shown in f (n = 6 FOVs from independent CaST injections; two-tailed Pearson’s correlation coefficient R = 0.85, P = 0.03). h, Number of HTRs versus the mean cell SA-647/GFP ratio for data shown in f. i, Example mPFC images of CaST GFP, SA-647 staining and c-Fos staining in mice treated with biotin + saline, or biotin + psilocybin. jl, Number of c-Fos+ neurons per mm2 (j), SA-647+ neurons per mm2 (k) or SA-647+ divided by GFP+ neurons per mm2 per FOV (l), in mice injected with biotin + saline versus biotin + psilocybin (n = 5 mice per condition; P = 0.42, U = 8, two-tailed Mann–Whitney U test (j); P = 0.0079, U = 0, two-tailed Mann–Whitney U test (k); P = 0.0079, U = 0, two-tailed Mann–Whitney U test (l)). All scale bars, 50 µm. Data are plotted as the mean ± s.e.m. in e and jl. **P < 0.01, ***P < 0.001. Psilo., psilocybin. Source data
Extended Data Fig. 1
Extended Data Fig. 1. Comparison of different CaST transfection ratios of fragments.
A) HEK cells were transfected with different ratios of the CaST fragments indicated above in ng for 48-well plate and incubated overnight. Cells were treated with 50 µM biotin and ± Ca2+ (5 mM CaCl2 and 1 µM ionomycin) for 30 minutes. The ± Ca2+ SBR and the FOV averages of the SA647/GFP fluorescence ratio per cell are shown. The ratio of 50:20 (CD4-sTb(C)-M13-GFP:CaM-V5-sTb(N)) had a significant 2.2-fold ± Ca2+ SBR (n = 10 FOVs per condition; P = 1.1e-5, U = 0, two-tailed Mann-Whitney U test). B,C) The FOV average of the SA-647 cell fluorescence (B) and the GFP cell fluorescence (C) was calculated for each transfection ratio (CD4-sTb(C)-M13-GFP:CaM-V5-sTb(N)) after biotin ± Ca2+ stimulation (n = 10 FOVs per condition). Data are plotted as mean ± s.e.m. D) HEK cells were transfected with either the Cam-V5-sTb(N) fragment (top), the CD4-sTb(C)-M13-GFP fragment (middle), or both fragments of CaST together (bottom). Cells were treated with 50 µM biotin and Ca2+ (5 mM CaCl2 and 1 µM ionomycin) for 30 minutes, then washed, stained, and imaged. Data were replicated across 12 FOVs. Scale bar, 300 µm. ****P < 0.0001. Source data
Extended Data Fig. 2
Extended Data Fig. 2. Additional western blot analysis of CaST labeling.
A) Ponceau staining and raw image of the full SA-HRP blot from Fig. 1d. B) Biological replicate of experiment in panel A. C,D) Line plot profile of the entire lane of the raw blot shown in panels A and B (drawn vertically from the 250 kB to the 20 kB ladder line and centered horizontally within each lane). E) Additional biological replicate experiment of panels A,B, except using CaST-IRES. Cells were otherwise treated identically. *indicate bands showing endogenously biotinylated proteins. “N” indicates the expected size of the CaM-V5-sTb(N) fragment, while “C” indicates the expected size of the CD4-sTb(C)-M13-GFP fragment. Source data
Extended Data Fig. 3
Extended Data Fig. 3. Additional characterization of CaST in HEK cells.
A) The FOV averages of the SA-647 fluorescence per cell from the non-IRES data shown in Fig. 2b, and the IRES data shown in Fig. 2f. The non-IRES version exhibited a Ca2+-dependent SBR of 2.3x (n = 11 FOVs per condition; P = 1.1e-5, U = 2, two-tailed Mann-Whitney U test). The Ca2+-dependent SBR for the IRES version was 4.1x (n = 10 FOVs per condition; P = 1.1e-5, U = 0, two-tailed Mann-Whitney U test). B) The FOV averages of the GFP cell fluorescence per cell from the non-IRES data shown in Fig. 2b (n = 11 FOVs per condition; P = 0.562, U = 51, two-tailed Mann-Whitney U test), and the IRES data shown in Fig. 2f (n = 10 FOVs per condition; P = 0.165, U = 31, two-tailed Mann-Whitney U test). C,D) The FOV average of the SA-647 (C) or GFP (D) cell fluorescence was calculated for each stimulation duration for data shown in Fig. 3e,f (n = 10 FOVs per condition). Cells were transfected with CaST-IRES. The untreated condition is shown on the left. Data are plotted as mean ± s.e.m. ****P < 0.0001, ns, not significant. Source data
Extended Data Fig. 4
Extended Data Fig. 4. Comparison of CaST to FLiCRE.
A) Schematic of FLiCRE as a light- and Ca2+-dependent transcriptional reporter. A TEV protease (TEVp) is tethered to GFP-CaM and expressed in the cytosol. A CD4-MKII-LOV-TEVcs-Gal4 fusion is expressed at the membrane. In the dark, the LOV protein cages the TEV cleavage site (TEVcs), protecting it from the TEVp. When there is high intracellular Ca2+, CaM-M13 interact to bring the TEVp nearby the TEVcs. However, only when blue light is simultaneously delivered, will the TEVcs become uncaged and available for cleavage. With both blue light and high intracellular Ca2+, the TEVp will cut the TEVcs, and the released Gal4 then enters the nucleus to drive expression of the UAS reporter gene. B,C) Example FOVs for CaST (B) and FLiCRE (C) experiments quantified in Fig. 4c–f. Scale bar, 300 µm. D,E) For CaST, the FOV average of the SA-647 cell fluorescence and the GFP cell fluorescence was calculated following a variable delay period after biotin + Ca2+ (D) or biotin - Ca2+ (E) stimulation (n = 12 FOVs for conditions with 0, 4, 6, 8 hr delay time after stimulation; n = 11 FOVs for conditions with 2 hr delay time after stimulation). F,G) For FLiCRE, the FOV average of the UAS-mCherry cell fluorescence and the GFP cell fluorescence was calculated following a variable delay period after light + Ca2+ (D) or light - Ca2+ (E) stimulation (n = 11 FOVs for conditions with 0 hr delay time after stimulation; n = 12 FOVs for conditions with 2, 4, 6, 8 hr delay time after stimulation). Data are plotted as mean ± s.e.m. in DG. Source data
Extended Data Fig. 5
Extended Data Fig. 5. Additional characterization of CaST in neurons.
A) Example confocal images of cultured rat hippocampal neurons infected with both components of CaST. Neurons were treated with 50 µM biotin ± 30 mM KCl for 30 minutes. They were then washed, fixed, and stained for SA-647. Scale bar, 20 µm. B) Scatter plot of the SA-647 versus GFP fluorescence calculated for each GFP+ neuron detected across FOVs treated with biotin - KCl (n = 53 neurons pooled from 8 FOVs) or biotin + KCl (n = 75 neurons pooled from 8 FOVs). Dashed line indicates the 90th percentile of SA-647 fluorescence values of all neurons in the biotin - KCl group. C) The FOV averages of the SA-647/GFP fluorescence ratio per cell from the data shown in panel B (n = 8 FOVs per condition; P = 1.6e-4, U = 0, two-tailed Mann-Whitney U test). D) ROC curve for distinguishing KCl-treated vs. non-treated neuron populations based on the SA-647/GFP ratios from panel B (AUC = 0.91, P = 5.5e-15, Wilson/Brown’s method). E) Example FOV images of CaST expressing neuron viability experiment. Neurons expressing both fragments of CaST together (top) or the CD4-sTb(C)-M13-GFP fragment (middle) were stained with DRAQ7 at a final concentration of 3 µM at DIV 19 before fixation. Neurons expressing both fragments of CaST (bottom) were fixed, permeabilized, and stained with DRAQ7 at DIV 19. Scale bar, 300 µm. F) The FOV averages of the DRAQ7 fluorescence for the 3 conditions shown in panel D (n = 10 FOVs per condition; CaST versus CD4-sTb(C)-M13-GFP: P = 0.9831; CaST versus CaST Fixed: P = 8.0e-15; CD4-sTb(C)-M13-GFP versus CaST Fixed: P = 8.0e-15, Tukey’s post-hoc multiple comparison’s test following a 1-way ANOVA, F2,27 = 326.3, P = 1.2e-19). ***P < 0.001, ****P < 0.0001, ns, not significant. Source data
Extended Data Fig. 6
Extended Data Fig. 6. Simultaneous RCaMP2 imaging and CaST labeling in neurons.
A) Example FOV images of neurons co-infected with AAV2/1-Synapsin-RCaMP2 and AAV2/1-Synapsin-CaST viruses, following mild stimulation (50% media change) and 50 µM biotin treatment for 30 minutes. Post-hoc RCaMP2 and CaST labeling is shown for all identified cell masks during RCaMP2 imaging (shown as colored overlays to the left). Numbered arrows indicate locations from which traces were extracted for panel B. Scale bar, 100 µm. B) RCaMP2 dF/F fluorescence traces of example neurons from panel A, during a ~5-minute recording following treatment. Traces are colored according to their SA-647 cell fluorescence intensity value. C) Scatter plot showing a linear correlation between SA-647/GFP fluorescence ratio calculated for each GFP+ neuron detected, and the mean peak height during the RCaMP2 recording for each cell (n = 33 cells; two-tailed Pearson’s correlation coefficient R = 0.37, P = 0.035). Source data
Extended Data Fig. 7
Extended Data Fig. 7. CaST specificity using targeted optogenetic stimulation.
A) Example fluorescence images for neurons co-infected with an excitatory opsin, AAV2/1-Synapsin-mCherry-P2A-bReaChES, and AAV2/1-Synapsin-CaST. 50 µM biotin and orange light was delivered for 30 minutes through a ~1 mm wide slit to the bottom of the culture dish. 50 µM APV and 20 µM NBQX were added at the time of light stimulation to reduce synchronized neuron firing. Scale bar, 1000 µm. B) Quantification of the mean SA-647 and GFP fluorescence intensity, averaged vertically across the entire FOV images shown in panel A. C) Example zoom-in images of the light-stimulated region in panel A showing neurons co-expressing bReaChES and CaST. Scale bar, 100 µm. D) Example SA-647 image for CaST-expressing neurons with whole dish KCl treatment as a non-spatial control. Scale bar, 1000 µm. E) Quantification of the mean SA-647 and GFP fluorescence intensity, averaged vertically across the entire FOV shown in panel D. F) Mean SA-647 and GFP fluorescence intensity, averaged vertically and binned across 1 mm horizontal sections to the left, middle, or right of the light stimulation gap (For SA-647, n = 3 FOVs per condition; Left versus Middle: P = 0.0281; Middle versus Right: P = 0.0449, Šídák’s post-hoc multiple comparison’s test following a 2-way ANOVA, F2,4 = 12.94, P = 0.0179) (For GFP, n = 3 FOVs per condition; Left versus Middle: P = 0.1645; Middle versus Right: P = 0.4352, Šídák’s post-hoc multiple comparison’s test following a 2-way ANOVA, F2,4 = 3.536, P = 0.1305). G) Same analysis as in panel F, except for a whole dish KCl stimulation non-spatial control (For SA-647, n = 3 FOVs per condition; Left versus Middle: P = 1.0; Middle versus Right: P = 0.6731, Šídák’s post-hoc multiple comparison’s test following a 2-way ANOVA, F2,4 = 0.9006, P = 0.4754) (For GFP, n = 3 FOVs per condition; Left versus Middle: P = 0.7328; Middle versus Right: P = 0.6682, Šídák’s post-hoc multiple comparison’s test following a 2-way ANOVA, F2,4 = 2.446, P = 0.2023). Data are plotted as mean ± s.e.m. in F and G. *P < 0.05, ns, not significant. Source data
Extended Data Fig. 8
Extended Data Fig. 8. RCaMP2 calcium imaging during various drug applications.
A) Average FOV images of neurons infected with AAV2/1-Synapsin-RCamp2, taken from the entire RCaMP2 baseline recording (“Pre”) or post-treatment recording (“Post”). Each recording was 1 minute long. Neurons were treated with 50 µM biotin and vehicle, 10 µM dopamine (DA), 10 µM DOI, or 30 mM KCl for 30 minutes. Scale bar, 300 µm. B) Top: average pre- and post-treatment fluorescence traces for all identified neurons in the FOV (Z-scored relative to the baseline “pre” period for each cell). Bottom: cell masks identified for each FOV shown in panel A. Data are plotted as mean ± s.e.m. with the shaded regions indicating the s.e.m. C) Peak neuron responses during the post-treatment recordings. Only DOI and KCl treatment drove a larger peak RCaMP2 response compared to the vehicle control (n = 69 cells for vehicle, 62 cells for DA, 104 cells for DOI, and 189 cells for KCl treatment; No KCl versus DOI: P = 2.3e-13; No KCl versus KCl: P = 2.3e-13, Tukey’s post-hoc multiple comparison’s test following a 1-way ANOVA, F3,420 = 152.4, P = 7.8e-67). ****P < 0.0001. Source data
Extended Data Fig. 9
Extended Data Fig. 9. Controls and validation for in vivo CaST labeling.
A) Schematic of control and experimental conditions. Both wildtype mice not expressing CaST, and wildtype mice injected with CaST in mPFC, were treated with 24 mg/kg biotin + 3 mg/kg psilocybin for 1 hour, and then sacrificed for histology. B) Example FOVs of wildtype mice not expressing CaST (-CaST) or expressing CaST (+CaST) that were injected with biotin and psilocybin. The -CaST control was replicated across two uninjected mice. C) Schematic for using real-time imaging to identify psilocybin-activated neurons in the mPFC. AAV5-CaMKIIa-GCaMP6f was injected into mPFC, and a 1 mm diameter GRIN lens was implanted. 4 weeks later, mice were imaged head-fixed under a 2 P microscope during an IP injection of 5 ml/kg saline or 3 mg/kg psilocybin. D) Background-subtracted mean images of the FOV during a 10-minute saline recording session (left), and a 10-minute psilocybin recording session (right). Active neurons are displayed as warmer pixel colors. Experiment was replicated in two mice. E) Mean 2 P FOV image of the combined saline and psilocybin recordings with all identified neuron masks shown as colored overlays. F) Example Z-scored fluorescence traces of neurons activated by psilocybin (magenta), unaffected by psilocybin (gray), or inhibited by psilocybin (blue), compared to the saline recording. Each recording was 10 minutes long. G) “Psilocybin minus Saline” activity traces were calculated by subtracting the baseline saline Z-scored trace from the psilocybin Z-scored trace for each neuron. The resulting 10-minute-long trace representing the difference is plotted for each neuron in the heatmap to the left, and the average difference for each neuron is plotted as the heatmap to the right labeled “Avg” (N = 254 cells from 2 mice). Neurons are plotted ranked by the highest to lowest average Z-score difference. The two horizontal bars represent the thresholds for defining “Activated” versus “Inhibited” neurons (>+0.05 = “Activated”, <−0.05 = “Inhibited”). H) The activity traces for the top 50 ranked “Activated” neurons from panel G are shown during the saline and psilocybin recordings (separated by a dashed vertical line). All scale bars, 50 µm. Source data
Extended Data Fig. 10
Extended Data Fig. 10. cFos-only staining in psilocybin- versus saline-injected mice.
A,B) 2x (left) and 10x (right) images of mouse brain slices stained for cFos 1 hour after injection with saline vehicle (A) or 2 mg/kg psilocybin I.P. (B). White boxes on 2x images show location where the 10x images were taken in either the mPFC or SSC. C) An additional 4 example FOVs taken from different mice showing cFos staining in the mPFC after saline or psilocybin injection as described in panel A. D) Mean number of cFos+ neurons/mm2 in the mPFC counted from mice injected with either saline or psilocybin (n = 5 mice each condition; P = 0.73, U = 10.50, two-tailed Mann-Whitney U test). E) An additional 4 example FOVs taken from the same mice as in panel C, except showing cFos staining in the SSC after saline or psilocybin injection. F) Mean number of cFos+ neurons/mm2 in the SSC counted from mice injected with either saline or psilocybin (n = 5 mice each condition; P = 0.0079, U = 0, two-tailed Mann-Whitney U test). All scale bars, 50 µm. **P < 0.01, ns, not significant. Source data

Update of

References

    1. Grynkiewicz, G., Poenie, M. & Tsien, R. Y. A new generation of Ca2+ indicators with greatly improved fluorescence properties. J. Biol. Chem.260, 3440–3450 (1985). 10.1016/S0021-9258(19)83641-4 - DOI - PubMed
    1. Tian, L. et al. Imaging neural activity in worms, flies and mice with improved GCaMP calcium indicators. Nat. Methods6, 875–881 (2009). 10.1038/nmeth.1398 - DOI - PMC - PubMed
    1. Chen, T.-W. et al. Ultrasensitive fluorescent proteins for imaging neuronal activity. Nature499, 295–300 (2013). 10.1038/nature12354 - DOI - PMC - PubMed
    1. Inoue, M. et al. Rational design of a high-affinity, fast, red calcium indicator R-CaMP2. Nat. Methods12, 64–70 (2015). 10.1038/nmeth.3185 - DOI - PubMed
    1. Wang, W. et al. A light- and calcium-gated transcription factor for imaging and manipulating activated neurons. Nat. Biotechnol.35, 864–871 (2017). 10.1038/nbt.3909 - DOI - PMC - PubMed