. 2024 Sep;21(9):1674-1683.
doi: 10.1038/s41592-024-02372-w. Epub 2024 Aug 5.

Geometric deep learning of protein-DNA binding specificity

Affiliations

Geometric deep learning of protein-DNA binding specificity

Raktim Mitra et al. Nat Methods. 2024 Sep.

Abstract

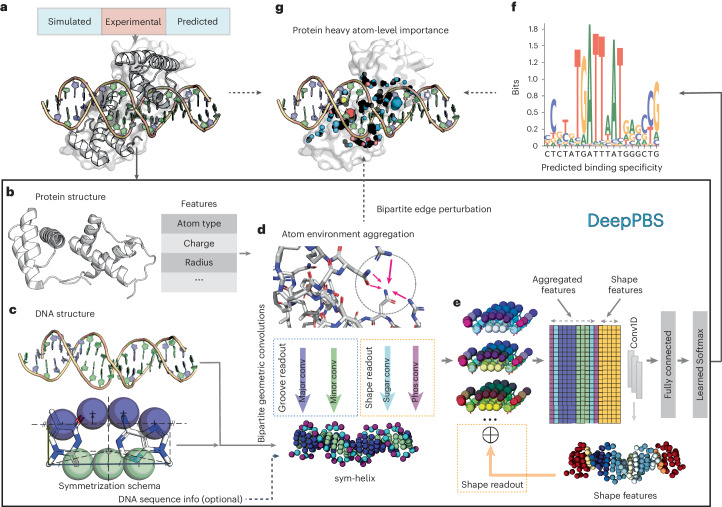
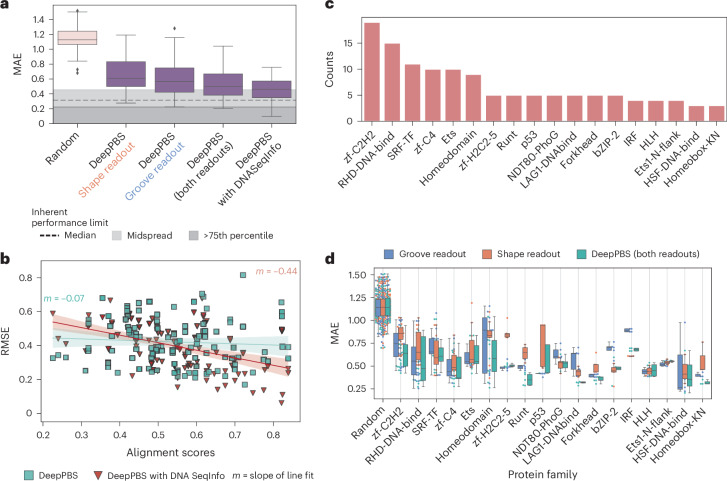
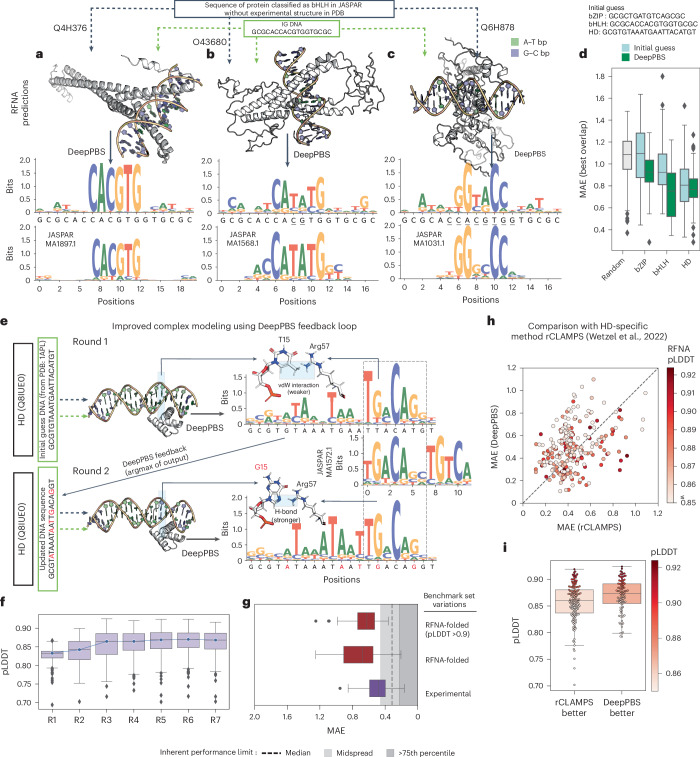
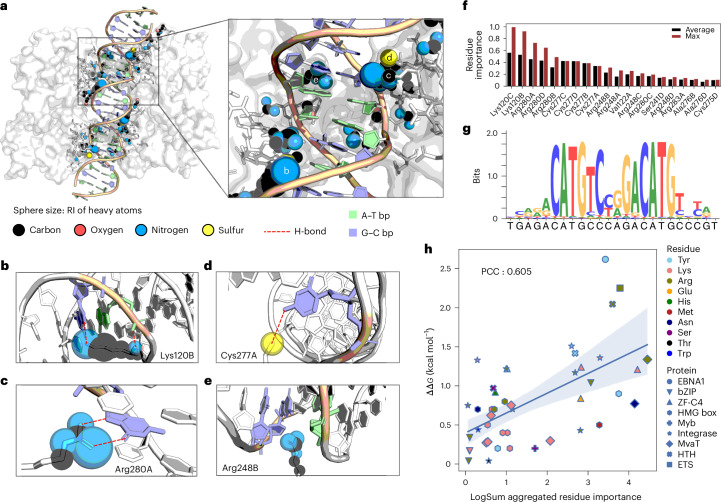
Predicting protein-DNA binding specificity is a challenging yet essential task for understanding gene regulation. Protein-DNA complexes usually exhibit binding to a selected DNA target site, whereas a protein binds, with varying degrees of binding specificity, to a wide range of DNA sequences. This information is not directly accessible in a single structure. Here, to access this information, we present Deep Predictor of Binding Specificity (DeepPBS), a geometric deep-learning model designed to predict binding specificity from protein-DNA structure. DeepPBS can be applied to experimental or predicted structures. Interpretable protein heavy atom importance scores for interface residues can be extracted. When aggregated at the protein residue level, these scores are validated through mutagenesis experiments. Applied to designed proteins targeting specific DNA sequences, DeepPBS was demonstrated to predict experimentally measured binding specificity. DeepPBS offers a foundation for machine-aided studies that advance our understanding of molecular interactions and guide experimental designs and synthetic biology.


Conflict of interest statement

The authors declare no competing interests.

Figures

Fig. 1
Fig. 1. Schematic illustration of the DeepPBS framework.
a, DeepPBS input (PDB ID 2R5Y in this example) and possible input sources. b, Protein structure (heavy atom graph, with features computed for each vertex). c, Symmetrization schema in base-pair frame applied to DNA structure, resulting in a sym-helix. d, Spatial graph convolution on the protein graph for atom environment aggregation, followed by bipartite geometric convolutions from protein graph vertices to sym-helix points (shown as spheres with specific colors for major groove, minor groove, phosphate and sugar). e, Three-dimensional sym-helix is flattened with aggregated information (concatenated with computed shape features) into a 1D representation, followed by 1D convolutions and regression onto base pair probabilities. f, DeepPBS outputs binding specificity. g, Effect of perturbing bipartite edges involved in d can be measured in terms of changes in the output, providing an effective measure of interpretability. Phos, phosphate; conv, convolutions. Source data
Fig. 2
Fig. 2. Performance of DeepPBS for predicting binding specificity across protein families for experimentally determined structures.
a, Prediction performances of DeepPBS along with ‘groove readout’, ‘shape readout’ and ‘with DNA SeqInfo’ variations, on benchmark set (biological assemblies corresponding to n = 130 protein chains (for each box plot); Supplementary Section 1). MAE, mean absolute error; RMSE, root mean squared error. b, Performances of DeepPBS and ‘with DNA SeqInfo’ models in context of PWM–co-crystal-derived DNA alignment score (Supplementary Section 2). The shaded regions indicate the 95% confidence interval for the corresponding linear fit. The MAE equivalent of this plot is available as Supplementary Fig. 12, showing similar trends. c, Abundances of various protein families (as appearing in PFAM annotations) in constructed benchmark set (counts >3). d, Performances of DeepPBS, groove readout and shape readout models across various protein families (counts >3) (biological assemblies corresponding to n protein chains (for each family), where n is as described in c, total unique n = 130). All benchmark predictions are made by an ensemble average of five models trained via cross-validation. Cross-validation performances of individual trained models are shown in Supplementary Fig. 5a. For the box plots in a and d, the lower limit represents the lower quartile, the middle line represents the median and the upper limit represents the upper quartile. Source data
Fig. 3
Fig. 3. Application of DeepPBS on predicted protein–DNA complex structures.
Various predictive approaches (for example, RFNA and MELD-DNA) can be used to predict protein–DNA complex structures in the absence of experimental data. DeepPBS can predict binding specificity on the basis of this predicted complex. ac, Examples for three full-length bHLH protein sequences: Max homodimer from Ciona intestinalis (a), TCF21 dimer from Homo sapiens (b) and OJ1581_H09.2 dimer from Oryza sativa (c). d, Performance of DeepPBS via the same process applied for three different families, bZIP (n = 50 predicted assemblies), bHLH (n = 49 predicted assemblies) and HD (n = 236 predicted assemblies), compared with baselines determined for random (drawn from uniform) and IG DNA sequences. Each protein has a unique JASPAR annotation and lacks an experimental structure for the complex. Structures for protein complexes were predicted by RFNA. Proteins passed the preprocessing criterion of DeepPBS. e, One iteration of DeepPBS feedback, demonstrated for human TGIF2LY protein. vdW, van der Waals. f, RFNA-predicted LDDT score over rounds 1–7 of DeepPBS feedback loop (n = 236 predicted assemblies). g, Comparison of DeepPBS ensemble performance on benchmark set for experimental and RFNA folded structures (for all processable RFNA-folded structures with greater than 500 contact counts (5 Å cutoff) to the DNA helix (n = 98 predicted assemblies) and high confidence (pLDDT >0.9) set (n = 31 predicted assemblies)). h, Comparison of DeepPBS predictions against HD family-specific method rCLAMPS, color-coded by pLDDT. Diagonal dashed line represents y = x. i, Distribution of pLDDT for two cases: when DeepPBS outperforms rCLAMPS (below diagonal in h) and vice versa (above diagonal in h) (n = 140 (left) and 96 (right) predicted assemblies). The box colors denote the average pLDDT, using the same colormap as in h. For the box plots in d, f, g and i, the lower limit represents lower quartile, the center line represents the median and the upper limit represents the upper quartile. The whiskers do not include outliers. Source data
Fig. 4
Fig. 4. Visualization of DeepPBS importance scores in p53–DNA interface as a case study, and experimental validation.
p53 binds to DNA as a tetramer with two symmetric protein–DNA interfaces (A, B, C and D refer to each monomer; PDB ID: 3Q05). a, Relative importance (RI) score (normalized by maximum across atoms) calculated for heavy atoms (denoted by sphere sizes: largest 1, smallest 0) within 5 Å of the sym-helix. be, Zoomed-in view of specific interactions by protein–DNA interface residues Lys120B (b), Arg280A (c), Cys277A (d) and Arg248B (e) with RI scores assigned by DeepPBS. f, Residue importance computed by average and maximum aggregation of heavy atom importance (top 20). g, DeepPBS prediction. h, Comparison of log sum aggregated residue importance computed from DeepPBS ensemble, with experimental free energy change (ΔΔG) determined by alanine scanning mutagenesis experiments. The blue line indicates linear regression fit. The light-blue region indicates the corresponding 95% confidence interval computed via bootstrapping mean. Source data
Fig. 5
Fig. 5. Application of DeepPBS to in silico-designed HTH scaffolds targeting a specific DNA sequence.
a,e,i,m, Design models of four different synthetic HTH proteins targeting the DNA sequence GCAGATCTGCACATC (design based on DNA sequence from PDB ID 1L3L, canonical B-DNA structure used for e and i, co-crystal-derived DNA structure used for a and m), obtained from a recent sequence-specific DNA binder design study. b,f,j,n, DeepPBS ensemble predictions based on each design model shown in a, e, i and m, respectively. As expected, the predictions for DBP5 and DBP35 were very similar due to comparable designs (see ‘Data availability’ section). c,g,k,o, DeepPBS assessment of heavy atom level RI scores for each interface in the design models shown in a, e, i and m, respectively. d,h,l,p, Relative binding activity (phycoerythrin/fluorescein isothiocyanate normalized to the no-competitor condition) of all possible single base-pair mutations obtained via flow cytometry analysis in yeast display competition assays for each of the four HTH proteins shown in a, e, i and m, respectively. Blue indicates competitor mutations where competition was stronger than with the WT competitor, while red indicates competitor mutations where competition was weaker. Source data

Update of

References

    1. Spitz, F. & Furlong, E. E. M. Transcription factors: from enhancer binding to developmental control. Nat. Rev. Genet.13, 613–626 (2012). 10.1038/nrg3207 - DOI - PubMed
    1. Zhao, Y., Granas, D. & Stormo, G. D. Inferring binding energies from selected binding sites. PLoS Comput. Biol.5, e1000590 (2009). 10.1371/journal.pcbi.1000590 - DOI - PMC - PubMed
    1. Rohs, R. et al. The role of DNA shape in protein–DNA recognition. Nature461, 1248–1253 (2009). 10.1038/nature08473 - DOI - PMC - PubMed
    1. Stirnimann, C. U., Ptchelkine, D., Grimm, C. & Müller, C. W. Structural basis of TBX5–DNA recognition: the T-box domain in its DNA-bound and -unbound form. J. Mol. Biol.400, 71–81 (2010). 10.1016/j.jmb.2010.04.052 - DOI - PubMed
    1. Helene, C. Specific recognition of guanine bases in protein–nucleic acid complexes. FEBS Lett.74, 10–13 (1977). 10.1016/0014-5793(77)80740-0 - DOI - PubMed

LinkOut - more resources