. 2024 Aug 5;14(1):18125.
doi: 10.1038/s41598-024-69187-9.

The role of immune cells and immune related genes in the tumor microenvironment of papillary thyroid cancer and their significance for immunotherapy

Affiliations

The role of immune cells and immune related genes in the tumor microenvironment of papillary thyroid cancer and their significance for immunotherapy

Xumei Li et al. Sci Rep. .

Abstract

Papillary thyroid carcinoma (PTC) is the most common pathological type of thyroid cancer (THCA) and shows a better prognosis than other types. However, further research is needed to determine the risk of PTC. We herein used the CIBERSORT algorithm to analyze the gene-expression profile obtained from TCGA, estimated the infiltration ratio of 22 immune cell types in tumor tissues and normal tissues, analyzed the differential expression of immune-related genes, and identified immune cells and immune-related genes related to clinical progress and prognosis. We uncovered 12 immune cell types and nine immune-related genes that were closely correlated with TNM staging, and two immune cell types (activated NK cells and γδT cells) and one immune-related gene (CD40LG) that were associated with prognosis. After evaluation, four immune cell types could be used to determine low-risk PTC, with six immune cell types and six immune-related genes closely associated with high-risk PTC. The type and quantity of infiltrating immune cells in the microenvironment of PTC, as well as immune-related genes, appear to be closely related to tumor progression and can therefore be used as important indicators for the evaluation of patient prognosis. We posit that the study of immune cells and immune-related genes in the tumor microenvironment will facilitate the determination of low-risk PTC more accurately, and that this will greatly promote the development of high-risk PTC immunotherapy.

Keywords: CD40LG; Immune genes; PTC; Tumor microenvironment.


Conflict of interest statement

The authors declare no competing interests.

Figures

Figure 1
Figure 1
The proportions of infiltrating cells by 22 immune cell types in PTC tissues. (A) The composite pie chart shows the percentages of infiltrating cells by total T cells, total macrophages, total B cells, total NK cells, and other cells in PTC. (B) The percentages of various infiltrating T cells in PTC. (C) The percentages of infiltration by M0, M1, and M2 macrophages in PTC. (D) The percentages of infiltration by activated B cells, resting B cells, activated NK cells, and resting NK cells in PTC. (E) The percentages of infiltration by various other cell types in PTC.
Figure 2
Figure 2
Differential distribution of 22 types of immune cells in PTC tissues and normal tissues. (A) Percentage bar chart shows the proportions of 22 types of immune cells. (B) Heatmap shows the infiltration by 22 types of immune cells in PTC tissues and normal tissues; green represents low infiltration, black represents moderate infiltration, and red represents high infiltration. (C) The violin diagram shows the differences in the infiltration ratios of 22 types of immune cells in PTC tissues and normal tissues, with blue indicating normal tissues and red indicating PTC tissues.
Figure 3
Figure 3
Correlation analysis of 22 types of immune cells in PTC tissues. The correlation heatmap depicts the correlation between immune cells, with red representing a positive correlation and blue representing a negative correlation.
Figure 4
Figure 4
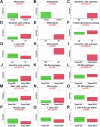
Correlation analysis between immune cells and TNM staging. (A,B) The correlation analysis of monocytes and neutrophils with T staging, respectively (T1 & T2 shows that the tumor was limited to the thyroid gland and that its diameter was not greater than 4 cm; T3 & T4 depict tumor growth in the thyroid gland with a diameter greater than 4 cm or infiltration outside the thyroid gland). (CG) The correlation analysis between activated dendritic cells, resting dendritic cells, neutrophils, resting CD4+ memory T cells, and CD8+ T cells with N staging, respectively (N0 represents no lymph node metastasis, and N1 represents lymph node metastasis). (H) illustrates the correlation analysis between neutrophils and M staging (M0 represents no distant metastasis, M1 represents distant metastasis). (IR) The correlation analysis of activated dendritic cells, resting dendritic cells, M0 macrophages, M2 macrophages, resting mast cells, monocytes, M1 macrophages, plasma cells, CD8+ T cells, and follicular helper T cells with TNM staging, respectively.
Figure 5
Figure 5
Correlation analysis between immune cells and prognosis of PTC patients, as well as screening and enrichment analysis of immune-related DEGs. (A,B) The correlation analysis of activated NK cells and γδT cells with prognosis, respectively. (C) Volcano map showing the distribution of DEGs, with red indicating upregulated genes and green indicating downregulated genes. (D) KEGG-enrichment analysis. (E) Volcano map showing the distribution of immune-related DEGs, with red indicating upregulated genes and green indicating downregulated genes. (F) GO-enrichment analysis.
Figure 6
Figure 6
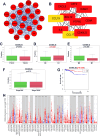
Screening of key genes and correlation analysis between TNM staging and prognosis. (A) The major module in the PPI network. (B) The 10 key genes in the major module. (CF) The correlation analysis between CD40LG and TNM staging. (G) The correlation analysis between CD40LG and prognosis of PTC patients. (H) Using the TIMER database to analyze the expression of CD40LG in tumors, THCA represents thyroid cancer, red represents tumor tissue, and blue represents normal tissue (statistical significance: *p < 0.05, **p < 0.01, ***p < 0.001).

Similar articles

Cited by

References

    1. Sung, H. et al. Global cancer statistics 2020: GLOBOCAN estimates of incidence and mortality worldwide for 36 cancers in 185 countries. CA Cancer J. Clin.71, 209–249 (2021). 10.3322/caac.21660 - DOI - PubMed
    1. Kilfoy, B. A., Zheng, T., Holford, T. R. & Zhang, Y. International patterns and trends in thyroid cancer incidence. Cancer Causes Control20, 521–531 (2009).10.1007/s10552-008-9260-4 - DOI - PMC - PubMed
    1. Bray, F. et al. Global cancer statistics 2018: GLOBOCAN estimates of incidence and mortality worldwide for 36 cancers in 185 countries. CA Cancer Clin.68, 394–424 (2018).10.3322/caac.21492 - DOI - PubMed
    1. Wang, Z. & Guan, H. Hear the patient’s voice regarding implementation of thyroid cancer active surveillance in China. Thyroid Off. J. Am. Thyroid Assoc.33, 782–784 (2023).10.1089/thy.2023.0058 - DOI - PubMed
    1. Fagin, J. A., Longo, D. L. & Wells, S. A. Biologic and clinical perspectives on thyroid cancer. N. Engl. J. Med.375, 1054–1067 (2016). 10.1056/NEJMra1501993 - DOI - PMC - PubMed

MeSH terms

Substances

LinkOut - more resources