. 2024 Aug 5;14(1):18110.
doi: 10.1038/s41598-024-69185-x.

Comprehensive analysis of sialylation-related genes and construct the prognostic model in sepsis

Affiliations

Comprehensive analysis of sialylation-related genes and construct the prognostic model in sepsis

Linfeng Tao et al. Sci Rep. .

Abstract

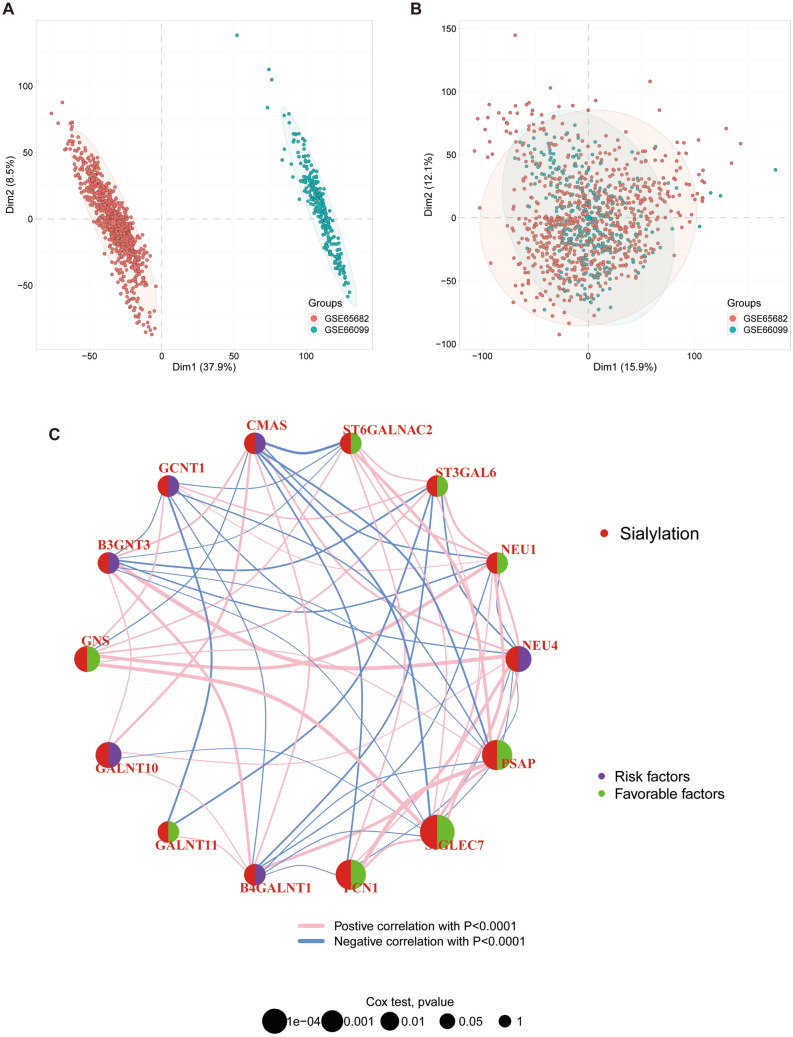
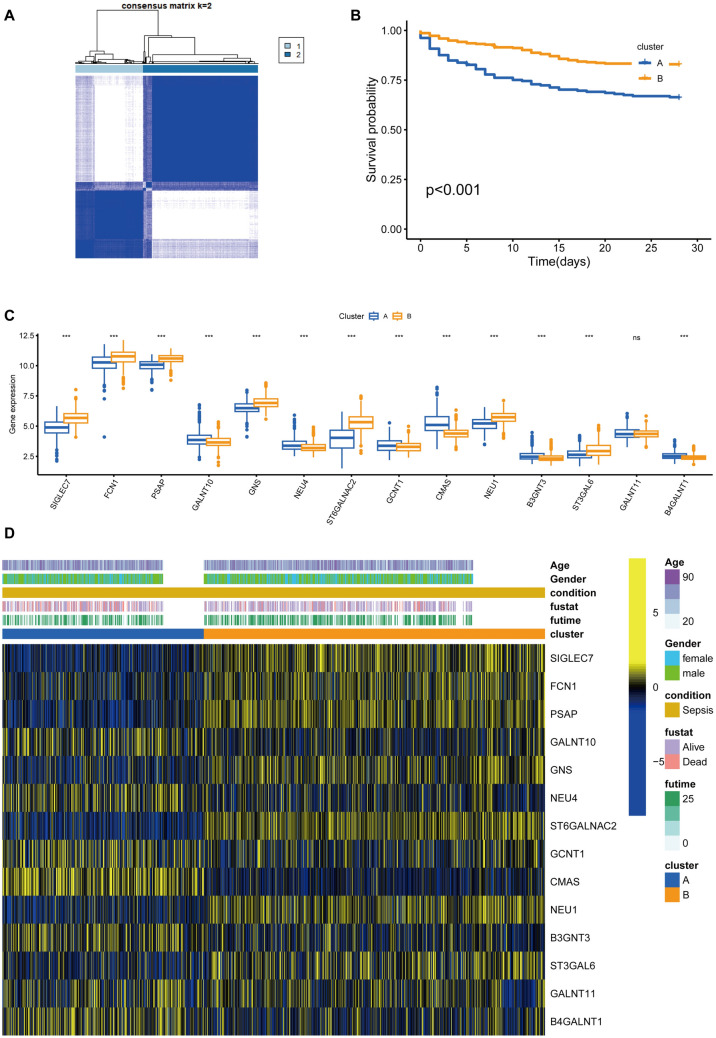
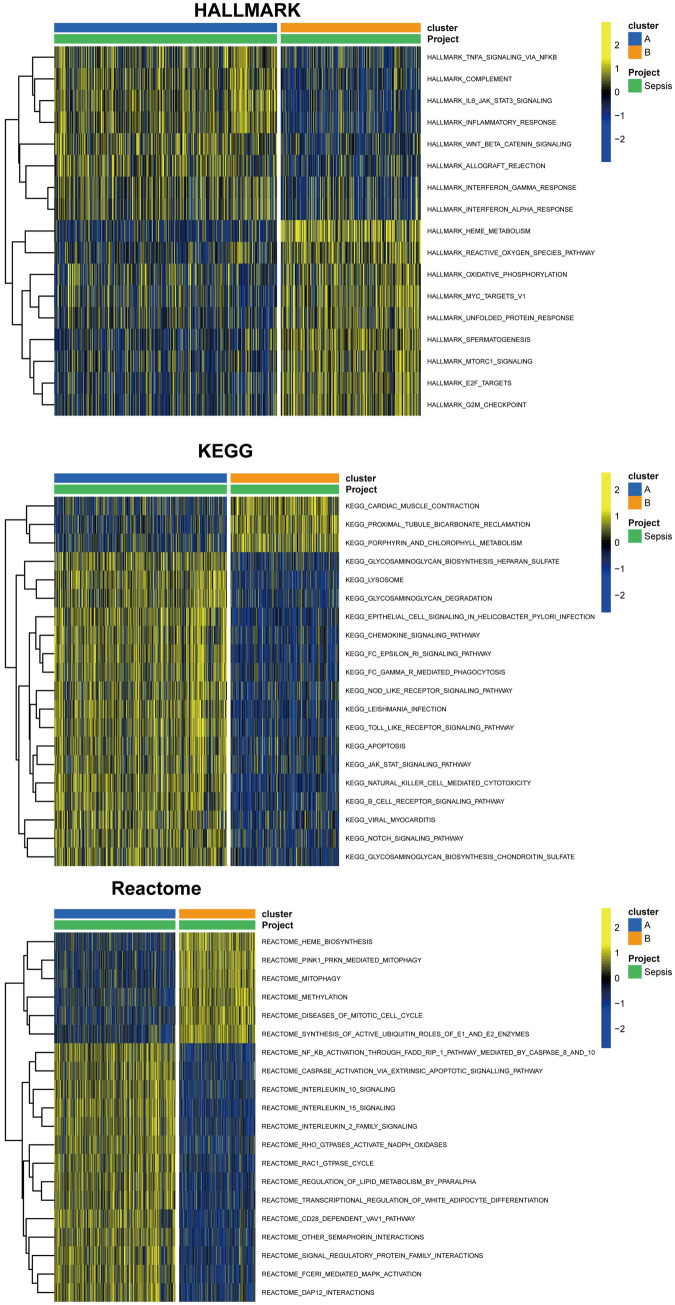
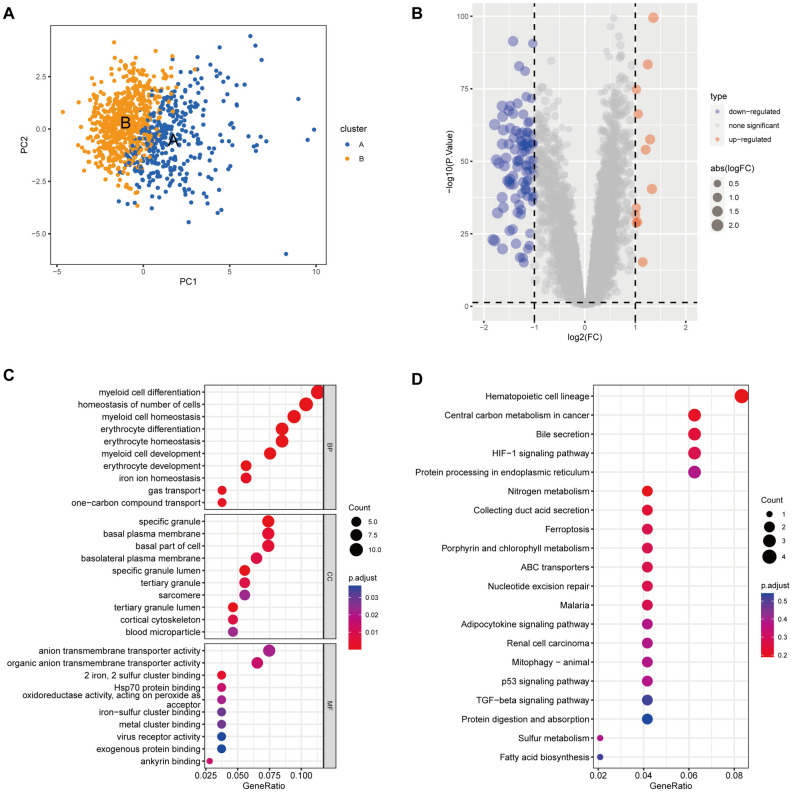
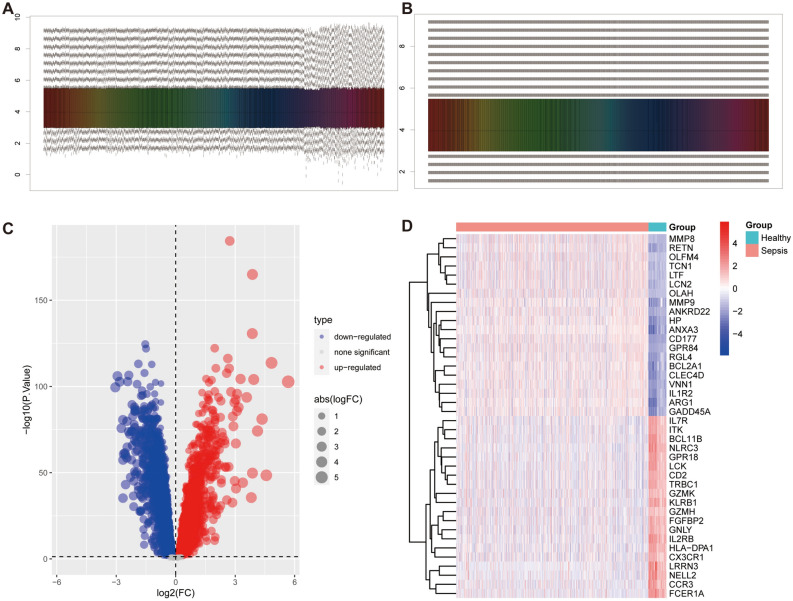
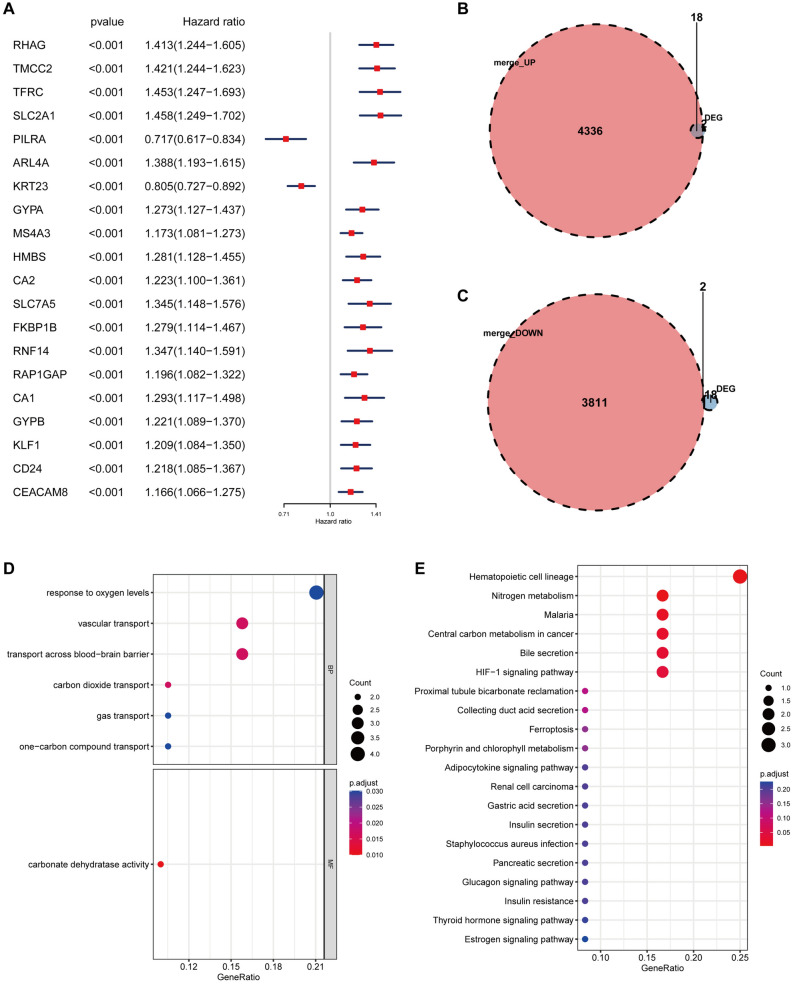
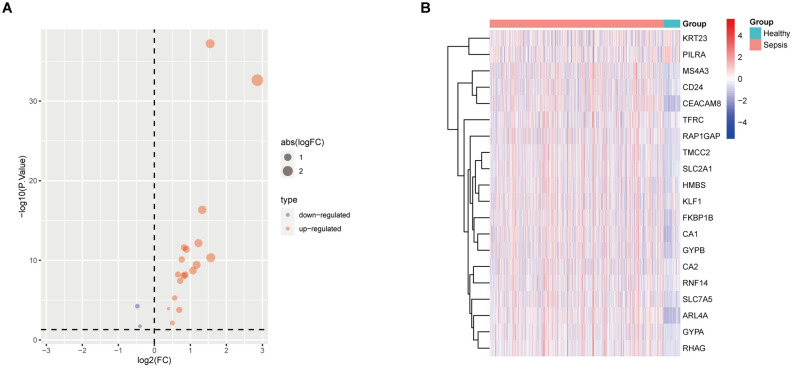
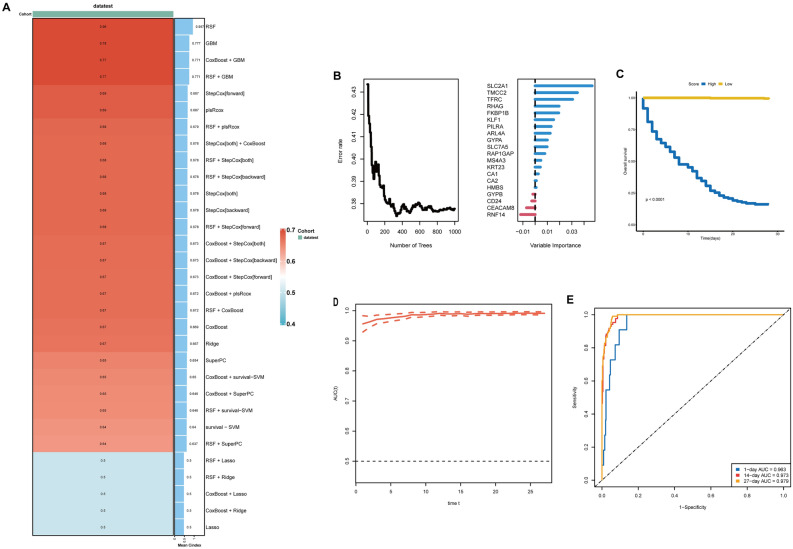
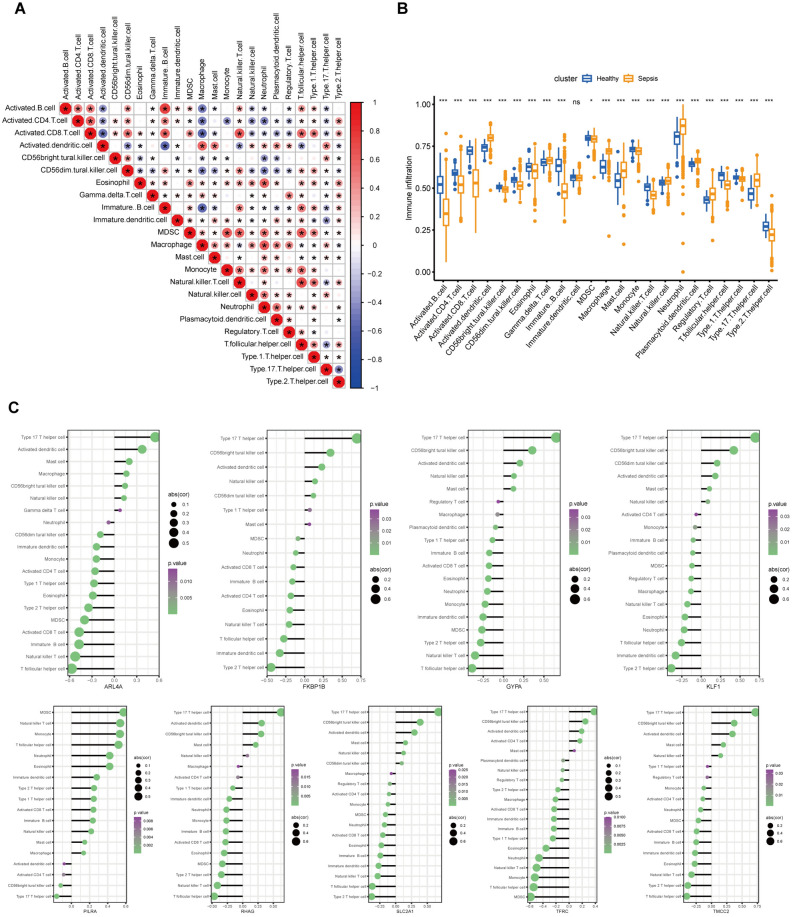
Sepsis, a life-threatening syndrome, continues to be a significant public health issue worldwide. Sialylation is a hot potential marker that affects the surface of a variety of cells. However, the role of genes related to sialylation and sepsis has not been fully explored. Bulk RNA-seq data sets (GSE66099 and GSE65682) were obtained from the open-access databases GEO. The classification of sepsis samples into subtypes was achieved by employing the R package "ConsensusClusterPlus" on the bulk RNA-seq data. Hub genes were discerned through the application of the R package "limma" and univariate regression analysis, with the calculation of risk scores carried out using the R package "survminer". To identify the best learning method and construct a prognostic model, we used 21 different combinations of machine learning, and C-index ranking results of these combinations have been showed. ROC curves, time-dependent ROC curves, and Kaplan-Meier curves were utilized to evaluate the diagnostic accuracy of the model. The R packages "ESTIMATE" and "GSVA" were employed to quantify the fractions of immune cell infiltration in each sample. The bulk RNA-seq samples were categorized into two distinct sepsis subtypes utilizing 14 prognosis-related sialylation genes. A total of 20 differentially expressed genes (DEGs) were identified as being associated with the relationship between sepsis and sialylation. The RSF was used to identify key genes with importance scores higher than 0.01. The nine hub genes (SLA2A1, TMCC2, TFRC, RHAG, FKBP1B, KLF1, PILRA, ARL4A, and GYPA) with the importance values greater than 0.01 was selected for constructing the prognostic model. This research offers some understanding of the relationship between sepsis and sialylation. Besides, it contains one predictive model that might develop into diagnostic biomarkers for sepsis.

Keywords: Bulk RNA-seq; Sepsis; Sialylation.


Conflict of interest statement

The authors declare no competing interests.

Figures

Figure 1
Figure 1
Analysis of Sialylation-related Genes in sepsis samples. (A,B) PCA plots of GSE65682 and GSE66099 datasets before (A) and after (B) integration by “limma” and “sva” packages. (C) Correlation analysis and Univariate regression analysis across 14 prognosis-related sialylation genes. Lines indicate a significant correlation between sialylation-related genes (p < 0.0001); purple indicates risk factors and green indicates favorable factors for OS.
Figure 2
Figure 2
Identification of two sepsis-subtypes by consensus clustering analysis based on prognosis-related sialylation genes. (A) Consensus matrix plots. K = 2 was determined as the optimal clustering number. (B) Kaplan–Meier survival analysis in clusters. (C) Differential expression of prognosis-related sialylation genes in two sepsis subtypes. (D) Heatmap of the interaction between prognosis-related sialylation genes and clinicopathological features in sepsis. (*p < 0.05, **p < 0.01, ***p < 0.001 ****p < 0.0001).
Figure 3
Figure 3
Functional enrichment analysis between two clusters by different database. (A) Heatmap results of HALLMARK pathway (B) KEGG pathway (www.kegg.jp/kegg/kegg1.html) (C) and Reactome pathway enrichment analysis.
Figure 4
Figure 4
Identification and functional enrichment analysis of DEGs among two clusters. (A) PCA plot of sample distribution for two clusters. (B) The volcano map shows the distribution of DEGs between the two clusters. (C) Bubble plots of the GO terms of DEGs. (D) Bubble plots of the KEGG pathways of DEGs.
Figure 5
Figure 5
Identification of DEGs between healthy and sepsis samples. (A,B) Homogenize the GSE65682 and GSE66099 datasets. Before homogenization (A); After homogenization (B). (C) The volcano map shows the distribution of DEGs between the healthy and sepsis samples. (D) The heat map shows the expression of the DEGs in healthy and sepsis samples.
Figure 6
Figure 6
GO/KEGG enrichment analysis was performed on the DEGs in the healthy and sepsis samples. GO annotations, showing the pathways annotated in BP (A), CC (B), MF (C), respectively. (D) Results of KEGG pathway enrichment analysis.
Figure 7
Figure 7
Screening of prognostic-related genes in sepsis. (A) Univariate regression analysis was performed on the 112 DEGs between cluster -A and -B in sepsis samples. Forest plot shows 20 genes that meet the p-value < 0.001 criteria. (B) The intersection of the up-regulation DEGs with 20 genes. (C) The intersection of the down-regulation DEGs with 20 genes. GO (D) /KEGG (E) enrichment analysis of intersecting genes.
Figure 8
Figure 8
Different expression of prognostic-related genes in healthy and sepsis samples. Volcano plot (A) and heatmap (B) show the distribution of genes across samples, respectively.
Figure 9
Figure 9
Build prognostic model based on a variety of machine learning. (A) C-Index of 31 machine learning algorithms. (B) Random forest method result. (C) Survival analysis of machine learning score by random forest method. (D) Time-dependent ROC curve based on random forest method. (E) ROC curve based on random forest method.
Figure 10
Figure 10
Assessment of the immune microenvironment. (A) Correlation between immune cells in the whole sample. (B) Differences in immune cells between healthy and sepsis samples. (C) Correlation of core genes (ARL4A, FKBP1B, GYPA, KLF1, PILRA, RHAG, SLC2A1, TFRC, TMCC2) in the prognostic model with immune cells.

Similar articles

Cited by

References

    1. Singer, M. et al. The third international consensus definitions for sepsis and septic shock (Sepsis-3). JAMA315(8), 801 (2016). 10.1001/jama.2016.0287 - DOI - PMC - PubMed
    1. Schlapbach, L. J. Paediatric sepsis. Curr. Opin. Infect. Dis.32(5), 497–504 (2019). 10.1097/QCO.0000000000000583 - DOI - PubMed
    1. Liu, Y.-C. et al. Frequency and mortality of sepsis and septic shock in China: A systematic review and meta-analysis. BMC Infect. Dis.10.1186/s12879-022-07543-8 (2022). 10.1186/s12879-022-07543-8 - DOI - PMC - PubMed
    1. Gao, X.-M. et al. Identification of key genes in sepsis by WGCNA. Prev. Med.172, 107540 (2023). 10.1016/j.ypmed.2023.107540 - DOI - PubMed
    1. Pleass, R. J. The therapeutic potential of sialylated Fc domains of human IgG. mAbs10.1080/19420862.2021.1953220 (2021). 10.1080/19420862.2021.1953220 - DOI - PMC - PubMed