

Identifying and validating the roles of the cuproptosis-related gene DKC1 in cancer with a focus on esophageal carcinoma
- PMID: 39103487
- PMCID: PMC11300667
- DOI: 10.1007/s00432-024-05870-8
Identifying and validating the roles of the cuproptosis-related gene DKC1 in cancer with a focus on esophageal carcinoma
Abstract
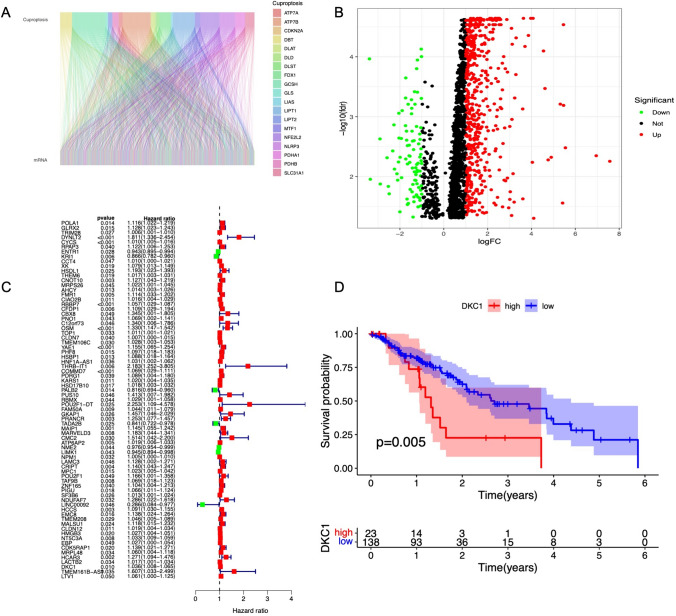
Background: Esophageal cancer is a common malignancy of the digestive tract. Despite remarkable advancements in its treatment, the overall prognosis for patients remains poor. Cuproptosis is a form of programmed cell death that affects the malignant progression of tumors. This study aimed to examine the impact of the cuproptosis-associated gene DKC1 on the malignant progression of esophageal cancer.
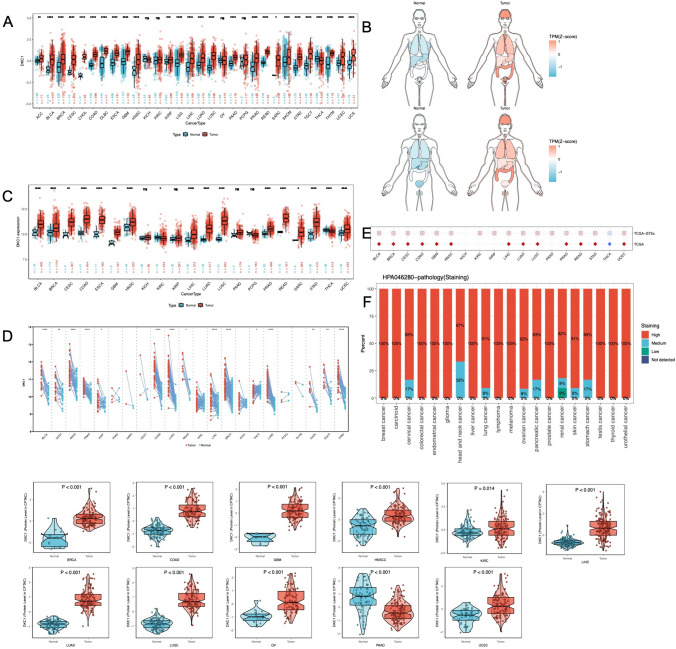
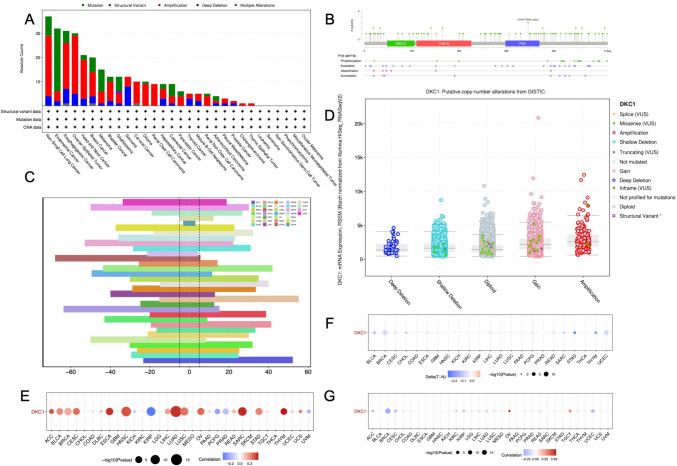
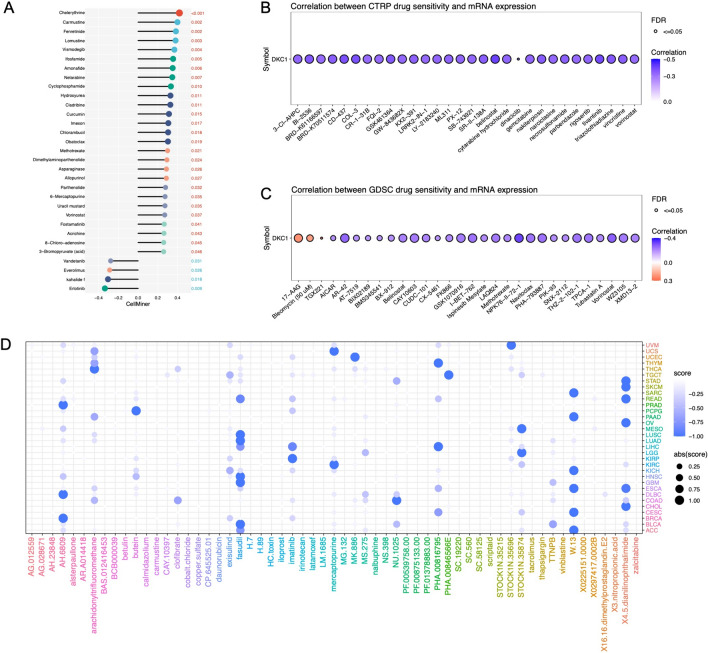
Methods: Clinical and RNA sequencing data of patients with esophageal cancer were extracted from The Cancer Genome Atlas (TCGA). Univariate Cox regression analysis was used to identify the differentially expressed genes related to cuproptosis that are associated with prognosis. We then validated the difference in the expression of DKC1 between tumor and normal tissues via three-dimensional multiomics difference analysis. Subsequently, we investigated the association between DKC1 expression and the tumor microenvironment by employing the TIMER2.0 algorithm, which was further validated in 96 single-cell datasets obtained from the TISCH database. Additionally, the functional role of DKC1 in pancarcinoma was assessed through GSEA. Furthermore, a comprehensive pancancer survival map was constructed, and the expression of DKC1 was verified in various molecular subtypes. By utilizing the CellMiner, GDSC, and CTRP databases, we successfully established a connection between DKC1 and drug sensitivity. Finally, the involvement of DKC1 in the progression of esophageal cancer was investigated through in vivo and in vitro experiments.
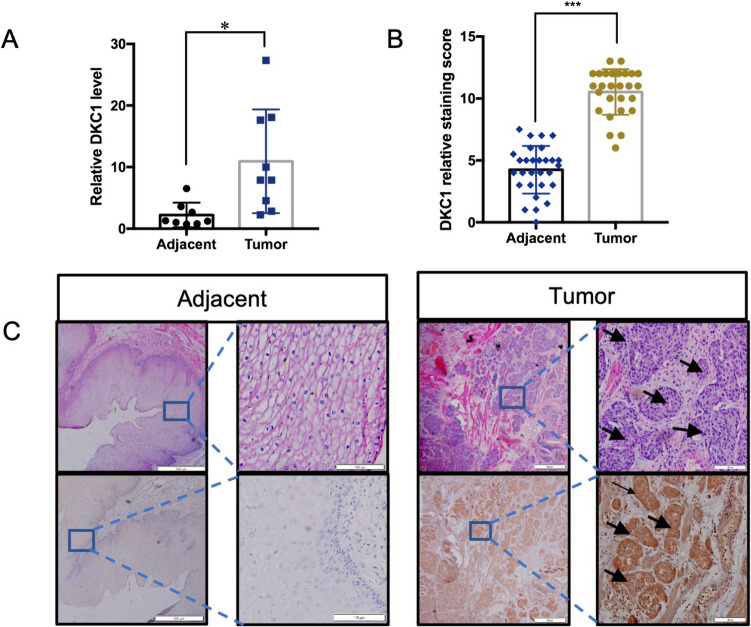
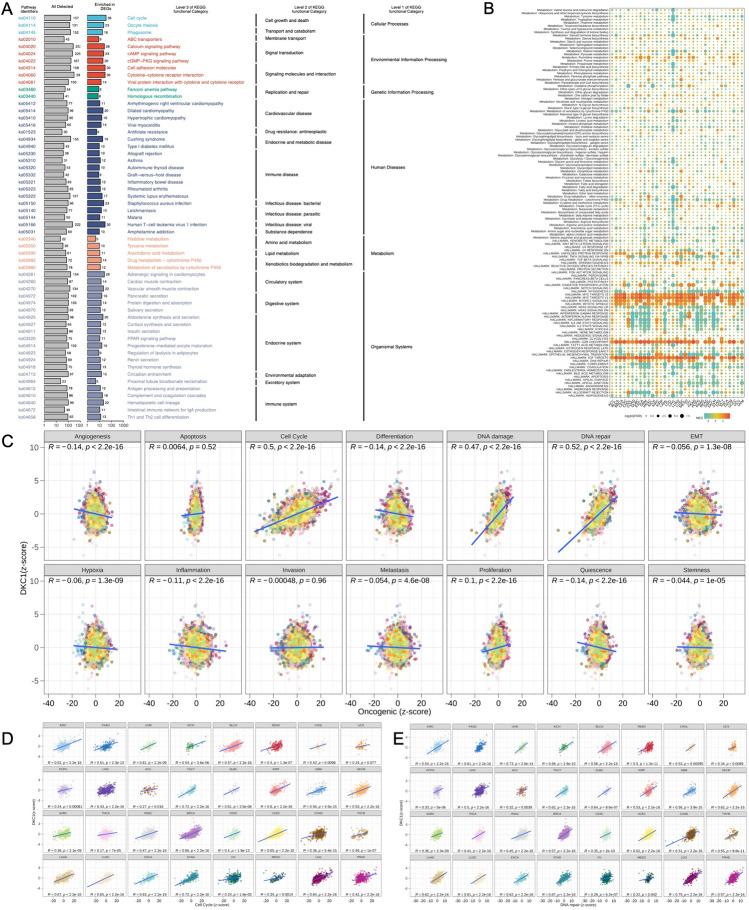
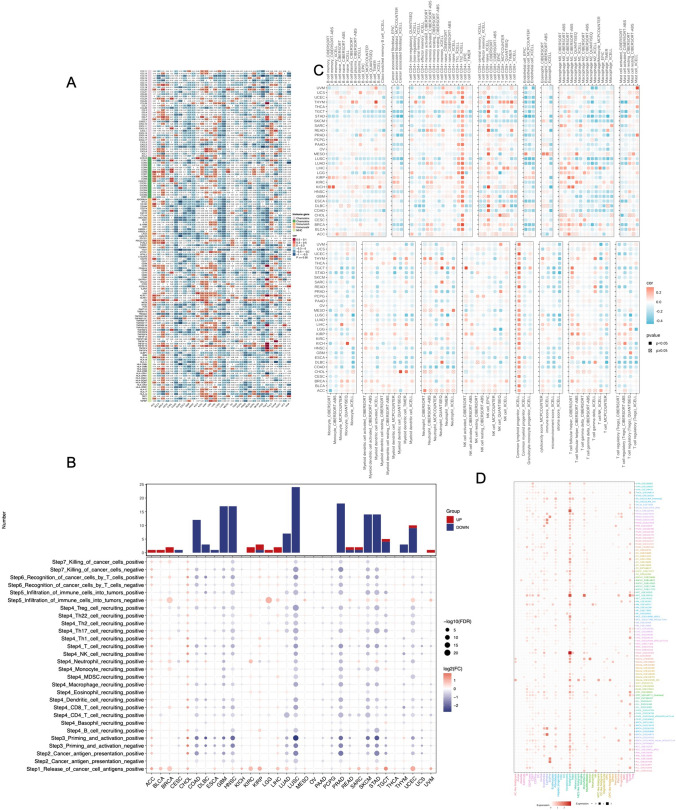
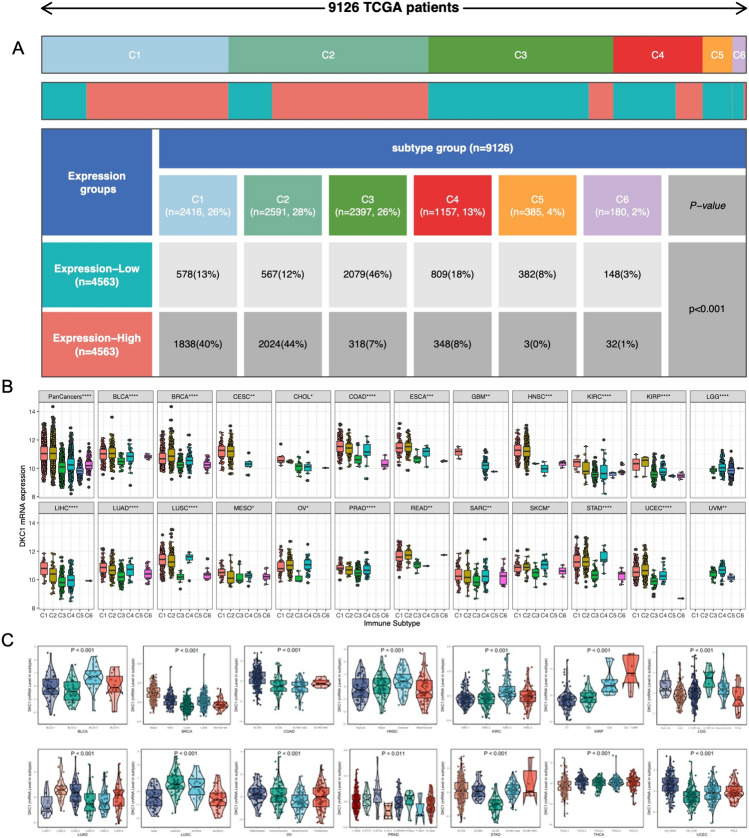
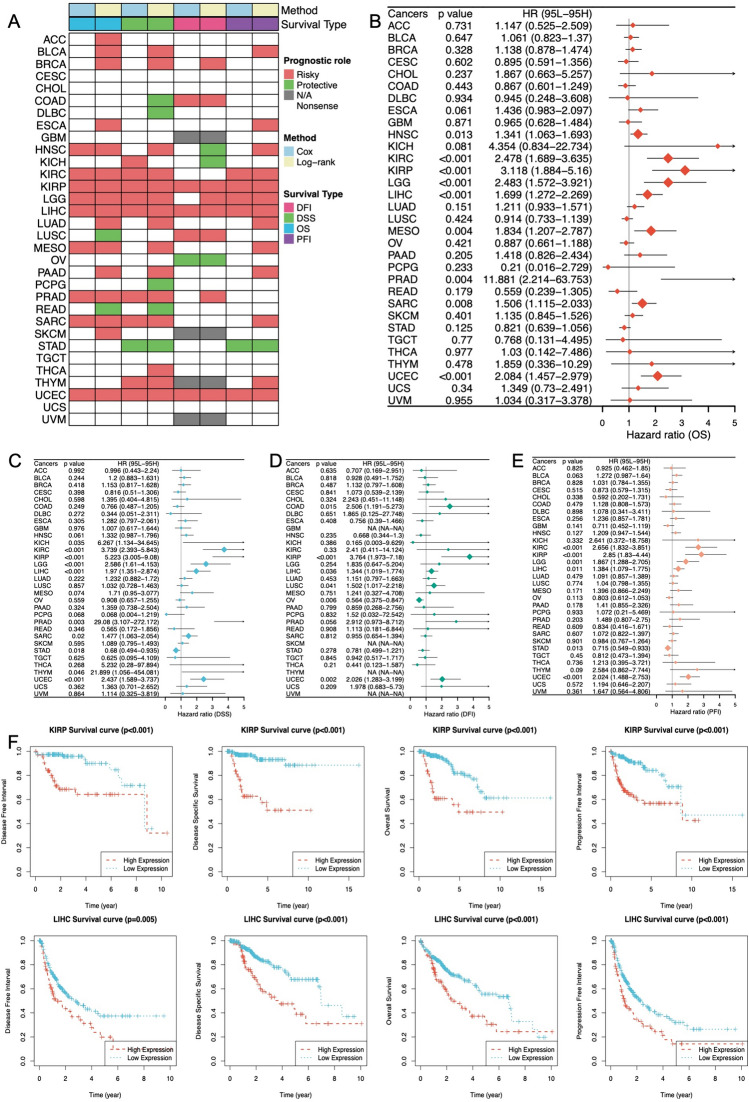
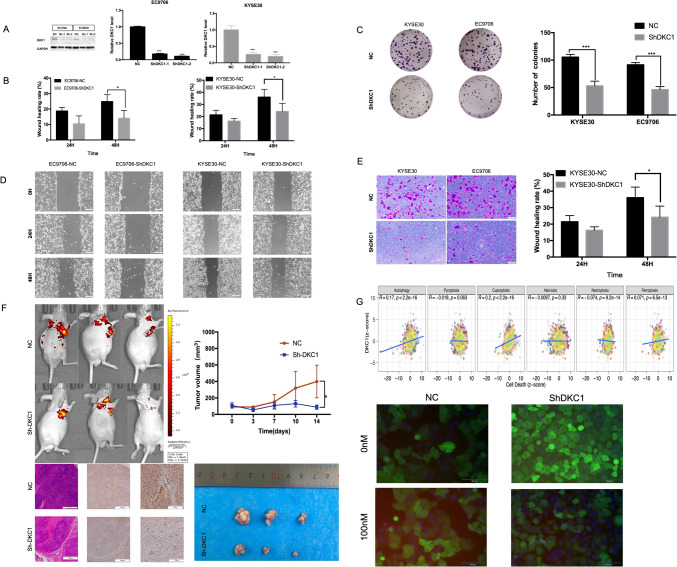
Results: In this study, we identified a copper death-related gene, DKC1, in esophageal cancer. Furthermore, we observed varying levels of DKC1 expression across different tumor types. Additionally, we conducted an analysis to determine the correlation between DKC1 expression and clinical features, revealing its association with common cell cycle pathways and multiple metabolic pathways. Notably, high DKC1 expression was found to indicate poor prognosis in patients with various tumors and to influence drug sensitivity. Moreover, our investigation revealed significant associations between DKC1 expression and the expression of molecules involved in immune regulation and infiltration of lymphocyte subtypes. Ultimately, the increased expression of DKC1 in esophageal cancer tissues was verified using clinical tissue samples. Furthermore, DKC1-mediated promotion of esophageal cancer cell proliferation and migration was confirmed through both in vitro and in vivo experiments. Additionally, it is plausible that DKC1 may play a role in the regulation of cuproptosis.
Conclusion: In this study, we conducted a systematic analysis of DKC1 and its regulatory factors and experimentally validated its excellent diagnostic and prognostic abilities in various cancers. Further research indicated that DKC1 may reshape the tumor microenvironment (TME), highlighting the potential of DKC1-based cancer treatment and its usefulness in predicting the response to chemotherapy.
Keywords: DKC1; Diagnosis; Esophageal carcinoma; Prognosis; Tumor microenvironment.
© 2024. The Author(s).
Conflict of interest statement
The authors declare no conflict of interest.
Figures
Similar articles
-
Subtype cluster analysis unveiled the correlation between m6A- and cuproptosis-related lncRNAs and the prognosis, immune microenvironment, and treatment sensitivity of esophageal cancer.Front Immunol. 2025 Feb 17;16:1539630. doi: 10.3389/fimmu.2025.1539630. eCollection 2025. Front Immunol. 2025. PMID: 40034693 Free PMC article.
-
Identification of cuproptosis-related subtypes, construction of a prognosis model, and tumor microenvironment landscape in gastric cancer.Front Immunol. 2022 Nov 21;13:1056932. doi: 10.3389/fimmu.2022.1056932. eCollection 2022. Front Immunol. 2022. PMID: 36479114 Free PMC article.
-
GLN2 as a key biomarker and therapeutic target: evidence from a comprehensive pan-cancer study using molecular, functional, and bioinformatic analyses.Discov Oncol. 2024 Nov 19;15(1):681. doi: 10.1007/s12672-024-01516-w. Discov Oncol. 2024. PMID: 39562405 Free PMC article.
-
Identification of a novel cuproptosis-related gene signature and integrative analyses in patients with lower-grade gliomas.Front Immunol. 2022 Aug 15;13:933973. doi: 10.3389/fimmu.2022.933973. eCollection 2022. Front Immunol. 2022. PMID: 36045691 Free PMC article. Review.
-
Decoding the role of FOXP3 in esophageal cancer: Underlying mechanisms and therapeutic implications.Biochim Biophys Acta Rev Cancer. 2024 Nov;1879(6):189211. doi: 10.1016/j.bbcan.2024.189211. Epub 2024 Nov 10. Biochim Biophys Acta Rev Cancer. 2024. PMID: 39532205 Review.
References
-
- Allemani C, Matsuda T, Di Carlo V, Harewood R, Matz M, Niksic M, Bonaventure A, Valkov M, Johnson CJ, Esteve J, Ogunbiyi OJ, Azevedo ESG, Chen WQ, Eser S, Engholm G, Stiller CA, Monnereau A, Woods RR, Visser O, Lim GH, Aitken J, Weir HK, Coleman MP, Group CW (2018) Global surveillance of trends in cancer survival 2000–14 (CONCORD-3): analysis of individual records for 37 513 025 patients diagnosed with one of 18 cancers from 322 population-based registries in 71 countries. Lancet 391(10125):1023–1075. 10.1016/S0140-6736(17)33326-3 - PMC - PubMed
-
- Cerami E, Gao J, Dogrusoz U, Gross BE, Sumer SO, Aksoy BA, Jacobsen A, Byrne CJ, Heuer ML, Larsson E, Antipin Y, Reva B, Goldberg AP, Sander C, Schultz N (2012) The cBio cancer genomics portal: an open platform for exploring multidimensional cancer genomics data. Cancer Discov 2(5):401–404. 10.1158/2159-8290.CD-12-0095 - PMC - PubMed
-
- Cui L, Gouw AM, LaGory EL, Guo S, Attarwala N, Tang Y, Qi J, Chen YS, Gao Z, Casey KM, Bazhin AA, Chen M, Hu L, Xie J, Fang M, Zhang C, Zhu Q, Wang Z, Giaccia AJ, Gambhir SS, Zhu W, Felsher DW, Pegram MD, Goun EA, Le A, Rao J (2021) Mitochondrial copper depletion suppresses triple-negative breast cancer in mice. Nat Biotechnol 39(3):357–367. 10.1038/s41587-020-0707-9 - PMC - PubMed
MeSH terms
Substances
Grants and funding
LinkOut - more resources
Full Text Sources
Medical
Molecular Biology Databases
