. 2024 Nov;43(22):5340-5359.
doi: 10.1038/s44318-024-00183-5. Epub 2024 Aug 5.

Real-time assessment of mitochondrial DNA heteroplasmy dynamics at the single-cell level

Affiliations

Real-time assessment of mitochondrial DNA heteroplasmy dynamics at the single-cell level

Rodaria Roussou et al. EMBO J. 2024 Nov.

Abstract

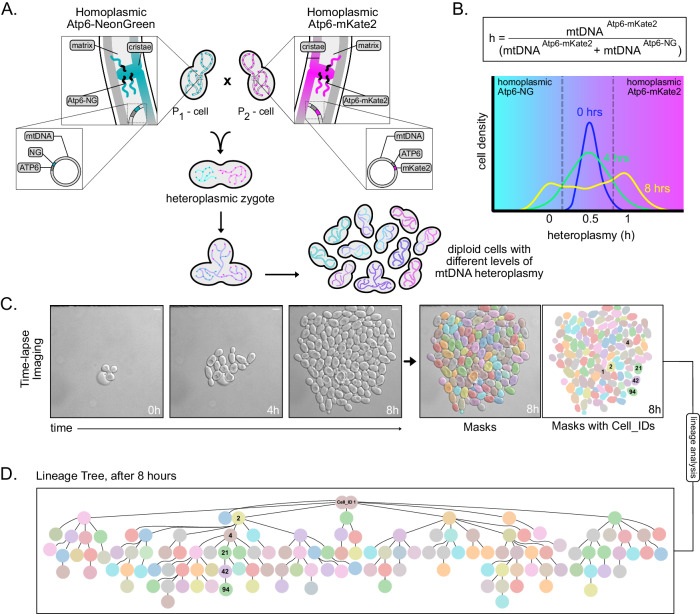
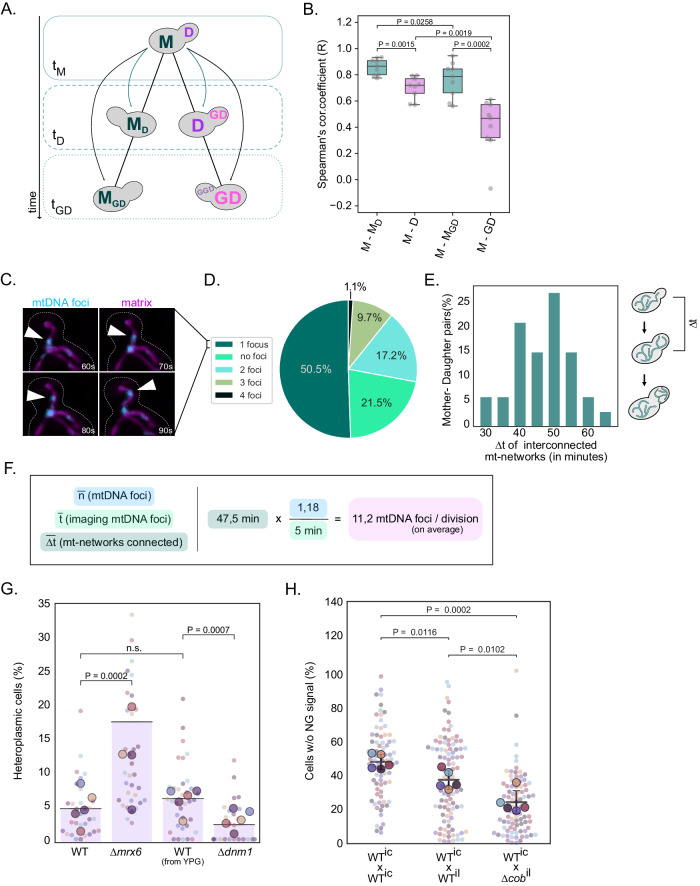
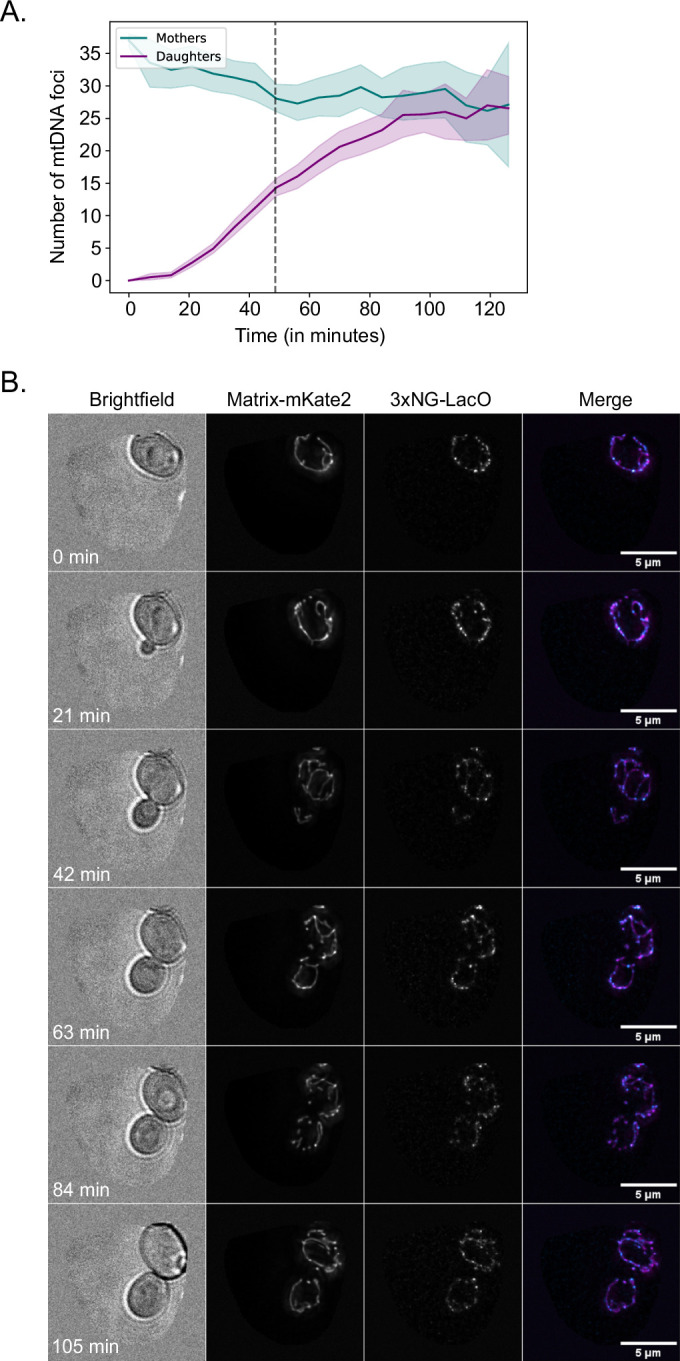
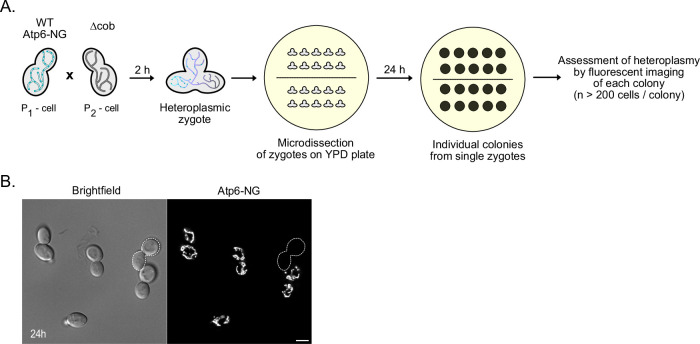
Mitochondrial DNA (mtDNA) is present in multiple copies within cells and is required for mitochondrial ATP generation. Even within individual cells, mtDNA copies can differ in their sequence, a state known as heteroplasmy. The principles underlying dynamic changes in the degree of heteroplasmy remain incompletely understood, due to the inability to monitor this phenomenon in real time. Here, we employ mtDNA-based fluorescent markers, microfluidics, and automated cell tracking, to follow mtDNA variants in live heteroplasmic yeast populations at the single-cell level. This approach, in combination with direct mtDNA tracking and data-driven mathematical modeling reveals asymmetric partitioning of mtDNA copies during cell division, as well as limited mitochondrial fusion and fission frequencies, as critical driving forces for mtDNA variant segregation. Given that our approach also facilitates assessment of segregation between intact and mutant mtDNA, we anticipate that it will be instrumental in elucidating the mechanisms underlying the purifying selection of mtDNA.

Keywords: Heteroplasmy; Mathematical Modeling; Mitochondria; Mitochondrial Fission; mtDNA.


Conflict of interest statement

Disclosure and competing interests statement The authors declare no competing interests.

Figures

Figure 1
Figure 1. Schematic of the mtDNA heteroplasmy pipeline.
(A) Strains harboring either mtDNAAtp6-NG or mtDNAAtp6-mKate2 are mated. The growth of a population derived from single zygotes is monitored in a microfluidic chamber, resulting in diploid cells with different levels of mtDNA heteroplasmy. (B) The heteroplasmy value (h) of each cell is calculated by dividing the fluorescent signal of Atp6-mKate2 by the sum of Atp6-NG and Atp6-mKate2. Example of heteroplasmy distributions at three indicated timepoints. Cells with h-values lower than 0.5 (cyan area) contain a higher proportion of mtDNAAtp6-NG, while cells with h-values above 0.5 (magenta area) contain a higher proportion of mtDNAAtp6-mKate2. (C) Representative bright-field images of a cell population derived from a single zygote, after an 8-h time-lapse video. Cell segmentation and masking was performed with the Cell-ACDC software. Scale bars: 5 µm. (D) Lineage tree derived from the zygote shown in (C), at the end of the recording. One lineage is annotated as an example, with cell identities matching the mask IDs in (C).
Figure 2
Figure 2. Atp6-NG and Atp6-mKate2 are valid proxies for mtDNA variants.
(A, B) Yeast cells harboring Atp6-NG (A) or Atp6-mKate2 (B) mtDNA were imaged for 8 h on a microfluidic chip. Fluorescence images are maximum-intensity projections of z-stacks, after deconvolution. Scale bars: 5 µm. (C) Wildtype and ∆abf2 cells harboring Atp6-NG or Atp6-mKate2 mtDNA were imaged for 10 h. Cells were first grown in YPG and supplied with minimal media during the microfluidic imaging. The color representation on the heatmap bar corresponds to the pixel intensity of Atp6. Fluorescence images are maximum-intensity projections of z-stacks, after deconvolution. Scale bars: 5 µm. (D) The coefficient of variation (CV) of fluorescence among cells at the last timepoint was calculated for indicated strains. Strains were pre-cultured in YPG and put into minimal media for microfluidic imaging. Each dot represents the CV of a population derived from single cells (n > 1000 cells analyzed in total per strain). The mean and SD of the CV per strain is shown (N = 3). (E) Line graph showing the normalized fluorescent intensities of Atp6-NG or Atp6-mKate2 assessed during growth of mtDNAAtp6-NG or mtDNAAtp6-mKate2 strains. Cells were constantly supplied with minimal medium containing (N = 6) or lacking (N = 3) 1 mg/ml Chloramphenicol (CAP) for mtDNA translation inhibition. Intensities were normalized to the median fluorescence intensity of the first timepoint per replicate. Data represent mean and shaded areas show the 95% confidence interval per strain. Decay rates for each fluorophore were calculated by fitting an exponential to the intensity levels of fluorescence upon CAP treatment. (F) Line graph represents the normalized fluorescent intensities of cells expressing Atp6-NG or Atp6-mKate2, during a 12-hr recording. Cells were first incubated for 6 h in minimal media with 1 mg/ml CAP and upon washing off the drug, cells were kept in minimal media until the end of each experiment. Data represent the mean and the shadow areas show the 95% confidence interval per strain (N = 3). Source data are available online for this figure.
Figure 3
Figure 3. Rapid shift of mtDNA content in heteroplasmic cell populations.
(A) Representative images of a heteroplasmic population at indicated timepoints. Log-phase yeast cells harboring Atp6-NG (cyan) and Atp6-mKate2 (magenta) mtDNA were mated for 1.5 h prior to each microfluidic experiment. Individual heteroplasmic zygotes were chosen in a single field-of-view (FOV) and the growing cell populations were imaged for 8 h on a microfluidic chip. Fluorescence images are maximum-intensity projections of z-stacks, after deconvolution. Images representing the masks are derived from Cell-ACDC. Cells derived from a haploid cell present in the FOV were not segmented. Scale bars: 5 µm. (B) Joyplot of heteroplasmy levels of cells from a total of nine populations derived from heteroplasmic zygotes across the 8 h time-lapse recordings. (C) Single Gaussian curve fittings were applied on the three emerging peaks of the final cell distribution of the data at 8 h (density plot in light yellow, as in B). Three colored curves (cyan, purple, magenta) represent the cell distributions with more mtDNAAtp6-NG (cyan), more mtDNAAtp6-mKate2 (magenta), or cells harboring both (purple). Homoplasmy thresholds were set based on the intersection points of Gaussian curves. An h-value of 0.33 was set as the homoplasmy threshold for cells mainly harboring mtDNAAtp6-NG and 0.71 as the threshold for mtDNAAtp6-mKate2 homoplasmy, shown as gray dashed lines. (D) Density plot showing the heteroplasmy distribution of cells after 24 h. Atp6-NG and Atp6-mKate2 cells were mated for 2 h. Twenty individual zygotes were micro-dissected, upon growth on YPD plates for 24 h and heteroplasmic states of all cell populations were assessed by microscopy (N = 20 colonies, n = 7538 cells). Homoplasmy threshold values from the 8 h intersection points are shown in gray dashed lines. Source data are available online for this figure.
Figure 4
Figure 4. Mathematical modeling of mtDNA segregation dynamics.
(A) Mitochondria are simulated as arrays, where 0 and 1 s represent different mtDNA variants. Each single cell contains one such array with 32 mtDNA copies. The parameter nspl mimics the fission-fusion dynamics and the ndau parameter describes the number of mtDNA copies transferred to the daughter cell upon division. Each cell is allowed to give rise to a daughter cell once it reaches 32 mtDNA copies, upon random sequential replication of the inherited 0 and 1 s. In the shown example, where nspl = 6, the array splits into six fragments and then stochastically fuses back together. For simplicity, only 20 copies are shown. (B) Heatmap showing the percentage of homoplasmic cells at timepoint t = 7.5 h, for different ndau and nspl pairs. The arrow indicates the proportion (50%) of cells being virtually homoplasmic in the empirical data, based on the pre-established homoplasmy cutoffs. Each simulation with any given combination of the two parameters has been run ten times. (C) Curves display the proportion of homoplasmic cells in experimental (black line) or simulated data derived from different ndau and nspl combinations (colored lines) for timepoint t = 0, 1.5, 3, 4.5, 6, 7.5 h. The dashed line represents 50% homoplasmy. (D) Heatmap showing the least-squares distance of simulations with a given pair of ndau and nspl parameters from the experimental data, upon application of the homoplasmy thresholds. Each simulation with any given combination of the two parameters has been run ten times. Source data are available online for this figure.
Figure 5
Figure 5. Partitioning of a limited number of mtDNA molecules to the next generation facilitates rapid heteroplasmy changes.
(A) Schematic of cell relationship pairs. Correlations were calculated between mother cells and their progeny within a lineage (M-D-GD) or between themselves at later timepoints (M-MD-MGD). All cells were taken at the same growth stage, specifically 20% bud-to-mother volume ratio. (B) The box plot depicts Spearman’s correlation coefficient for the aforementioned relationship pairs, among all cell populations (N = 9). Each cell population was derived from an individual zygote. The Spearman’s correlation coefficient for each population is shown as a gray dot. The box extends from the lower to upper quartile values of the data, with a line at the median. Whiskers indicate the minimum and maximum values. P < 0.05: *, P < 0.005: **, P < 0.0005: ***, paired t-test. (C) Representative time-lapse of a spot being transferred to the bud. Yeast cells expressing 3xNG-LacI (cyan) and matrix-su9-mKate2 (magenta) labeling nucleoids and the matrix, respectively, were imaged for 5 min in 10 s intervals. The white arrowhead indicates a 3xNG-LacI focus crossing the bud neck. Amounts of foci crossing the bud neck during 5-min windows were counted. Fluorescent images are maximum-intensity projections of z-stacks, after deconvolution. Scale bar: 5 µm. (D) Percentile proportions of mtDNA foci crossing the mother-bud neck in 5 min (N = 93 mother-bud pairs). Budding cells were at different cell cycle stages. Each spot was counted as one mtDNA copy. (E) The bar plot shows the time duration during which mitochondrial networks remain connected between mothers and daughters. Mitochondrial network connectivity was examined in log-phase cells expressing matrix-targeted mKate2 (n = 33). Only cells with no visible bud at the beginning of the imaging were considered for analysis (see also Appendix Fig. S8C). (F) The calculation formula for the number of nucleoids passing per cell division, based on data derived from (C) and (E). (G) Heteroplasmy distribution in ∆mrx6 and ∆dnm1 deletion strains. Cells with increased copy number (∆mrx6) or deficient for mitochondrial fission (∆dnm1) were generated in strains containing mtDNAAtp6-NG or mtDNAAtp6-mKate2. Cells containing mtDNAAtp6-NG or mtDNAAtp6-mKate2 and the respective deletion were mated. After zygote formation and dissection, diploid colonies were grown for 18 h on a YPD plate. Each colony was imaged to assess the fraction of heteroplasmic cells (also see Appendix Fig. S9A for all data points). Of note, ∆dnm1 cells were cultivated in YPG media before mating and dissection on YPD plates, to prevent mtDNA loss. For each genotype shown, the small dots represent the percentage of heteroplasmic cells in individual colonies (n > 50 cells/colony). Each bigger dot depicts the mean of each biological replicate (N = 5), and the line is the mean of all replicates for the corresponding mating. Statistical significance was determined by paired t-test. (H) 24 h heteroplasmy assessment in matings between cells containing mutated mtDNA (∆cob) or intact mtDNA. Log-phase yeast cells harboring mtDNAAtp6-NG were mated with cells containing intact intron-containing mtDNA, intact intronless mtDNA, or intronless ∆cob mtDNA, all not expressing any fluorophore. After zygote formation and dissection, diploid colonies were grown for 24 h on a YPD plate. Each colony was imaged to assess the fraction of cells not expressing Atp6-NG. For each genotype shown, the small dots represent the percentage of heteroplasmic cells in individual colonies (n > 100 cells/colony). Each bigger dot depicts the mean of each biological replicate (N = 5), and the line is the mean of all replicates for the corresponding mating. Error bars indicate SD. Statistical significance was determined by paired t-test. Source data are available online for this figure.
Figure EV1
Figure EV1. mtDNAAtp6-NG and mtDNAAtp6-mKate2 strains with temporary exposure to chloramphenicol.
(A, B) Yeast cells harboring mtDNAAtp6-NG (A) or mtDNAAtp6-mKate2 (B) were imaged for 11 h (N = 3/strain). Chloramphenicol (1 mg/ml) was added after the first cell duplication, i.e., after 1.5 h of imaging, and was removed from the microfluidic chamber after 6 h of incubation. Fluorescence images are maximum-intensity projections of z-stacks, after deconvolution. Scale bars: 5 µm. (C) Line graph showing the fluorescent intensities of cells expressing Atp6-NG (cyan) or Atp6-mKate2 (magenta) upon washing off the Chloramphenicol (see Fig. 2F) after incubation with 1 mg/ml CAP for 6 h for sufficient mitochondrial translation inhibition. Curve fitting on the fluorescent intensity lines upon washing off the drug provides the maturation timings of the two Atp6 variants. Data represent the mean of all replicates per strain, and the shaded areas represent the 95% confidence interval. Fluorescent intensities were normalized to the cells at the first timepoint, for either of the fluorescent channels.
Figure EV2
Figure EV2. 24-h heteroplasmy assessment from 20 independent populations.
(A) Schematic of the 24-h heteroplasmy assessment experiment. Cells harboring mtDNAAtp6-NG were mated with cells containing mtDNAAtp6-mKate2 on a YPD plate. After a 2-h incubation, upon zygote formation, individual zygotes were micro-dissected and placed in different areas of a fresh YPD plate. Cells were kept for 24 h at 30 °C until colonies were formed. Cells from each colony, originating from a single zygote, were imaged to assess population homoplasmy levels, by calculating the proportion of cells exhibiting Atp6-NG and/or Atp6-mKate2 signal. (B) Representative image of a small field of view from one population, after 24 h. In total, 20 individual populations were screened, each originating from a diploid heteroplasmic zygote. Cells harboring mtDNAAtp6-NG are shown in cyan, while cells having kept the mtDNAAtp6-mKate2 are depicted in magenta. Fluorescence images are maximum-intensity projections of z-stacks, after deconvolution. Scale bars: 5 µm. (C) Heteroplasmy distributions from all 20 independent diploid populations after 24 h of growth on the YPD plate (N = 20 zygotes/n > 200 cells/colony). Each dot represents a single cell. Heteroplasmy values below 0.33 or above 0.71, the homoplasmy thresholds, represent cells harboring mainly mtDNAAtp6-NG or mtDNAAtp6-mKate2, respectively. As apparent from the graph, some cells for each population still exhibit a heteroplasmic state, which is evident from a h-value between 0.33 and 0.71.
Figure EV3
Figure EV3. Simulations of homoplasmy establishment in cell populations with increased mtDNA copy number.
(A) Heatmap showing the percentage of homoplasmic cells at timepoint t = 7.5 h, for different ndau and nspl pairs, for n = 56 mtDNA copies. The maximum value of ndau is defined by the half (n = 28) of the total mtDNA copies in the founder cell (n = 56). The arrow indicates the proportion (50%) of cells being virtually homoplasmic in the empirical data, based on the pre-established homoplasmy cutoffs. Each simulation with any given combination of the two parameters has been run ten times. (B) Heatmap showing the percentage of homoplasmic cells at timepoint t = 7.5 h, for different ndau and nspl pairs, for n = 90 mtDNA copies. The maximum value of ndau is defined by half (n = 45) of the total mtDNA copies in the founder cell (n = 90). The arrow indicates the proportion (50%) of cells being virtually homoplasmic in the empirical data, based on the pre-established homoplasmy cutoffs. Each simulation with any given combination of the two parameters has been run ten times. (C) Percentage of homoplasmic cells in simulated cell populations with n = 32 copies, relative to populations with n = 56 copies or n = 90 copies/cell. The number of copies transferred to the daughter cell (ndau) has been kept proportional to the total copy number in each of the simulations, that is 44\% of the total copies gets transferred to the daughter cell. The parameter nspl has been kept identical. (D) Percentage of homoplasmic cells in simulated cell populations with n = 32 copies, relative to populations with n = 56 copies or n = 90 copies/cell, with varying nspl values. The ndau parameter is proportional to the total copy number (44%), while the nspl parameter varies from low to high values per simulation. A comparison of these curves demonstrates the effect of lower or higher fission-fusion frequencies on the speed of segregation. The combination of ndau = 14 and nspl = 4 in cells with n = 32 copies is used as a point of reference, across all plots. (E) Percentage of homoplasmic cells in simulated cell populations with n = 32 copies, relative to populations with n = 56 copies or n = 90 copies/cell, with identical nspl values, and different levels of ndau. Comparison of these curves demonstrates the effect of lower or higher numbers of mtDNA copies being transferred to the daughter cells on the speed of segregation. The combination of ndau = 14 and nspl = 4 in cells with n = 32 copies is used as a point of reference, across all plots.
Figure EV4
Figure EV4. Number of mtDNA foci in mother-daughter pairs during a complete cell cycle.
(A) Diploid cells expressing mitochondrially targeted 3xNG-LacI and mKate2 were harvested at the log phase and imaged for 2 h. The number of mtDNA foci were counted in virgin mothers (M) and their emerging daughters (D) (n = 59 M-D pairs). The dashed line represents the average period of time (t = 47.5 min) that mitochondrial content was exchanged between mothers and daughters, as shown in Fig. 5D. (B) Example time-lapse images of a virgin mother and its emerging bud. All cells express mitochondrially targeted 3xNG-LacI, used for visualizing the LacO-mtDNA foci, and mitochondrially targeted mKate2 to visualize the mitochondrial network. Mother-daughter pairs were cropped manually prior to segmentation and analysis.
Figure EV5
Figure EV5. 24-hr heteroplasmy assessment in colonies with competing mtDNA qualities.
(A) Schematic of the 24 h heteroplasmy assessment experiment of matings between cells harboring intact or mutant mtDNA. Cells harboring intron-containing mtDNAAtp6-NG were mated with cells containing intronless mtDNAil-∆cob on a YPD plate. After a 2 h incubation, upon zygote formation, individual zygotes were micro-dissected and placed in different areas of a fresh YPD plate. Cells were kept for 24 h at 30 °C until colonies had formed. Cells from each colony, originating from a single zygote, were imaged to assess the percentage of cells with fluorescent (mtDNAAtp6-NG) or ‘dark’ (mtDNAil-∆cob) mitochondria. (B) Representative image of a small field-of-view from one population, after 24 h. Diploid cells harboring mtDNAAtp6-NG are exhibiting fluorescence, while ‘dark’ cells (indicated by a white outline) do not contain mtDNAAtp6-NG. Fluorescence images are maximum-intensity projections of z-stacks, after deconvolution. Scale bars: 5 µm.

Similar articles

Cited by

References

    1. Alber AB, Paquet ER, Biserni M, Naef F, Suter DM (2018) Single live cell monitoring of protein turnover reveals intercellular variability and cell-cycle dependence of degradation rates. Mol Cell 71:1079–1091.e9 - PubMed
    1. Aryaman J, Bowles C, Jones NS, Johnston IG (2019) Mitochondrial network state scales mtDNA genetic dynamics. Genetics 212:1429–1443 - PMC - PubMed
    1. Ashley MV, Laipis PJ, Hauswirth WW (1989) Rapid segregation of heteroplasmic bovine mitochondria. Nucleic Acids Res 17:7325–7331 - PMC - PubMed
    1. Birky CW (1994) Relaxed and stringent genomes: why cytoplasmic genes don’t obey Mendel’s laws. J Heredity 85:355–365
    1. Birky J (2001) The inheritance of genes in mitochondria and chloroplasts: laws, mechanisms, and models. Annu Rev Genet 35:125–148 - PubMed

MeSH terms

Substances

LinkOut - more resources