. 2024 Sep;43(18):3968-3999.
doi: 10.1038/s44318-024-00192-4. Epub 2024 Aug 5.

PQBP3 prevents senescence by suppressing PSME3-mediated proteasomal Lamin B1 degradation

Affiliations

PQBP3 prevents senescence by suppressing PSME3-mediated proteasomal Lamin B1 degradation

Yuki Yoshioka et al. EMBO J. 2024 Sep.

Abstract

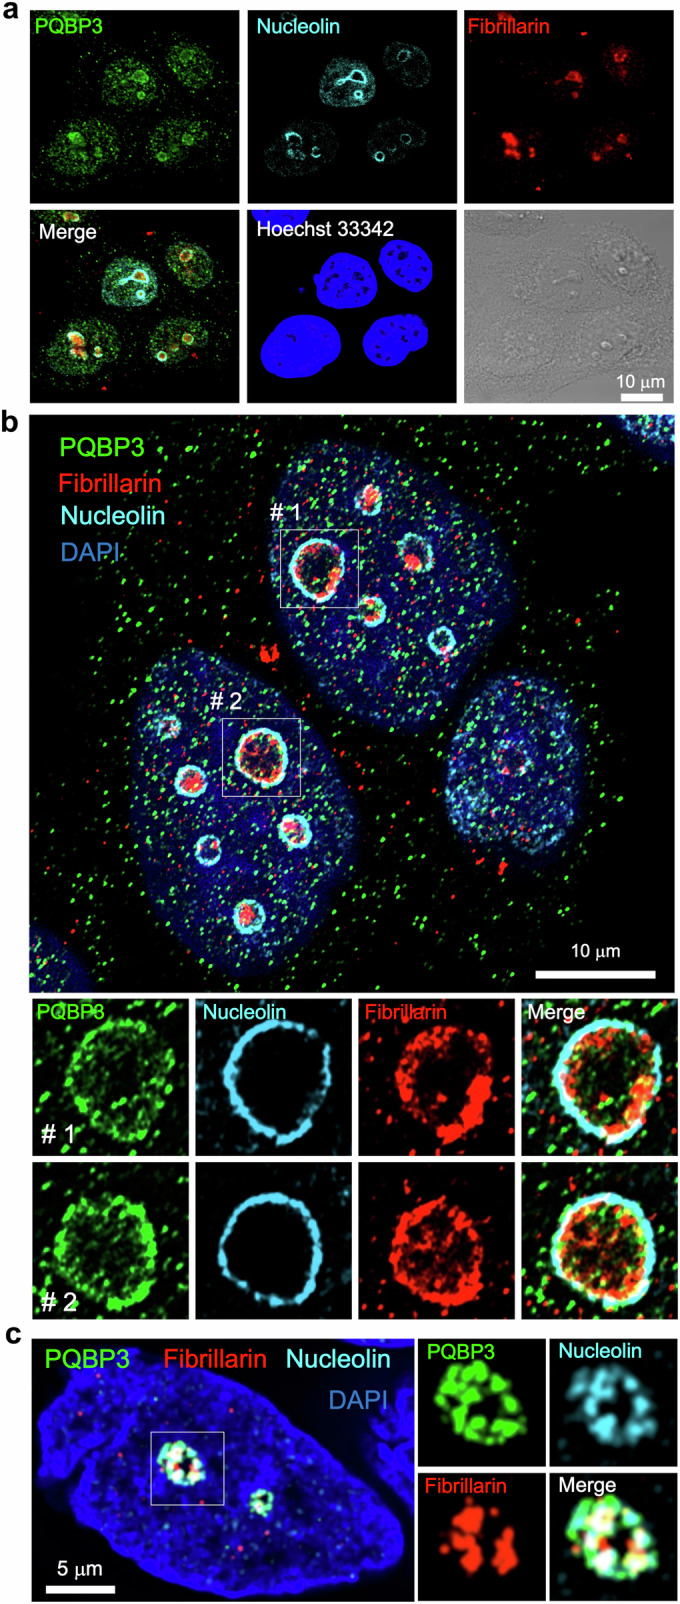
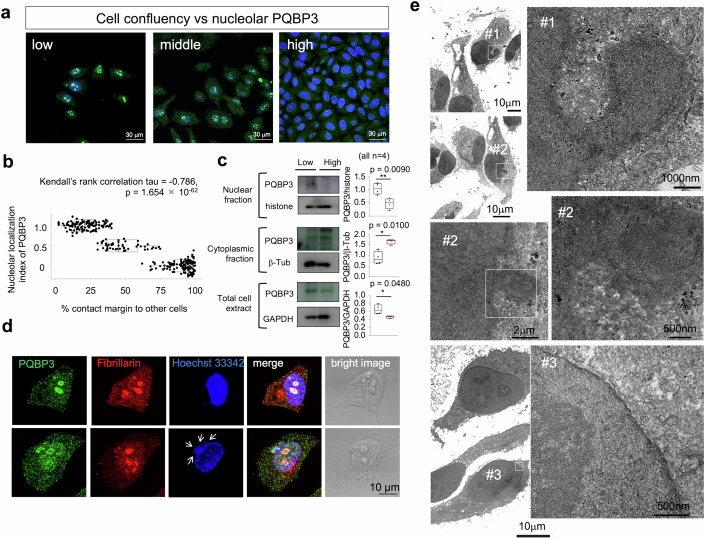
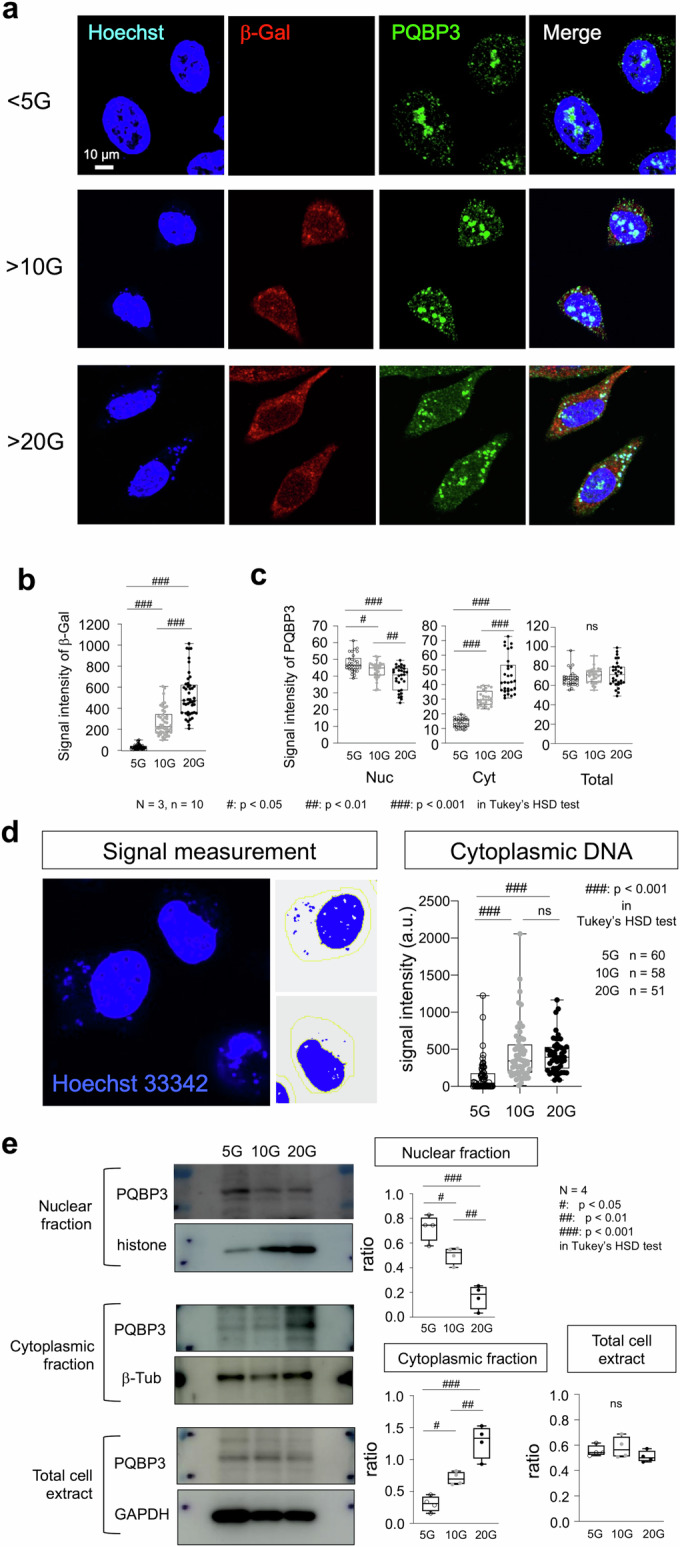
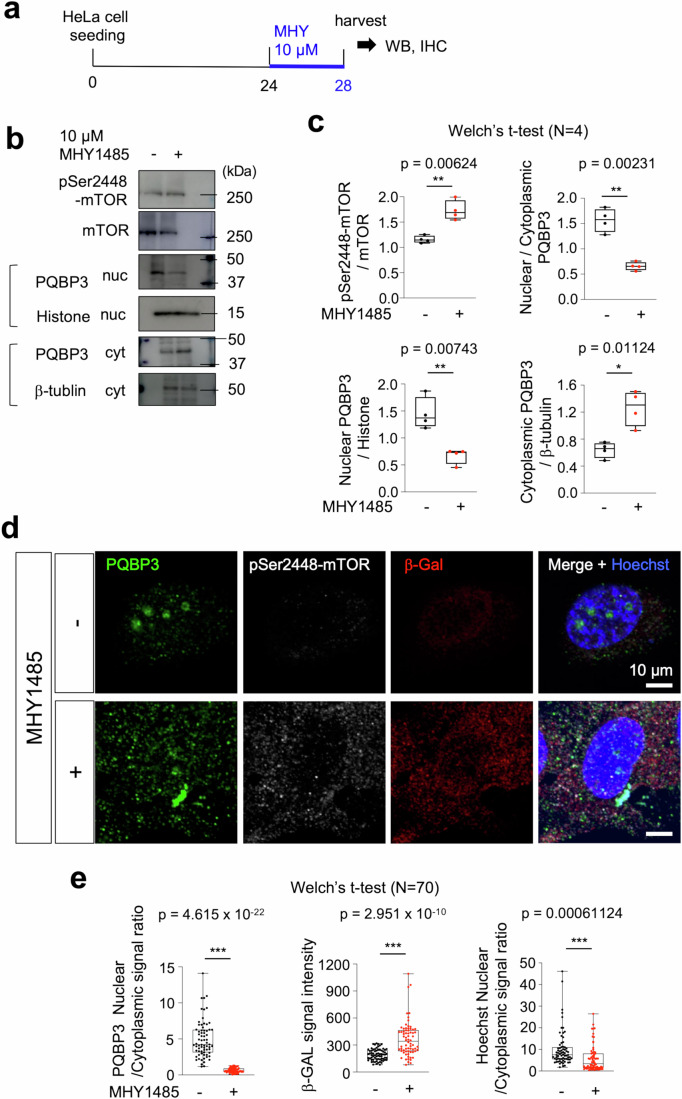
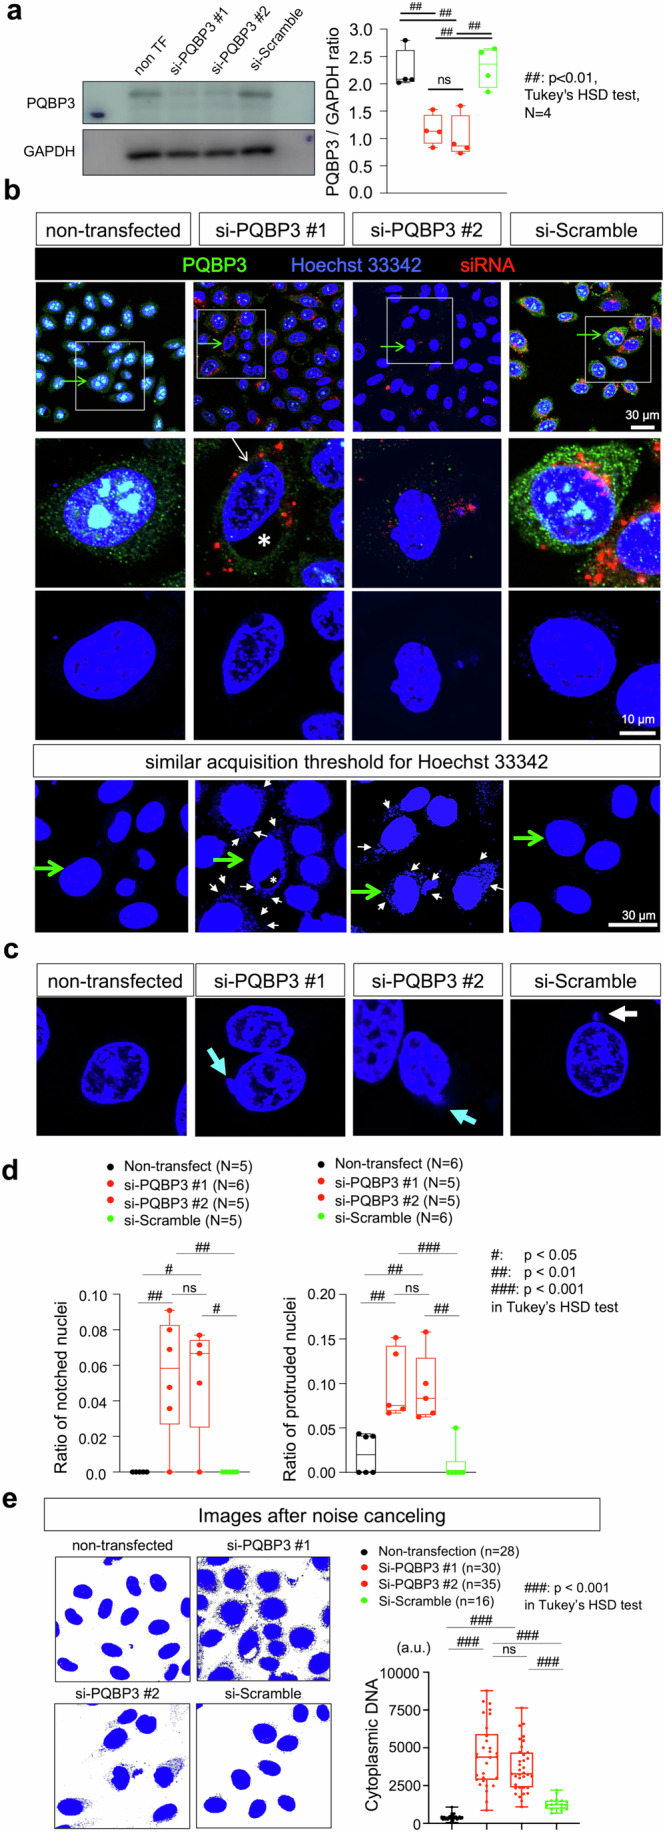
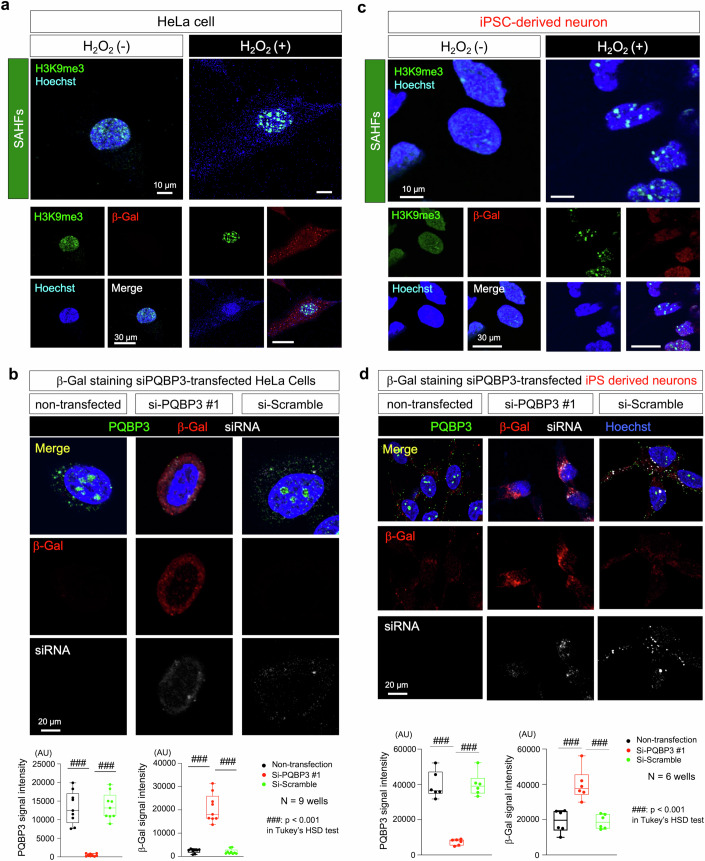
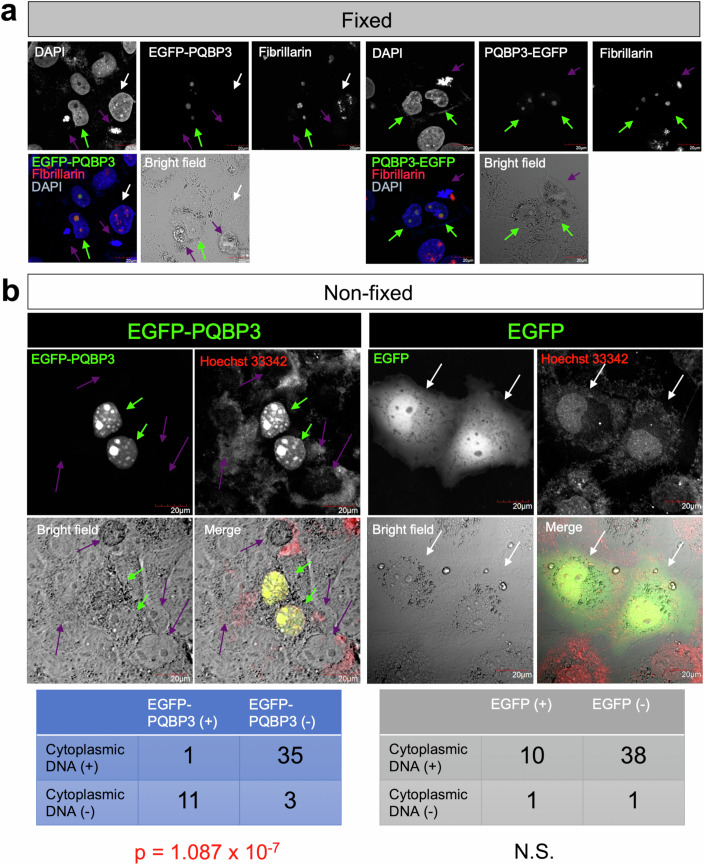
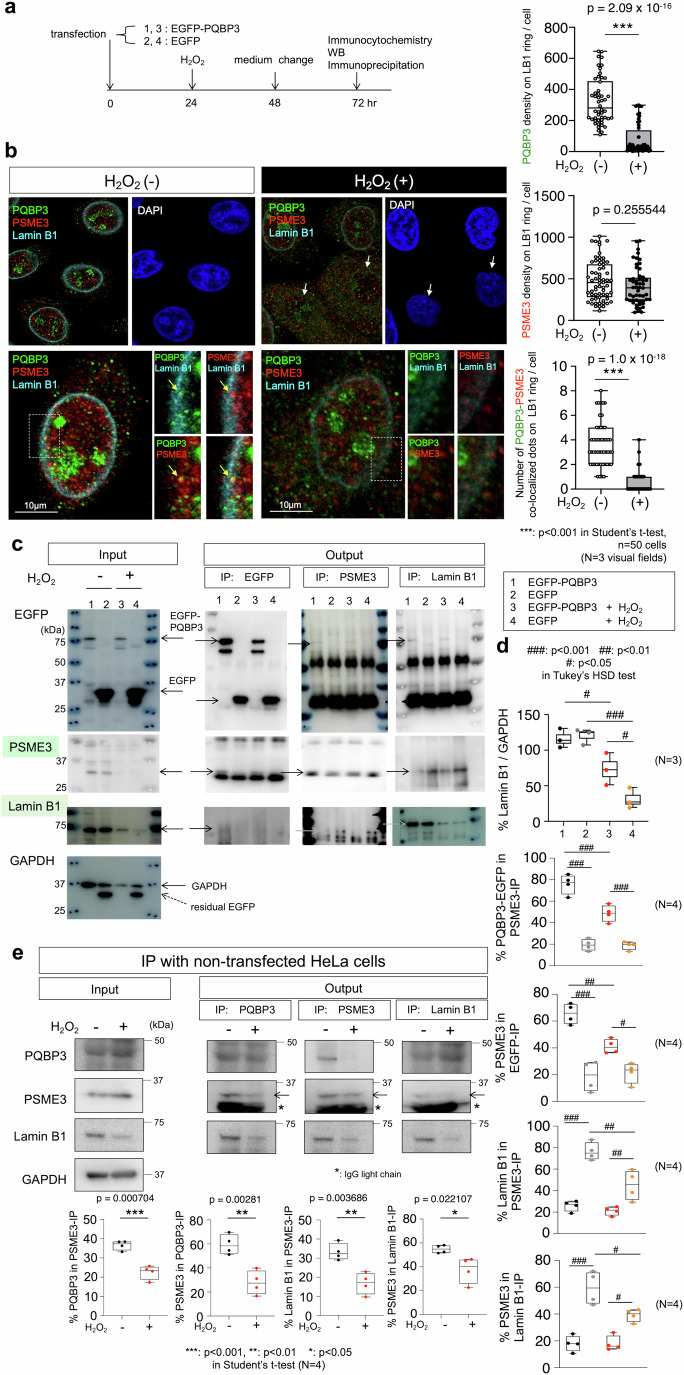
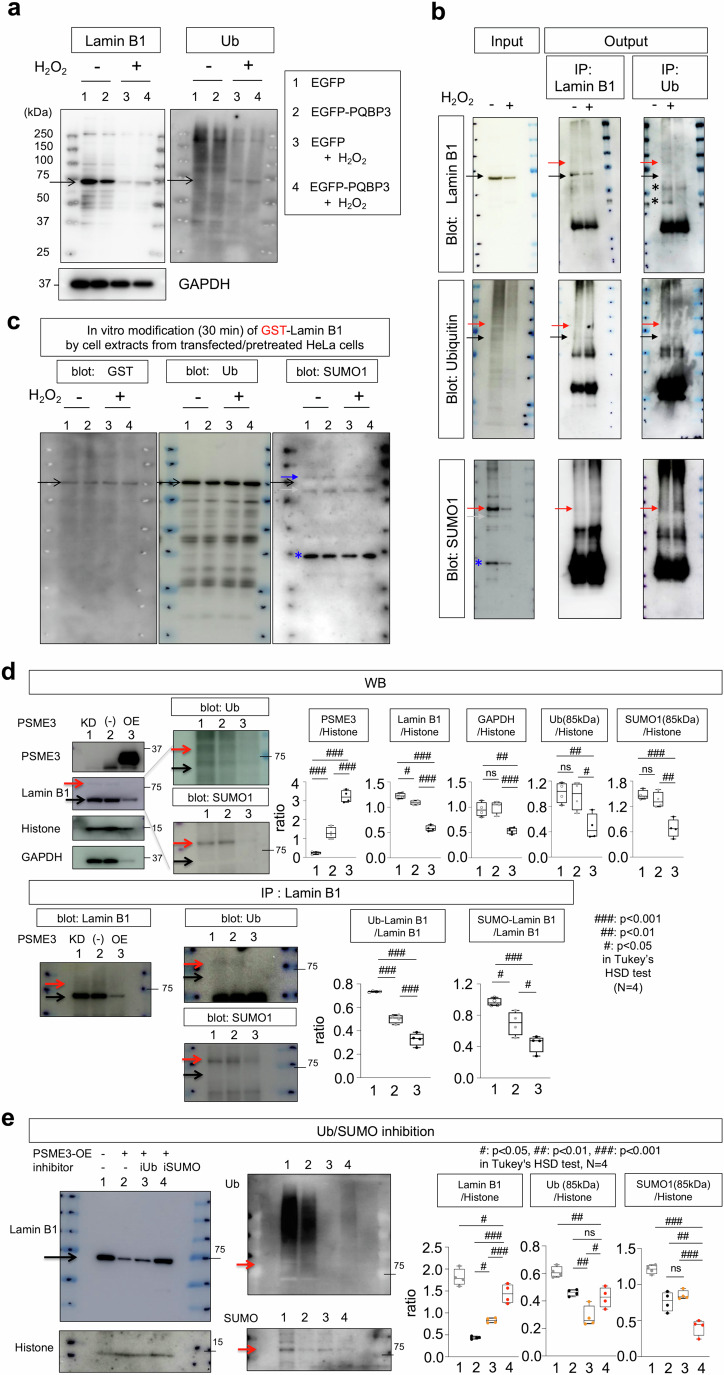
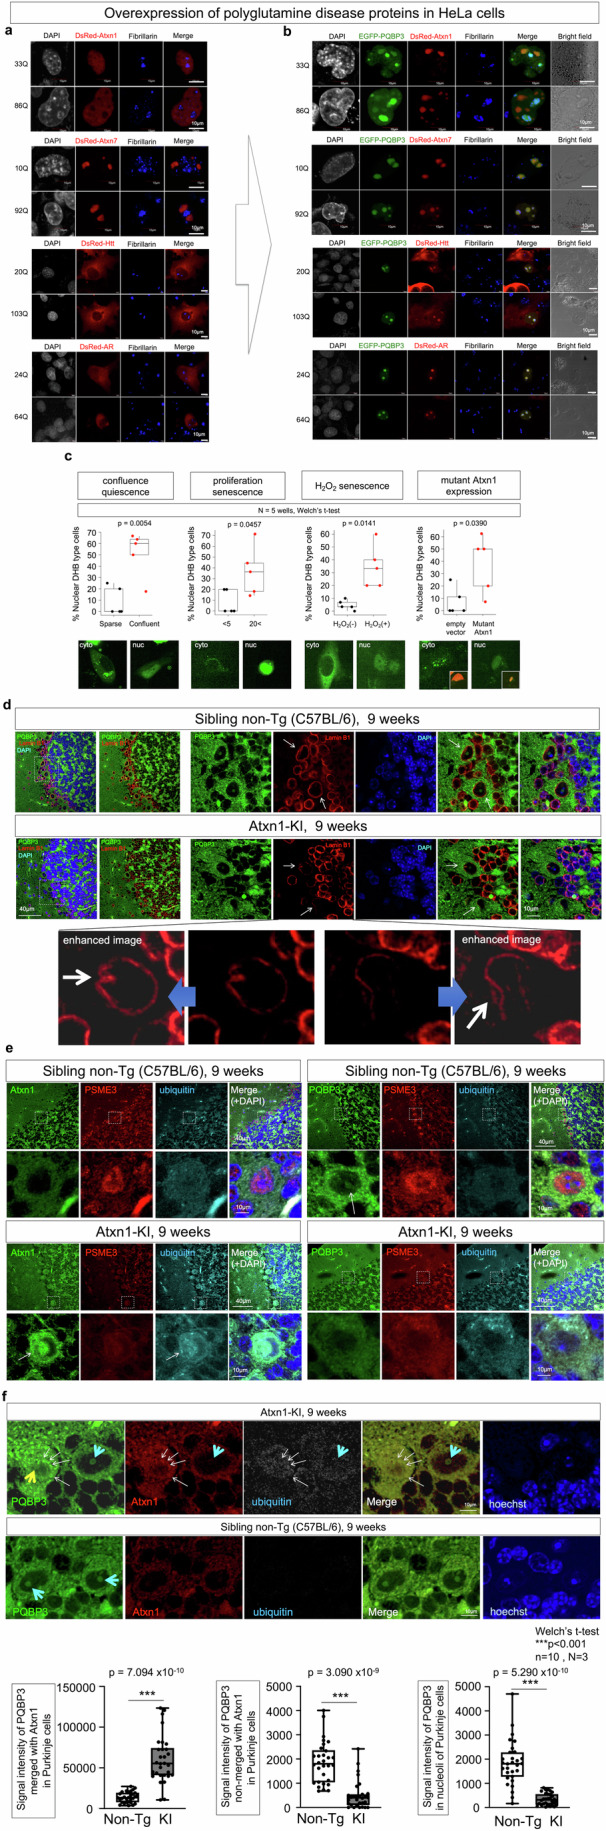
Senescence of nondividing neurons remains an immature concept, with especially the regulatory molecular mechanisms of senescence-like phenotypes and the role of proteins associated with neurodegenerative diseases in triggering neuronal senescence remaining poorly explored. In this study, we reveal that the nucleolar polyglutamine binding protein 3 (PQBP3; also termed NOL7), which has been linked to polyQ neurodegenerative diseases, regulates senescence as a gatekeeper of cytoplasmic DNA leakage. PQBP3 directly binds PSME3 (proteasome activator complex subunit 3), a subunit of the 11S proteasome regulator complex, decreasing PSME3 interaction with Lamin B1 and thereby preventing Lamin B1 degradation and senescence. Depletion of endogenous PQBP3 causes nuclear membrane instability and release of genomic DNA from the nucleus to the cytosol. Among multiple tested polyQ proteins, ataxin-1 (ATXN1) partially sequesters PQBP3 to inclusion bodies, reducing nucleolar PQBP3 levels. Consistently, knock-in mice expressing mutant Atxn1 exhibit decreased nuclear PQBP3 and a senescence phenotype in Purkinje cells of the cerebellum. Collectively, these results suggest homologous roles of the nucleolar protein PQBP3 in cellular senescence and neurodegeneration.

Keywords: Lamin B1; Neurodegeneration; Nuclear Membrane Instability; PQBP3; Senescence.


Conflict of interest statement

The authors declare no competing interests.

Figures

Figure 1
Figure 1. PQBP3/NOL7 is a nucleolar protein located predominantly in the outer nucleolar shell.
(A) Confocal microscopic analysis of unfixed HeLa cells penetrated by Tween20 and immunostained with anti-PQBP1, antifibrillarin, and antinucleolin antibodies. Nuclei were costained with Hoechst 33342. The signals of PQBP3/NOL7 were distributed in the peripheries of nucleoli. In addition, smaller speckles were observed in the nucleoplasm and cytoplasm. (B) Super-resolution microscopy images of HeLa cells after fixation. The distribution pattern was similar to that observed by standard confocal microscopy. The speckle diameters were ~260 nm in the nucleoplasm and ~300 nm in the cytoplasm. Staining localized to the outer shell of the nucleolus resembled a chain or cluster of similarly sized speckles. (C) Super-resolution microscopy images of normal iPSC-derived neurons after fixation. The relationship of PQBP3/NOL7, nucleolin, and fibrillarin was similar to that in HeLa cells. Source data are available online for this figure.
Figure 2
Figure 2. Nucleolar PQBP3/NOL7 is decreased in quiescence induced by cell-cell contact inhibition.
(A) PQBP3/NOL7 immunocytochemistry of HeLa cells at various cell densities. High signal intensities of PQBP3/NOL7 were observed in cells at low cell densities, while the signals were dispersed into the cytosol in cells at medium densities and eliminated in confluent cells (high density). (B) Relationship between percent cell margin in contact with neighboring cells and nucleolar distribution of PQBP3/NOL7. Localization of PQBP3/NOL7 was semiquantitated into three stages weighed by different values (1: robust nucleolar PQBP3/NOL7, 0.5: modest nucleolar PQBP3/NOL7, 0: no nucleolar PQBP3/NOL7). A Kendall’s rank correlation test revealed a negative relationship between % cell contact margin and PQBP3/NOL7 nucleolar distribution (tau = −0.786, p = 1.654 × 10−62). (C) Western blot of PQBP3/NOL7 with nuclear fraction, cytoplasmic fraction and total cell extract of HeLa cells cultured at low and high cell densities. Box plots show the median and 25–75th percentile, and whiskers represent data outside the 25–75th percentile range. (D) Representative images of cells in the stages of “robust nucleolar PQBP3/NOL7” (upper panels) and “faint nucleolar PQBP3/NOL7” (lower panels). In cells classified as “faint nucleolar PQBP3/NOL7,” nuclear PQBP3 signals became obscure, though fibrillarin signals of nucleoli were robust, and abnormal protrusion of nuclear margin and extranuclear DNA stains were observed in Hoechst 33342 labeling (white arrows). (E) Electron microscopy of HeLa cells with faint nucleolar PQBP3/NOL7 (#1, #2) and robust nucleolar PQBP3/NOL7 (#3). Nuclear membrane of #1 and #2 cells became obscure and their protrusion contains chromatin. Nucleoli of #1 and #2 cells did not show normal substructures. The continuity of the protrusion and the nucleus excluded that such protrusions were micronuclei. Cells with robust nucleolar PQBP3/NOL7 (#3) showed normal structures of nucleoli and nuclear membrane. Experiments in this figure were technically replicated until the necessary N was acquired. Source data are available online for this figure.
Figure 3
Figure 3. Nucleolar PQBP3/NOL7 is decreased and shifted to cytoplasm in senescence.
(A) PQBP3/NOL7 immunocytochemistry of HeLa cells at less than 5 passages (<5G), more than 10 passages (>10G), and more than 20 passages (>20G). Signals were detected in β-Gal staining of >10G and >20G cells in which PQBP3/NOL7 was decreased in the nucleus and shifted to the cytoplasm. (B) Signal intensities of β-Gal were quantified in HeLa cells (30 cells from 3 wells) and compared among three groups. Statistical significance was found in comparison of <5G and >10G (###: p < 0.0001), <5G and >20G (###: p < 0.0001), and >10G and >20G (###: p < 0.0001). (C) Signal intensities of PQBP3/NOL7 in nucleus, cytoplasm, or total cell were quantified and compared among three groups (30 cells from 3 wells). (Nuc) Statistical significance was found in comparison of <5G and >10G (#: p = 0.027), <5G and >20G (###: p < 0.0001), and >10G and >20G (##: p = 0.0051). (Cyt) Statistical significance was found in comparison of <5G and >10G (###: p < 0.0001), <5G and >20G (###: p < 0.0001), and >10G and >20G (###: p < 0.0001). (D) Schematic presentation of the method to quantify the extranuclear DNA signals stained by Hoechst 33342 (left panel). The signal intensities were compared among three groups (right graph). Statistical significance was found in comparison of <5G and >10G (###: p < 0.0001), and <5G and >20G (###: p < 0.0001). (E) Western blot analyses of nuclear, cytoplasmic, and total PQBP3/NOL7 in 5G, >10G, and >20G HeLa cells (left panels). Statistical comparisons of band intensities among the three groups (right graphs). (Nuclear fraction) Statistical significance was found in comparison of <5G and >10G (#: p = 0.0189), <5G and >20G (###: p < 0.0001), and >10G and >20G (##: p = 0.0015). (Cytoplasmic fraction) Statistical significance was found in comparison of <5G and >10G (#: p = 0.025), <5G and >20G (###: p < 0.0001), and >10G and >20G (##: p = 0.003). Experiments in this figure were technically replicated until the necessary N was acquired. Box plots show the median and 25–75th percentile, and whiskers represent data outside the 25–75th percentile range. Source data are available online for this figure.
Figure 4
Figure 4. MTOR contributes to cytoplasmic shift of PQBP3/NOL7.
(A) protocol of mTOR signal activation in HeLa cell culture (<5G). MHY1485, an activator of mTOR (final concentration in the medium: 10 μM) was added to the culture medium 48 h after cell seeding and cells were harvested after another 4 h. (B) Western blot analysis of nuclear and cytoplasmic PQBP3/NOL7 under mTOR activation. (C) Quantitative analyses of band intensities of western blots. Statistical analyses (Welch’s t-test) revealed decrease of nuclear PQBP3/NOL7, increase of cytoplasmic PQBP3/NOL7, and shift of PQBP3/NOL7 from nucleus to cytoplasm. (D) Immunocytochemistry of HeLa cells treated with MHY1485. Cytoplasmic shift of PQBP3/NOL7 and faint signals of β-GAL were detected in HeLa cells treated with MHY1485. (E) Quantitative analyses of cytoplasmic shift of PQBP3 (PQBP3 nuclear/cytoplasmic signal ratio), senescence (β-GAL signal intensity), and cytoplasmic shift of nuclear DNA (Hoechst nuclear/cytoplasmic signal ratio) in HeLa cells by mTOR activation with MHY1485. Experiments in this figure were technically replicated until the necessary N was acquired. Box plots show the median and 25–75th percentile, and whiskers represent data outside the 25–75th percentile range. Source data are available online for this figure.
Figure 5
Figure 5. siRNA PQBP3/NOL7 knockdown induces nuclear morphological abnormalities.
(A) Western blot analysis of PQBP3/NOL7 in total extracts of HeLa cells transfected with two types of PQBP3-siRNA or scrambled-siRNA. Statistical significance was found in comparison of non TF and si-PQBP3#1 (##: p = 0.0048), non TF and si-PQBP3#2 (##: p = 0.0019), si-PQBP3#1 and si-Scramble (##: p = 0.0033), and si-PQBP3 and si-Scramble (##: p = 0.0013). (B) Upper panels show three signals of immunostained PQBP3, Hoechst 33342, and fluorescence-labeled siRNA. Almost all cells were transfected with PQBP3 siRNA (#1, #2), and PQBP3 signals were accordingly reduced. Representative cells from nontransfected, PQBP3 siRNA-transfected (#1, #2), and Scrambled siRNA-transfected cells (green arrow in upper panels) are shown in middle panels. The PQBP3 siRNA-transfected cell exhibited a notched nucleus (white arrow) in which an additional large bleb (asterisk) was formed. When Hoechst 33342 signals were acquired at the same signal intensity threshold, cytoplasmic genomic DNA was present in the PQBP3 siRNA-transfected cell but not in the nontransfected or Scrambled siRNA-transfected cells. (C) Representative Hoechst 33342 images show a normal nucleus in a nontransfected cell (left panel) and an abnormal nucleus with a protrusion (light blue arrows) in a PQBP3-siRNA-transfected cell (middle panel), and a micronucleus (white arrow) that was detected in only a single cell among Scrambled-siRNA-transfected cells (right panel). (D) Quantitative analyses of frequency of cells with notched nuclei (left graph) and frequency of cells with micronuclei (right graph) from 5 to 6 randomly visual fields from independent wells containing 15–50 cells. (left) Statistical significance was found in comparison of non-transfect and si-PQBP3#1 (##: p = 0.0075), non-transfect and si-PQBP3#2 (#: p = 0.0119), si-PQBP3#1 and si-Scramble (##: p = 0.0075), and si-PQBP3#2 and si-Scramble (#: p = 0.0119). (right) Statistical significance was found in comparison of non-transfect and si-PQBP3#1 (##: p = 0.0025), non-transfect and si-PQBP3#2 (#: p = 0.0047), si-PQBP3#1 and si-Scramble (###: p = 0.0006), and si-PQBP3#2 and si-Scramble (##: p = 0.0011). (E) Quantitative analysis of cytoplasmic DNA signal intensity per cell in nontransfected, PQBP3 siRNA-transfected, and Scrambled siRNA-transfected cells. The original images were corrected by canceling noise signals, and signals outside of the nucleus were measured (see Methods). Cell numbers are shown in the figure, and images were captured from three wells. Statistical significance was found in comparison of non-transfect and si-PQBP3#1 (###: p = 0.0075), non-transfect and si-PQBP3#2 (#: p = 0.0119), si-PQBP3#1 and si-Scramble (##: p = 0.0075), and si-PQBP3#2 and si-Scramble (#: p = 0.0119). Experiments in this figure were technically replicated until the necessary N was acquired. Box plots show the median and 25–75th percentile, and whiskers represent data outside the 25–75th percentile range. Source data are available online for this figure.
Figure 6
Figure 6. PQBP3/NOL7 knockdown induces senescence.
(A) SAHFs was analyzed in HeLa cells treated with hydrogen peroxide. Nuclear speckles reactive to anti-H3K9me3 antibody indicating SAHFs was observed. Such cells with SAHFs were reactive to β-Gal staining. (B) Positive stains for β-Gal were observed in PQBP3-siRNA-transfected but not Scrambled-siRNA-transfected HeLa cell. (PQBP3) Statistical significance was found in comparison of non-transfection and si-PQBP3#1 (###: p < 0.0001), and si-PQBP3#1 and si-Scramble (###: p < 0.0001). (β-Gal) Statistical significance was found in comparison of non-transfection and si-PQBP3#1 (###: p < 0.0001), and si-PQBP3#1 and si-Scramble (###: p < 0.0001). (C) SAHFs was analyzed in human normal iPSC-derived neurons treated with hydrogen peroxide. Nuclear speckles reactive to anti-H3K9me3 antibody was observed similarly to HeLa cells treated with hydrogen peroxide. Such human iPSC-derived neurons with SAHFs were reactive to β-Gal staining. (D) Positive stains for β-Gal were observed in human normal iPSC-derived neurons that were transfected PQBP3-siRNA but not by Scrambled-siRNA-transfected. (PQBP3) Statistical significance was found in comparison of non-transfection and si-PQBP3#1 (###: p < 0.0001), and si-PQBP3#1 and si-Scramble (###: p < 0.0001). (β-Gal) Statistical significance was found in comparison of non-transfection and si-PQBP3#1 (###: p < 0.0001), and si-PQBP3#1 and si-Scramble (###: p < 0.0001). Experiments in this figure were technically replicated until the necessary N was acquired. Box plots show the median and 25–75th percentile, and whiskers represent data outside the 25–75th percentile range. Source data are available online for this figure.
Figure 7
Figure 7. PQBP3/NOL7 overexpression suppresses cytoplasmic genomic DNA.
(A) Senescent HeLa cells were fixed with 10% formaldehyde and stained with antifibrillarin and DAPI. Signals of EGFP-PQBP3 fusion proteins were directly detected. Most of the nontransfected cells contained cytoplasmic genomic DNA, as revealed by DAPI (purple arrows), while a small part of nontransfected cells showed normal morphology (white arrows). Transfected cells did not contain cytoplasmic genomic DNA (green arrows). (B) Nonfixed HeLa cells were directly observed to evaluate the effect of EGFP-PQBP3 or EGFP expression on cytoplasmic genomic DNA. In the left panels, nontransfected cells (purple arrows) but not EGFP-PQBP3-expressing cells (green arrows) contained cytoplasmic genomic DNA. In the right panels, cytoplasmic DNA was not affected in EGFP-expressing cells (white arrows) in comparison to neighboring nontransfected cells. Lower tables show quantitative analysis of 50 cells from 5 wells, each transfected with pEGFP-C1-PQBP3 or pEGFP-C1 plasmid. A strong negative correlation between EGFP-PQBP3 expression and cytoplasmic genomic DNA was statistically confirmed by Fisher’s exact test (p = 1.087 × 10⁻⁷, n = 5 wells, n = 50 cells), while no relationship was detected between EGFP expression and cytoplasmic genomic DNA. Experiments in this figure were technically replicated until the necessary N was acquired. Source data are available online for this figure.
Figure 8
Figure 8. The tripartite complex of PQBP3/NOL7 and PSME3 stabilizes Lamin B1.
(A) Protocol for transfection of EGFP-PQBP3 or EGFP expression plasmids and induction of senescence in HeLa cells with hydrogen peroxide (H2O2). (B) Immunocytochemistry of PQBP3, PSME3, and Lamin B1 in HeLa cells with or without treatment. Upper image panels show HeLa cells with or without H2O2 treatment. A portion of H2O2-treated cells (white arrows) lost the Lamin B1 ring at the nuclear membrane, and PQBP3 and PSME3 were dispersed to the cytosol in these cells. The right graphs show signal densities of PQBP3 or PSME3 on the Lamin B1 ring (upper and middle graphs) and numbers of PQBP3-PSME3 colocalized dots on the Lamin B1 ring (lower graph). The signal intensities of PQBP3 and PSME3 on the Lamin B1-positive area were measured by ImageJ. (C) Immunoprecipitation analysis of the interactions between PQBP3, PSME3, and Lamin B1. Left panels and right panels show input and output, respectively, of immunoprecipitations. Input panels show decreased PSME3 and Lamin B1, after H2O2 treatment. Output panels show suppressed interactions between Lamin B1 and PSME3 by EGFP-PQBP3 in coprecipitation. Black and gray arrows indicate each proteins. (D) Qunatitative analyses of Lamin B1 protein levels normalized to GAPDH. (Lamin B1/GAPDH) Statistical significance was found in comparison of (1) and (3) (#: p = 0.0452), (2) and (4) (###: p = 0.0006), and (3) and (4) (#: p = 0.0494). (PQBP3-EGFP) Statistical significance was found in comparison of (1) and (2) (###: p < 0.0001), (1) and (3) (###: p = 0.0005), and (3) and (4) (###: p = 0.0002). (PSME3 in EGFP-IP) Statistical significance was found in comparison of (1) and (2) (###: p < 0.0001), (1) and (3) (#: p = 0.006), and (3) and (4) (#: p = 00252). (Lamin B1 in PSME3-IP) Statistical significance was found in comparison of (1) and (2) (###: p < 0.0001), (2) and (4) (##: p = 0.0012), and (3) and (4) (##: p = 0.0093). (PSME3 in Lamin B1-IP) Statistical significance was found in comparison of (1) and (2) (###: p < 0.0001), (2) and (4) (#: p = 0.0138), and (3) and (4) (#: p = 0.0111). (E) Immunoprecipitation analysis of the interactions between PQBP3, PSME3, and Lamin B1 was performed by these proteins endogenously expressed in HeLa cells. Experiments in this figure were technically replicated until the necessary N was acquired. Box plots show the median and 25–75th percentile, and whiskers represent data outside the 25–75th percentile range. Source data are available online for this figure.
Figure 9
Figure 9. Lamin B1 is ubiquitinated and degraded by PSME3.
(A) Sequential reprobing of the same filter with anti-Ubiquitin antibody and anti-Lamin B1 antibody revealed existence of ubiquitinated Lamin B1 (black arrow), which was increased in HeLa cells treated with hydrogen peroxide despite of the decrease of total Lamin B1. (B) Immunoprecipitation and detection of Lamin B1 by anti-Ubiquitin, anti-SUMO1, and anti-Lamin B1 antibodies to confirm existence of ubiquitinated and SUMOylated Lamin B1. The band detected in (A)) was confirmed by immunoprecipitation as mono-ubiquitinated Lamin B1 (black arrow). In addition, some higher bands were shown as ubiquitinated Lamin B1 in HeLa cells treated with hydrogen peroxide (red arrow). Similarly, SUMOylated Lamin B1 were confirmed. The bands of ubiquitinated Lamin B1 were also reactive to SUMO1 (red arrow), indicating that two modifications occurred simultaneously on Lamin B1. (C) Protein modifications were examined in GST-Lamin B1 and cell lysates from HeLa cells with or without H2O2 treatment expressing EGFP-PQBP3 or EGFP by transient transfection. Considering the molecular weight 26 kDa of GST, the band indicated with balck arrow corresponds to the band in (A), and it is mono-Ubiquitinated Lamin B1. The band size of blue arrow in SUMO1 blot is consistent with SUMOylated and Ubiquitinated GST-Lamin B1, and corresponds to SUMOylated and Ubiquitinated Lamin B1 detected in immunoprecipitation ((B), red arrow). Light gray arrow-indicated band in (B) corresponds to that in ((C)). (D) PSME3 knockdown by PSME3-siRNA (KD) and PSME3 overexpression by pCMV3-Myc-PSME3 revealed a reverse relationship between PSME3 and Lamin B1. Ubiquitinated and/or SUMOylated LaminB1 was examined by western blot (upper panels) or immunoprecipitation (lower panels). Red and black arrows indicate modified and non-modified Lamin B1 as described above. Right graphs show quantitative analyses of red arrow band intensities in Ub and SUMO blots subtracted by backgrounds and corrected by Lamin B1. (PSME3) Statistical significance was found in comparison of (1) and (2) (###: p = 0.0007), (1) and (3) (###: p < 0.0001), and (2) and (3) (###: p < 0.0001). (Lamin B1) Statistical significance was found in comparison of (1) and (2) (#: p = 0.0141), (1) and (3) (###: p < 0.0001), and (2) and (3) (###: p < 0.0001) (GAPDH) Statistical significance was found in comparison of (1) and (3) (##: p = 0.0014), and (2) and (3) (###: p = 0.0006). (Ub(85kDa)) Statistical significance was found in comparison of (1) and (3) (##: p = 0.009), and (2) and (3) (#: p = 0.0157). (SUMO1(85kDa)) Statistical significance was found in comparison of (1) and (3) (###: p = 0.0004), and (2) and (3) (##: p = 0.0012). (Ub-Lamin B1) Statistical significance was found in comparison of (1) and (2) (###: p < 0.0001), (1) and (3) (###: p < 0.0001), and (2) and (3) (###: p = 0.0003). (SUMO-Lamin B1) Statistical significance was found in comparison of (1) and (2) (#: p = 0.0182), (1) and (3) (###: p = 0.0002), and (2) and (3) (#: p = 0.0238). (E) Inhibitors of ubiquitination (0.1 μM TAK-243) or SUMOylation (10 μM 2-D08) was added to the culture medium of HeLa cells, and the cells were transfected by pCMV3-Myc-PSME3 6 h later. Inhibition of SUMOylation suppressed Lamin B1 decrease by PSME3-OE (black arrow), and the suppressive effect was smaller in inhibition of ubiquitination. Right panels confirm the effects of TAK-243 and 2-D08, respectively, on ubiquitination and SUMOylation, in which the Lamin B1 band reactive to both anti-Ubiquitin and anti-SUMO1 antibodies in Fig. 9B is indicated (red arrows). (Lamin B1) Statistical significance was found in comparison of (1) and (4) (#: p = 0.0178), (2) and (3) (#: p = 0.0126), (2) and (4) (###: p < 0.0001), and (3) and (4) (###: p = 0.0004). (Ub) Statistical significance was found in comparison of (1) and (4) (##: p = 0.003), (2) and (3) (##: p = 0.0047), and (3) and (4) (#: p = 0.0204). (SUMO1) Statistical significance was found in comparison of (1) and (4) (###: p = 0.0002), (2) and (4) (##: p = 0.0012), and (3) and (4) (###: p = 0.0002). Experiments in this figure were technically replicated until the necessary N was acquired. Box plots show the median and 25–75th percentile, and whiskers represent data outside the 25–75th percentile range. Source data are available online for this figure.
Figure 10
Figure 10. PQBP3/NOL7 in cell and animal models of polyQ diseases.
(A) Colocalization of PQBP3/NOL7 and polyQ disease proteins in cell models. Left panels show single expression of a polyQ disease protein fused to DsRed (DsRed-Atxn1, DsRed-Atxn7, DsRed-Htt, and DsRed-AR) containing a normal or mutant length of polyQ sequence. A small portion of DsRed-Atxn1 formed nuclear speckles in both normal and mutant polyQ lengths, while most of DsRed-Atxn1 exhibited relatively homogeneous nucleoplasm distribution. DsRed-Atxn7 was dominantly distributed in nucleoli. In most cells, DsRed-Htt was predominantly distributed around the nucleus in the cytoplasm, while a part of mutant DsRed-Htt formed cytoplasmic inclusion bodies, as we reported previously (Tagawa et al, 2004). DsRed-AR, in the absence of androgen treatment, was distributed in the cytoplasm. (B) Expression of EGFP-PQBP3 changes the cellular distribution of polyQ disease proteins. EGFP-PQBP3 colocalized with Atxn1 on the nucleoli, while a portion of EGFP-PQBP3 formed nucleoli composed only of PQBP3. EGFP-PQBP3 colocalized with Atxn7 at fibrillarin-positive nucleleoli. EGFP-PQBP3 coexpression shifted localization of DsRed-Htt and DsRed-AR from the cytoplasm to the nucleoli. (C) Evaluation of senescence by DHB-mVenus in three types of induction, confluence quiescence, proliferation senescence, H2O2 senescence, and mutant Atxn1 expression. Representative nuclear and cytoplasmic images of DHB-mVenus and quantitative analysis of the percentage of senescence-phenotype cells, in which DHB-mVenus was distributed only in nucleus, among total pDHB-mVenus-transfected cells are shown. (D) Immunohistochemistry for PQBP3/NOL7 and Lamin B1 in cerebellar cortex of Atxn1-KI mice and littermate controls at 9 weeks of age. Nucleolar PQBP3/NOL7 signal was decreased in Purkinje cells of Atxn1-KI mice, and nuclear membrane Lamin B1 signal in Purkinje cells also decreased (white arrows). High-magnification original and enhanced images revealed notches and blebbing of nuclear membranes in Purkinje cells of Atxn1-KI mice (white arrow). On the other hand, Lamin B1 signals were unaltered in granule cells. (E) Immunohistochemistry for Atxn1/PSME3/Ubiquitin (left panels) and PQBP3/PSME3/Ubiquitin (right panels) in cerebellar cortexes prepared from Atxn1-KI mice and littermate controls at 9 weeks of age. In a portion of Purkinje cells of Atxn1-KI mice, Atxn1 formed nuclear inclusions with ubiquitin (white arrow), while nuclear PSME3 was decreased. PQBP3 was detected in Purkinje cell nuclei of control mice (white arrow) but decreased in Purkinje cell nuclei of Atxn1-KI mice. PSME3 was localized to the nucleus of Purkinje cells in control mice but dispersed to the cytoplasm in Atxn1-KI mice. These changes in expression and localization of PSME3, PQBP3, and Lamin B1 were homologous to those observed in H2O2-induced senescent HeLa cells (Fig. 8). (F) Immunohistochemistry for PQBP3/Atxn1/Ubiquitin (left panels) in cerebellar cortexes prepared from Atxn1-KI mice and littermate controls at 9 weeks of age. PQBP3 puncta located at the periphery of nucleus and/or in the cytoplasm (white thin arrows) were costained with Atxn1 and Ubiquitin antibodies in abnormal Purkinje cells (yellow thick arrow), while nucleolus of relatively normal Purkinje cells (light blue thick arrow) was also found in Atxn1-KI mice at 9 weeks. Lower graphs show quantitative analyses of signal intensity of PQBP3 merged with Atxn1 in Purkinje cells, signal intensity of PQBP3 non-merged with Atxn1 in Purkinje cells, and signal intensity of PQBP3 in nucleoli of Purkinje cells. Experiments in this figure were technically replicated until the necessary N was acquired. Box plots show the median and 25–75th percentile, and whiskers represent data outside the 25–75th percentile range. Source data are available online for this figure.
Figure EV1
Figure EV1. PQBP3/NOL7 puncti in the nucleoplasm and cytoplasm.
(A) Diameters of small speckles of PQBP3/NOL7 were quantified in images obtained by SRM. Box plots show the median and 25–75th percentile, and whiskers represent data outside the 25–75th percentile range. (B) PQBP3/NOL7 is decreased in the nucleus and overall at high cell densities. Representative images of PQBP3/NOL7 and Hoechst 33342 containing at four different cell densities. (C) Quantitative analyses of PQBP3/NOL7 signal intensities per cell (left) and per nucleus (right) are shown in graphs. Box plots show the median and 25–75th percentile, and whiskers represent 1.5x inter-quartile range. Source data are available online for this figure.
Figure EV2
Figure EV2. PQBP3/NOL7 in senescence.
(A) Confocal microscopy of HeLa cells after ten passages (10G), which were penetrated with Tween20, immunostained with anti-PQBP1, and costained with Hoechst 33342. Red arrows indicate cells with dispersed nucleolar PQBP3/NOL7 staining. (B) Confocal microscopy images of HeLa cells after 20 passages (20G) stained as described above. Red arrows indicate cells with dispersed nucleolar PQBP3/NOL7 staining, and chromatin distribution (Hoechst 33342-stained area) shifted and deviated in the nucleus. Purple arrows indicate cells in which chromatin was nearly absent. (C) Enlarged image of the area indicated by dotted lines in (B). (DF) Specific distributions of PQBP3/NOL7 during cell division. Foci of PQBP3/NOL7 localized to the centrosome (white arrow) were observed in addition to the diffuse cytoplasmic distribution. (G) Quantitative analyses of percentage of red arrow type or purple arrow type of cells in three different passage groups. Box plots show the median and 25–75th percentile, and whiskers represent data outside the 25–75th percentile range. In red arrow type of cells, statistical significance was found in comparison of <5G and >10G (#: p = 0.0415), <5G and >20G (###: p < 0.0001), and >10G and >20G (##: p = 0.0027). In purple arrow type of cells, statistical significance was found in comparison of <5G and >10G (##: p = 0.0082), <5G and >10G (###: p < 0.0001), and >10G and >20G (###: p = 0.0005). (HJ) Yellow arrows indicate cells exhibiting morphological changes of cell death, in which siPQBP3 signals (red) were absent or low, and PQBP3 signals (green) were relatively high. Contrastingly, siPQBP3-transfected cells with high red signals and low green signals did not exhibit such changes or apoptotic features (white arrows). Source data are available online for this figure.
Figure EV3
Figure EV3. Expression patterns of PQBP3/NOL7 fusion proteins.
HeLa cells were transfected with pEGFP-C1-PQBP3, pEGFP-N1-PQBP3, or pEGFP-N1 plasmids to express EGFP-PQBP3, PQBP3-EGFP, or EGFP proteins, and following Hoechst 33342 staining without fixation, EGFP signals in live cells were observed with confocal microscopy. Similar expression patterns were observed in EGFP-PQBP3 and PQBP3-EGFP fusion proteins. EGFP protein alone did not exhibit the nucleolar pattern of the PQBP3 fusion proteins. Some cell images are redisplayed from Fig. 7B. Source data are available online for this figure.
Figure EV4
Figure EV4. PSME3 as a candidate proteins interacting with PQBP3/NOL7.
(A) String (version 11.5) (https://string-db.org/) was used to predict interacting proteins with PQBP3/NOL7, and their descriptions in String are shown. (B) PSME3 protein structure predicted by alphafold. (C) PSME3 IDP prediction by IUPred2A.
Figure EV5
Figure EV5. Hypothesized mechanism for nuclear membrane instability mediated by PQBP3/NOL7 and PSME3.
Hypothesized mechanism of nuclear membrane instability under senescence, as suggested by the results of the present study. The upper panel illustrates the interaction and suppression relationships between PQBP3/NOL7, PSME3, Lamin B1, and mutant Atxn1. Under physiological conditions, PQBP3 complexes with PSME3 to suppress its protein degradation activity. In senescence, PQBP3 is decreased and not supplied sufficiently to the nuclear membrane for inhibition of PSME3-mediated proteasomal degradation of Lamin B1. In the case Lamin B1 is degraded, the nuclear membrane is instabilized, allowing release of genomic DNA from the nucleus to the cytosol.

Similar articles

References

    1. Ahmad Y, Boisvert F-M, Gregor P, Cobley A, Lamond AI (2009) NOPdb: nucleolar proteome database—2008 update. Nucleic Acids Res 37:D181–D184 10.1093/nar/gkn804 - DOI - PMC - PubMed
    1. Barclay SS, Tamura T, Ito H, Fujita K, Tagawa K, Shimamura T, Katsuta A, Shiwaku H, Sone M, Imoto S, Miyano S, Okazawa H (2014) Systems biology analysis of Drosophila in vivo screen data elucidates core networks for DNA damage repair in SCA1. Hum Mol Genet 23:1345–1364 10.1093/hmg/ddt524 - DOI - PubMed
    1. Bettencourt C, Hensman-Moss D, Flower M, Wiethoff S, Brice A, Goizet C, Stevanin G, Koutsis G, Karadima G, Panas M et al (2016) DNA repair pathways underlie a common genetic mechanism modulating onset in polyglutamine diseases. Ann Neurol 79:983–990 10.1002/ana.24656 - DOI - PMC - PubMed
    1. Biggiogera M, Bürki K, Kaufmann SH, Shaper JH, Gas N, Amalric F, Fakan S (1990) Nucleolar distribution of proteins B23 and nucleolin in mouse preimplantation embryos as visualized by immunoelectron microscopy. Development 110:1263–1270 10.1242/dev.110.4.1263 - DOI - PubMed
    1. Boisvert F-M, van Koningsbruggen S, Navascués J, Lamond AI (2007) The multifunctional nucleolus. Nat Rev Mol Cell Biol 8:574–585 10.1038/nrm2184 - DOI - PubMed

LinkOut - more resources