. 2024 Aug;26(8):1336-1345.
doi: 10.1038/s41556-024-01465-0. Epub 2024 Aug 5.

p16-dependent increase of PD-L1 stability regulates immunosurveillance of senescent cells

Affiliations

p16-dependent increase of PD-L1 stability regulates immunosurveillance of senescent cells

Julia Majewska et al. Nat Cell Biol. 2024 Aug.

Abstract

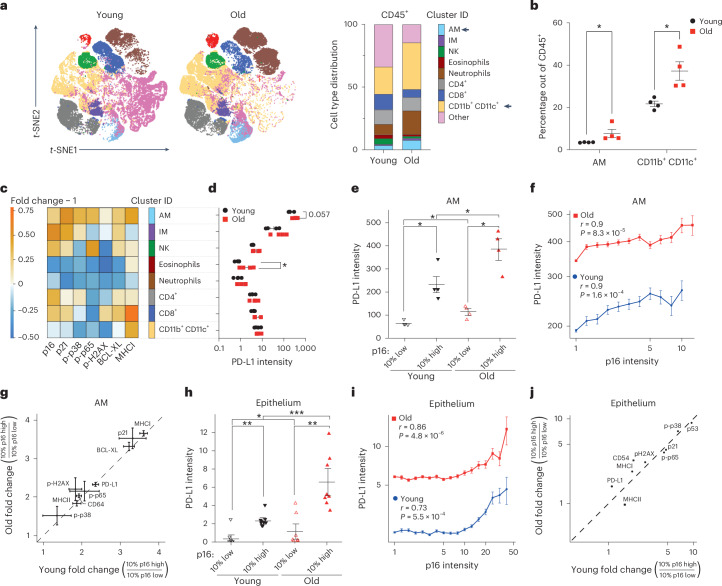
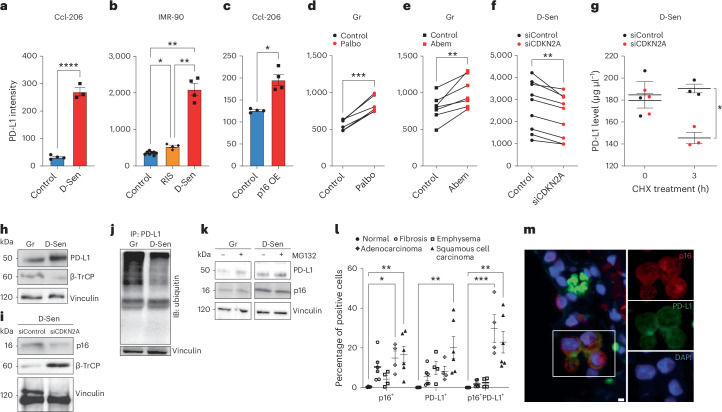
The accumulation of senescent cells promotes ageing and age-related diseases, but molecular mechanisms that senescent cells use to evade immune clearance and accumulate in tissues remain to be elucidated. Here we report that p16-positive senescent cells upregulate the immune checkpoint protein programmed death-ligand 1 (PD-L1) to accumulate in ageing and chronic inflammation. We show that p16-mediated inhibition of cell cycle kinases CDK4/6 induces PD-L1 stability in senescent cells via downregulation of its ubiquitin-dependent degradation. p16-expressing senescent alveolar macrophages elevate PD-L1 to promote an immunosuppressive environment that can contribute to an increased burden of senescent cells. Treatment with activating anti-PD-L1 antibodies engaging Fcγ receptors on effector cells leads to the elimination of PD-L1 and p16-positive cells. Our study uncovers a molecular mechanism of p16-dependent regulation of PD-L1 protein stability in senescent cells and reveals the potential of targeting PD-L1 to improve immunosurveillance of senescent cells and ameliorate senescence-associated inflammation.


Conflict of interest statement

J.M., A.A., A.M., U.A. and V.K. are co-inventors on provisional patent application related to the topic of this study. The other authors declare no competing interests.

Figures

Fig. 1
Fig. 1. PD-L1 upregulation correlates with p16 expression in ageing.
a, Representative t-SNE plots of immune cell (CD45+) populations identified in 50,000 cells from all lung samples of young and old mice (left) and their immune cell type distribution (right). Significantly changed populations are marked with an arrow (right). b, The frequency of indicated immune cell types in young and old mice. c, The heatmap of the change in the enrichment of senescence-related proteins in old/young mice for indicated immune cell types. d, Mean expression of PD-L1 in the identified immune cell populations. e, Mean expression of PD-L1 in 10% highest and 10% lowest p16-expressing cells within the AM population in young and old mice. f, Spearman correlation between p16 and PD-L1 protein expression in AMs in young and old mice. The AM cells were binned into 12 bins in old mice with a median of 740 cells per bin, and 11 bins in young mice with a median of 350 cells per bin. g, Scatter plot showing fold change in expression of senescence-related markers between p16 high and p16 low expressing cells in the AMs in the young (n = 4) and old (n = 4) mice. The diagonal line marks an equal fold change between young and old. h, Mean expression of PD-L1 between 10% highest and 10% lowest p16-expressing cells within lung epithelium in young and old mice. i, Spearman correlation between p16 and PD-L1 expression in the lung epithelium in young and old mice. The epithelium cells in young and old mice were binned into 18 bins with a median of 14,000 cells per bin. j, Scatter plot showing fold change in expression of senescence-related markers between p16 high and p16 low expressing cells in the epithelium in young (n = 8) and old (n = 8) mice. In f and i, Spearman correlation coefficient (r) and associated P value (P) were used for statistical analysis. Single cells were ranked by p16 expression level in bins from low to high. For each bin, the mean expression level of PD-L1 is shown. Two-sided (b and d) or one-sided (ej) Mann–Whitney U test was used for statistical analysis. Error bars, mean ± s.e.m. *P < 0.05, **P < 0.01, ***P < 0.001. Young (n = 4) and old (n = 4) mice were used in bg, and young (n = 8) and old (n = 8) mice were used in hj. Experiments were repeated three times independently with similar results. Source numerical data are available in Source data. Source data
Fig. 2
Fig. 2. PD-L1 upregulation correlates with p16 expression in chronic inflammation.
a, Principal component analysis of CD45CD31 cells from control (PBS, Ctrl) and chronically inflamed (LPS, Infl) lungs identified three clusters (1, 2 and 3) based on their principal component (PC) values. b, Cell density map for each cluster shown as a difference in Kernel density distribution between Ctrl and Infl conditions. The quantification of the fold change of cell frequency for each cluster is shown (right). Error bars were estimated by bootstrapping. A total of 1 × 104 cells were sampled from each cluster with sampling repeated 1 × 104 times. c, The expression intensity distribution of epithelial marker (EpCAM) and fibroblast markers (CD90.2, CD140a and CD140b) for identified clusters. Statistical significance was calculated by the Kruskal–Wallis test. d, Volcano plot displaying enrichment of senescence-related proteins and depletion of the proliferation marker Ki-67 within cluster 1 in comparison with clusters 2 and 3. The black line marks the effect size equal to 0. The left and right red lines mark the −0.1 and 0.1 effect size thresholds, respectively. e, The expression intensity distribution of the indicated proteins between Ctrl and Infl mice within cluster 1. f, Representative t-SNE plots of immune cell (CD45+) populations identified in 50,000 cells from all lung samples of Ctrl and Infl mice (left). The immune cell types distribution in Ctrl and Infl mice are shown, and significantly changed populations of AMs and IMs marked with an arrow (right). g, Frequency of AM and IM in the lungs of Ctrl and Infl mice. h, The change in the enrichment of senescence-related proteins in Infl/Ctrl mice for indicated immune cell types. i, Mean expression of PD-L1 between identified immune cell populations. j, Mean p16 (left) and PD-L1 (right) expression between AMs and IMs. k, AMs were binned into 8 bins in Ctrl and 13 bins in Infl with a median of 80 and 1,900 cells per bin, respectively. Spearman correlation coefficient (r) between p16 and PD-L1 expression in AMs of Ctrl and Infl mice and associated P value (P). Single cells were ranked by p16 expression level in bins from low to high. For each bin, the mean expression level of PD-L1 is shown. l, Mean PD-L1 expression in the 10% highest and 10% lowest p16-expressing cells within AM in the lungs of Ctrl and Infl mice. One-sided (e and kl) and two-sided (g and i) Mann–Whitney U tests was used for statistical analysis unless otherwise noted. Error bars, mean ± s.e.m. *P < 0.05, **P < 0.01, ***P < 0.001. In al, Ctrl (n = 5–7) and Infl (n = 5–7) lungs were used. Experiments were repeated three times independently with similar results. Source numerical data are available in Source data. Source data
Fig. 3
Fig. 3. p16 increases the stability of PD-L1 protein in senescent cells.
ac, Flow cytometry analysis of PD-L1 expression in DNA damage-induced senescence (D-Sen) (a and b), RIS (b) and in cells with p16 overexpression (p16 OE) (c) compared with control cells. Primary mouse lung fibroblasts (CCL-206) (a and c) and primary human lung fibroblasts (IMR-90) (b) were used in these experiments (n = 3–8). d,e, PD-L1 protein expression in growing IMR-90 cells treated with CDK4/6 inhibitors Palbociclib (Palbo) (d), Abemaciclib (Abem) (e) or vehicle (control) (n = 6–7). Gr, growing. f, PD-L1 protein expression in D-Sen treated with non-targeting small interfering RNA (siControl) or small interfering CDKN2A (siCDKN2A) (n = 9). g, ELISA-based measurement of PD-L1 protein levels in D-Sen treated with siControl or siCDKN2A and CHX (n = 3). hk, Immunoblot analysis of whole cell lysates derived from Gr and D-Sen cells (h), D-Sen cells treated with siControl and siCDKN2A (i), Gr and D-Sen cells treated with MG132 or vehicle (negative control) (k) (n = 3), and immunoblot (IB) analysis of ubiquitin in immunoprecipitated (IP) PD-L1 protein from Gr and D-Sen cells (j). l, Quantification of p16+, PD-L1+ and p16+PD-L1+ cells in normal lung tissue (n = 3) and human lung pathologies: emphysema (n = 3), fibrosis (n = 3), adenocarcinoma (n = 3) and squamous cell carcinoma (n = 3). m, Representative immunofluorescence image of p16 (red) and PD-L1 (green) staining in emphysema patient. Blue, nuclei stained by DAPI. Scale bar, 10 μm. The image is representative of n = 4 emphysema lung specimens. PD-L1 expression in af was quantified by flow cytometry analysis as median fluorescent intensity. Two-tailed unpaired Student’s t-test (a, c and g) and two-tailed paired Student’s t-test (d, e and f) was used. Error bars, mean ± s.e.m. *P < 0.05, **P < 0.01, ***P < 0.001. One-way ANOVA (b and l) was also used for statistical analysis; error bars, mean ± s.e.m. **P < 0.01, ****P < 0.0001. In ak, experiments were repeated three times independently with similar results. Source numerical data and unprocessed blots are available in Source data. Source data
Fig. 4
Fig. 4. Anti-PD-L1, but not anti-PD1, antibody depletes p16, PD-L1-positive cells in vivo.
a, Imaging flow cytometry analysis of subcellular localization of p16 and PD-L1 staining within the AM population. Representative images of CD45+PD-L1+p16+ (row a), CD45+PD-L1p16+ (row b) and CD45+PD-L1+p16 (row c) cells. Bright field (BF); scale bars, 10 μm. Images are representative from three mice repeated independently with similar results. b, INs-seq of p16+ and p16 AMs. GSEA of p16+ and p16 AMs. Control (n = 4) and inflamed (Infl; n = 4) samples were used. DESeq2 was used to derive gene fold changes for p16+ versus p16 macrophages, controlling for treatment (LPS/PBS) as a covariant. NES, normalized enrichment score. c,d, Flow cytometry analysis of lung with the percentage of Foxp3+ Tregs within CD4 population (c) and the percentage of CD4 Foxp3+ Tregs expressing PD1 (d). Ctrl, control (PBS); Infl, inflamed (LPS). e, Experimental setup: the mice that were exposed daily to either PBS (Ctrl) or LPS (Infl) inhalations for 5 days received anti-PD1, anti-PD-L1 or matched IgG control as indicated, and the lungs and BAL were analysed 48 h after the last inhalation. FC, flow cytometry. f,g, Flow cytometry analysis of lung (f) or BAL (g) from the mice treated as in e. f, Percentage of p16+PD-L1+ cells within CD45+ or AM cells. g, Percentage of CD8+ T cells positive for ICOS, CD25, CD44 and CD69. Two-sided Mann–Whitney U test (c and d) was used for statistical analysis. Error bars, mean ± s.e.m., ***P < 0.001. In f and g, one-way ANOVA was used for statistical analysis. Error bars, mean ± s.e.m., *P < 0.05, **P < 0.01, ***P < 0.001. In b and d, control (n = 5–9) and Infl (n = 5–7) samples were used. In f and g, LPS + IgG (n = 11), LPS + anti-PD1 (n = 10) and LPS + anti-PD-L1 (n = 10) samples were used. In cg, experiments were repeated three times independently with similar results. Source numerical data are available in Source data. Source data
Fig. 5
Fig. 5. Anti-PD-L1 antibody depletes p16- and PD-L1-positive cells in ageing and chronic lung inflammation.
a, Experimental setup included young or old mice that received an anti-PD-L1 or matched IgG control as indicated, and their lungs and blood were analysed 48 h after the last injection. FC, flow cytometry. b,c, Flow cytometry analysis of lungs from mice treated as in a, with a percentage of p16+PD-L1+ cells within CD45+ or AM (b) and a percentage of CD8+ T cells positive for ICOS, CD25, CD44, CD69 and PD1 (c). d, Plasma levels of IFN-γ and IL-10. e, Experimental setup included mice that were exposed three times a week for 10 weeks to LPS (Infl) inhalations and anti-PD-L1 or matched IgG control as indicated, and their lungs were analysed 48 h after the last inhalation. Naive mice were the control group (Ctrl). f, Percentage of p16+PD-L1+ cells within CD45+ or AM. g, Senescence-associated gene expression in the lungs of naive mice compared with the ones with chronic inflammation, treated with anti-PD-L1, or matched IgG control. For all experiments, statistical significance was calculated using one-way ANOVA; error bars, mean ± s.e.m. *P < 0.05, **P < 0.01, ***P < 0.001, ****P < 0.0001. In ad, young (n = 7), old + IgG (n = 7) and old + anti-PD-L1 (n = 8) mice were used. In eg, naive (n = 6–7), Infl + IgG (n = 7–10) and Infl + anti-PD-L1 (n = 7–8) mice samples were used. Experiments were repeated three times independently with similar results. Source numerical data are available in Source data. Source data
Extended Data Fig. 1
Extended Data Fig. 1. PD-L1 upregulation correlates with p16 expression in aging.
(A) The heatmap of normalized lineage markers expression for identified immune cell types. The relative frequency (B) and absolute number (C) of indicated immune cell types in young and old mice. Young (n = 4), old (n = 4). Two-sided Whitney-Mann U test was used for statistical analysis. Error bars, mean ± SEM. *p < 0.05, **p < 0.01, ***p < 0.001. Experiments were repeated three times independently with similar results. Source numerical data are available in source data. Source data
Extended Data Fig. 2
Extended Data Fig. 2. PD-L1 upregulation correlates with p16 expression in chronic inflammation.
(A) Cell density map for each cluster as a function of Kernel density distribution in Ctrl and Infl condition. (B) Violin plot displaying the expression intensity distribution of phenotypic markers for identified clusters. Statistical significance was calculated by the Kruskal-Wallis test. (C-D) RNA-seq of lung epithelial cells derived from lungs of Ctrl (n = 5) and Infl (n = 3) mice (C) Volcano plot of differentially expressed genes (DEGs) between Ctrl and Infl mice (n = 5). DEGs were identified by Padj < 0.05 and |Fold change | > 1.25. Immune response-related genes are labeled in red. (D) Gene Ontology (GO) enrichment analysis of DEGs identified in (C). GO terms are ordered by Normalized Enrichment Score (NES). A positive NES value indicates enrichment in Infl condition, negative NES value indicates enrichment in the Ctrl phenotype. The color of the bar denotes -log10 (p-value). (E) Heatmap of normalized lineage marker expression for indicated immune cell types. (F-G) Comparison of mean expression of p16, PD-L1, and MHCI markers within (F) AM and (G) IM in Ctrl and Infl mice (n = 7). (F-G) Two-sided Mann-Whitney test was used for statistical analysis. Error bars, mean ± SEM. *p < 0.05, **p < 0.01, ***p < 0.001, (A-G) control (n = 5−7), Infl (n = 5-7). A-B and E-G experiments were repeated three times independently with similar results. Source numerical data are available in source data. Source data
Extended Data Fig. 3
Extended Data Fig. 3. p16 increases the stability of PD-L1 protein in senescent cells.
(A) Representative histogram showing PD-L1 level in growing (Gr, blue), replicative senescence (RIS, orange), and DNA-damage-induced senescence (D-Sen, red) by flow cytometry. Isotype control for each condition is presented by a dashed line. (B-C) Immunoblot (IB) analysis of whole cell lysates derived from (B) HEK293T cells, (C) CCL-206 cells treated with vehicle (Control) or doxycycline (5 μg/ml or 10 μg/ml) to induce p16 overexpression (p16 OE). (D) B-TrCP levels from immunoblot analysis of IMR90 cells (D, left) growing (Gr) and D-Sen and (D, right) D-Sen cells treated with siControl and siCDKN2A. Two-tailed Student t-test; Error bars, mean ± SEM. *p < 0.05. (E) Representative immunofluorescence images of p16 (red) and PD-L1 (green) staining in normal lung tissue, and lungs in patients with pulmonary fibrosis, lung adenocarcinoma, and squamous cell carcinoma. Blue, nuclei stain by DAPI. Scale bars indicate 20 μm. Images are representative of normal (n = 4), fibrosis (n = 6), adenocarcinoma (n = 4), and squamous cell carcinoma (n = 6) lung specimens. B-D experiments were repeated independently three times with similar results. A-D experiments were repeated three times independently with similar results. Source numerical data and unprocessed blots are available in source data. Source data
Extended Data Fig. 4
Extended Data Fig. 4. Anti-PD-L1, but not anti-PD-1, antibody treatment depletes p16, PD-L1positive cells in vivo.
(A) Experimental setup: mice were exposed daily to either PBS (Ctrl) or LPS inhalations for 5 days before analysis of mice lungs 48 h after the last inhalation. (B) Representative flow cytometry plots showing the gating strategy for p16+ PD-L1+ cells from immune cells (CD45+) and Alveolar Macrophage (AM) population. (C-E) Flow cytometry analysis of (C) CD45+, (D) AM, and (E) p16+PD-L1+ cells within CD45+ and AM populations in mice treated as described in A. (n = 6-10) (F) Experimental setup: mice exposed daily to either PBS (Ctrl) or LPS inhalations for 5 days received anti-PD-L1 or matched IgG control as indicated, and lungs and bronchoalveolar lavage (BAL) were analysed 48 h after the last inhalation. (G-H) Flow cytometry analysis of lung (G) or BAL (H) from mice treated as in scheme F. (G) Percentage of p16+PD-L1+ cells within CD45+ or AM. (n = 5) (H) Percentage of CD8 T cells positive for ICOS, CD25, CD69, and PD1 (n = 13-14) (I) mRNA level of IFN-γ cytokine from CD8 T cells in BAL. Values are relative to mice treated with IgG control (n = 3-4). (C-E, G-I) Two-sided Mann-Whitney test was used for statistical analysis. Error bars, mean ± SEM *p < 0.05, **p < 0.01, ***p < 0.001, ****p < 0.0001. Experiments were repeated three times independently with similar results. Source numerical data are available in source data. Source data
Extended Data Fig. 5
Extended Data Fig. 5. Anti-PD-L1 antibody treatment depletes p16, PD-L1positive cells in aging and chronic lung inflammation.
(A-D) Analysis of old mice treated with either anti-PD-L1 or isotype control (IgG). Young mice are the control group. (A-B) Flow cytometry analysis of the lungs. (A) Representative flow cytometry plots showing the gating strategy for p16+ PD-L1+ cells from immune cells (CD45+) and Alveolar Macrophage (AM) population. (B) Percentage of NK cells positive for CD25, CD44, CD69, and PD1. (C) Plasma levels of IL6, IL17, and MCP-1. (D) Predicted age based on the epigenetic clock of the peripheral immune system in the blood. (E) Flow cytometry analysis of mice with chronic lung inflammation (Infl) treated with either anti-PD-L1 or IgG control. Naive mice were the control group (Ctrl). Percentage of CD8 T cells positive for ICOS, CD25, CD44, CD69, and PD1. (F) Scheme of anti-PD-L1 antibody treatment of senescent cells and its effect. Statistical significance was calculated using one-way ANOVA; n = 69, Error bars, mean ± SEM. *p < 0.05, **p < 0.01, ***p < 0.001, ****p < 0.0001, (B-D) young (n = 7), old + IgG (n = 7), old + anti-PD-L1 (n = 8); (E-H) naive (n = 7-8), Infl + IgG (n = 7-10), Infl + anti-PD-L1 (n = 7-8). Experiments were repeated three times independently with similar results. Source numerical data are available in source data. Source data

References

    1. Childs, B. G., Durik, M., Baker, D. J. & van Deursen, J. M. Cellular senescence in aging and age-related disease: from mechanisms to therapy. Nat. Med.21, 1424–1435 (2015). 10.1038/nm.4000 - DOI - PMC - PubMed
    1. Baker, D. J. et al. Naturally occurring p16(Ink4a)-positive cells shorten healthy lifespan. Nature530, 184–189 (2016). 10.1038/nature16932 - DOI - PMC - PubMed
    1. Baker, D. J. et al. Clearance of p16Ink4a-positive senescent cells delays ageing-associated disorders. Nature479, 232–236 (2011). 10.1038/nature10600 - DOI - PMC - PubMed
    1. Schoenwaelder, S. M. et al. Bcl-xL-inhibitory BH3 mimetics can induce a transient thrombocytopathy that undermines the hemostatic function of platelets. Blood118, 1663–1674 (2011). 10.1182/blood-2011-04-347849 - DOI - PubMed
    1. Pereira, B. I. et al. Senescent cells evade immune clearance via HLA-E-mediated NK and CD8+ T cell inhibition. Nat. Commun.10, 2387 (2019). 10.1038/s41467-019-10335-5 - DOI - PMC - PubMed

Publication types

MeSH terms