. 2024 Sep;27(9):1695-1707.
doi: 10.1038/s41593-024-01728-x. Epub 2024 Aug 5.

An activity-regulated transcriptional program directly drives synaptogenesis

Affiliations

An activity-regulated transcriptional program directly drives synaptogenesis

Callista Yee et al. Nat Neurosci. 2024 Sep.

Erratum in

Abstract

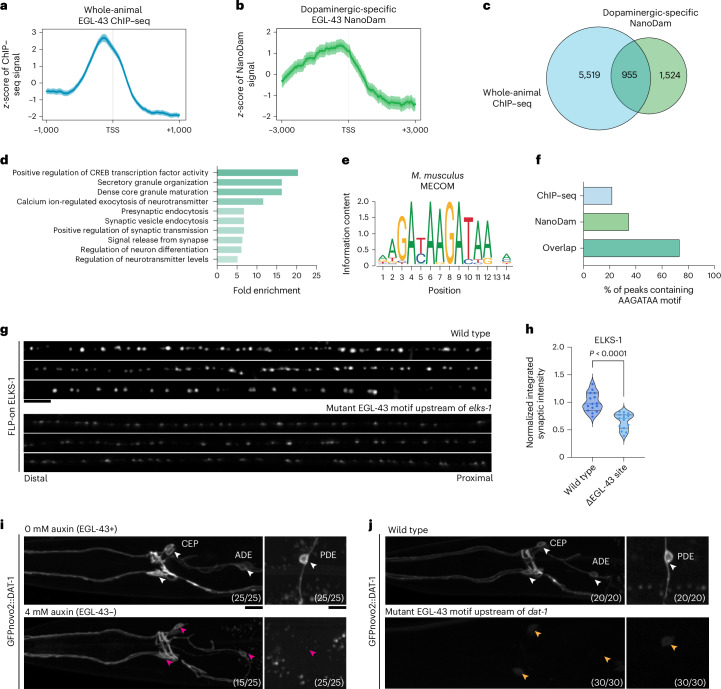
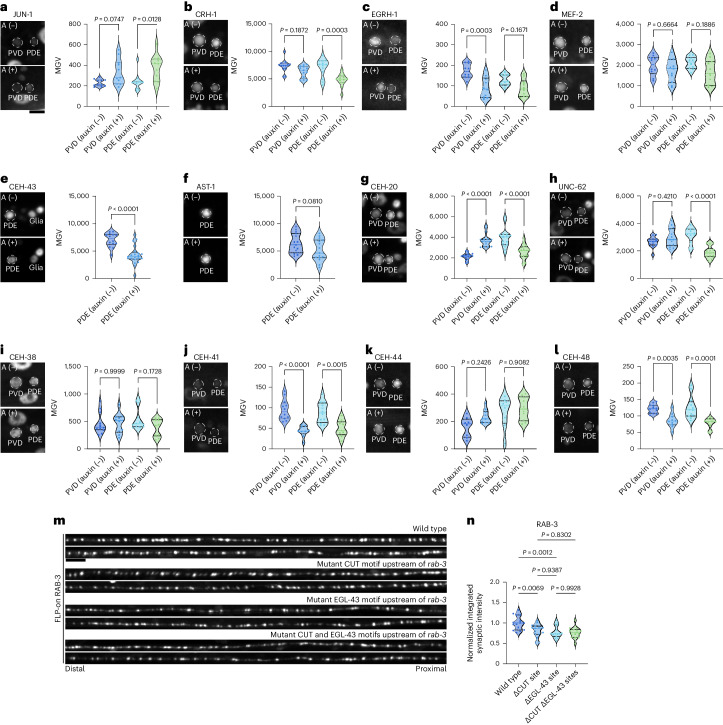
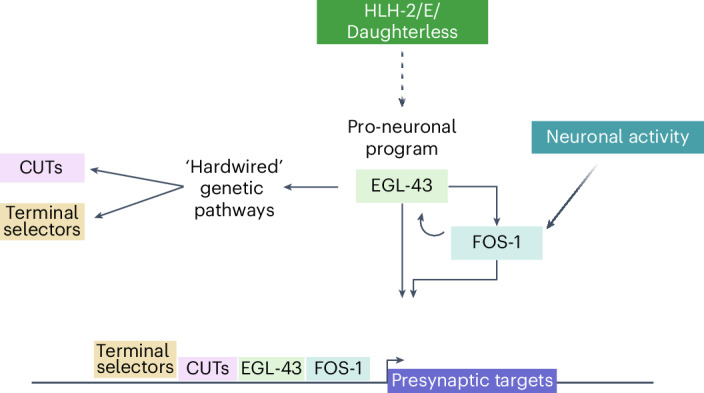
Although the molecular composition and architecture of synapses have been widely explored, much less is known about what genetic programs directly activate synaptic gene expression and how they are modulated. Here, using Caenorhabditis elegans dopaminergic neurons, we reveal that EGL-43/MECOM and FOS-1/FOS control an activity-dependent synaptogenesis program. Loss of either factor severely reduces presynaptic protein expression. Both factors bind directly to promoters of synaptic genes and act together with CUT homeobox transcription factors to activate transcription. egl-43 and fos-1 mutually promote each other's expression, and increasing the binding affinity of FOS-1 to the egl-43 locus results in increased presynaptic protein expression and synaptic function. EGL-43 regulates the expression of multiple transcription factors, including activity-regulated factors and developmental factors that define multiple aspects of dopaminergic identity. Together, we describe a robust genetic program underlying activity-regulated synapse formation during development.


Conflict of interest statement

The authors declare no competing interests.

Figures

Fig. 1
Fig. 1. Neuronal activity modulates synapse formation in the developing PDE axon.
a, Schematic representation and line scan of the PDE axon and its synapses labeled using a combinatorial approach. Endogenous FLP-on (FRT) GFP::ELKS-1 labels active zones and endogenous FLP-on (FRT3) mScarlet::TBA-1 labels microtubules (for axon morphology) when combined with a transgene expressing a dopaminergic-specific flippase (dat-1p::FLP). b, Top: schematic representation of PDE-silencing experiments. Transgenic animals expressing dat-1p::HisCl1 were placed on media containing histamine at the L2 stage and imaged at the L4 stage. Bottom: schematic representation of PDE-excitation experiments. Transgenic animals expressing dat-1p::ChR2 were subjected to blue light at the L2 or L4 stage and imaged either 2 h or 48 h post-treatment. This schematic was created with BioRender.com. c, Line scans of ELKS-1 in the PDE axon of animals carrying wyEx8629(dat-1p::HisCl), treated with 0 mM or 10 mM histamine. d, Quantification of ELKS-1 in PDE of animals shown in c (n = 14 for both conditions). e, Line scans of ELKS-1 in the PDE axon of animals carrying wyEx10629(dat-1p::ChR2), treated with or without blue light. f, Quantification of ELKS-1 of animals shown in e (n = 19 for both conditions). g, Transgenic animals carrying wyEx8629(dat-1p::HisCl) were imaged for their endogenous FOS-1::GFP signal in PVD and PDE neuronal nuclei (white dashed circles) in the presence or absence of 10 mM histamine. h, Quantification of FOS-1::GFP in animals shown in f (n = 11 for both conditions). i, Normalized expression of PDE FOS-1::GFP presented in h, compared to each paired PVD’s (sister cell of PDE) expression (n = 11 for both conditions). j, Transgenic animals carrying wyEx10630(dat-1p::ChR2) were treated at L3 with or without blue light for ten cycles (15 s on and 60 s off) and allowed to recover for 2 h. FOS-1::GFP was imaged in PVD and PDE nuclei (white dashed circles). k, Quantification of FOS-1::GFP in animals shown in i (n = 15 for both conditions). l, Normalized expression of PDE FOS-1::GFP presented in k compared to each paired PVD’s expression (n = 15 for both conditions). For images with line scans, scale bar = 20 μm; for images of neuronal nuclei, scale bar = 10 μm. For all graphs, medians are represented in thick dashed lines and quartiles are represented in thin dashed lines. P values presented were calculated using two-tailed unpaired Student’s t tests. MGV, mean gray value. Source data
Fig. 2
Fig. 2. EGL-43 is expressed in sensory neurons and is critical for dopaminergic synaptogenesis.
a, A potential model for activity-dependent synaptogenesis. Upstream, specialized TFs bind cooperatively with activity-dependent IEGs to activate downstream presynaptic targets. This schematic was created with BioRender.com. b, Comparison of MECOM-related proteins. From top to bottom: C. elegans EGL-43, Drosophila melanogaster Hamlet, Homo sapiens MECOM and Mus musculus MECOM. Features—red boxes represent ZF domains, purple boxes represent SET domains, blue boxes represent nuclear localization signal, gold boxes represent CTBP-binding motif 1 and green boxes represent CTBP-binding motif 2. c, Endogenous GFP-tagged EGL-43 is expressed in various sensory neuron nuclei, including head sensory neurons, the PVD and PDE neurons, and tail sensory neurons at the L4 stage (n > 50 animals examined, repeated thrice). d, Line scans of L4 PDE axons from egl-43(wy1514) animals expressing FLP-on ELKS-1 (to label active zones) and FLP-on TBA-1 (to label microtubules). Animals were treated with either 0 mM or 4 mM auxin. Line scans marked with single asterisk are imaged from the same worm to demonstrate the expression of both labels in the same animal, with the final line scan of each set with both channels merged (denoted with two asterisks). White arrowheads denote ELKS-1 puncta detected in the distal axon. e, Quantification of line scan intensities of animals shown in d (n = 20 for both conditions). Medians are represented in thick dashed lines, and quartiles are represented in thin dashed lines; P = 1.6215 × 10−18. f, Line scans of L4 PDE axons from egl-43(wy1514) animals expressing FLP-on RAB-3 and FLP-on TBA-1. Animals were treated with either 0 mM or 4 mM auxin. Line scans marked with single asterisk are imaged from the same worm to demonstrate the expression of both labels in the same animal, with the final line scan of each set with both channels merged (denoted with two asterisks). White arrowheads denote weak RAB-3 puncta detected in the distal axon. g, Quantification of line scan intensities of animals shown in f (n = 13 (untreated) and n = 22 (treated)). Medians are represented in thick dashed lines and quartiles are represented in thin dashed lines; P = 6.33578 × 10−7. P values presented were calculated using two-tailed unpaired Student’s t tests. Scale bar = 10 μm for all images. Source data
Fig. 3
Fig. 3. EGL-43 is a conserved ZF TF that controls presynaptic gene expression.
a, Aggregation plot of EGL-43 ChIP–seq signal across C. elegans genes. b, Aggregation plot of EGL-43 dopaminergic-specific NanoDam signal across C. elegans genes. For a and b, bold lines represent the mean signal, darker shading represents the estimated s.e. and lighter shading represents the 95% confidence interval. c, Venn diagram comparing EGL-43 ChIP–seq and dopaminergic-specific NanoDam datasets. Numbers represent peaks, either overlapping or unique to each dataset. d, GO analysis performed on the overlapping peaks between ChIP–seq and NanoDam datasets (PANTHER biological process). e, JASPAR TF binding profile for mouse (M. musculus) MECOM. f, Proportion of peaks within EGL-43 profiling datasets that contain a 5′-AAGATAA-3′ motif. g, Line scans of three PDE axons in animals carrying FLP-on ELKS-1 in the wild type and elks-1(wy1823), which possess a mutant EGL-43 motif. h, Quantification of PDE axon line scans of animals shown in f. P = 2.50832 × 10−6 and was calculated using a two-tailed unpaired Student’s t test. n = 15 for both genotypes. Medians are represented in thick dashed lines, and quartiles are represented in thin dashed lines. i, Representative micrographs of endogenous DAT-1 signal in animals carrying EGL-43::TagRFP-T::AID*. Animals were subjected to auxin treatment for 48 h. Arrowheads denote cell bodies of dopaminergic neurons (white, 0 mM auxin, and pink, 4 mM auxin). Numbers indicate the number of animals that resemble the phenotype shown in images. This experiment was repeated four times with similar penetrance. j, Representative micrographs of endogenous DAT-1 signal in wild-type animals and animals and dat-1(wy1824), which possess a mutant EGL-43 motif. White and yellow arrowheads indicate dopaminergic neuron cell bodies of respective genotypes. Numbers indicate the number of animals that resemble the phenotype shown in images. This experiment was repeated thrice with similar penetrance. Scale bar = 10 μm for all images. Source data
Fig. 4
Fig. 4. FOS-1 is critical for presynaptic gene expression in dopaminergic neurons.
a, Images of L4 animals carrying endogenous FOS-1::GFP and EGL-43::TagRFP-T::AID* treated with 0 mM or 4 mM auxin for 48 h. PVD and PDE neuronal nuclei are outlined (white dashed circles). Auxin experiments were repeated independently with similar results (n = 3). b, Quantification of FOS-1::GFP intensity of nuclei (n = 15 for both conditions). c, Venn diagram displaying overlap of peaks between dopaminergic FOS-1 NanoDam and EGL-43 NanoDam. d, Left: GO term analysis of genes mapping to FOS-1 NanoDam peaks. Right: GO term analysis of genes mapping to the overlap between FOS-1 and EGL-43 NanoDam peaks. e, Line scans of FLP-on GFP ELKS-1 in PDE axons. The top two sets of line scans correspond to animals carrying endogenous FOS-1::TagRFP-T::AID* that were treated with either 0 mM or 4 mM auxin. Images were thresholded in the same fashion. The line scan denoted with single asterisk was thresholded to increase the visibility of synapses for illustrative purposes. Arrowheads point to small synapses that are nearly undetectable in the distal axon. The final set of PDE line scans corresponds to FLP-on ELKS-1 expression in animals with the AP-1 site deleted upstream of the TSS of elks-1. f, Quantification of line scans in e, where n = 14 for all conditions. For graph comparisons, P = 5.77664 × 10−21 for auxin (−) versus auxin (+) and P = 8.76057 × 10−21 for auxin (−) versus ΔAP-1 site. g, Line scans of FLP-on GFP RAB-3 in PDE axons of animals carrying FOS-1::TagRFP-T::AID*, treated with 0 mM or 4 mM auxin. h, Quantification of animals i (n = 15 for both conditions, P = 5.21856 × 10−8). For all graphs, medians are represented in thick dashed lines, and quartiles are represented in thin dashed lines. P values were calculated using two-tailed unpaired Student’s t tests. Scale bar = 10 μm for all images. Source data
Fig. 5
Fig. 5. FOS-1 modulates egl-43 expression.
a, L4 animals carrying EGL-43::GFP and FOS-1::TagRFP-T::AID* were treated with 0 mM or 4 mM auxin for 48 h to degrade FOS-1. PVD and PDE nuclei are outlined (white dashed circles). b, Quantification of EGL-43::GFP intensity shown in a (n = 16 for both conditions). c, JASPAR TF binding profiles for C. elegans FOS-1 (top) and H. sapiens FOS (bottom). d, SNP effect matrix of H. sapiens FOS. The purple rectangle highlights the position of the consensus FOS motif that differs in wild-type C. elegans. e, EGL-43::GFP expression in either the wild type or in animals carrying a gain-of-function (denoted as egl-43(gof)) mutation in their FOS-1-binding site upstream of the egl-43. PVD and PDE nuclei are outlined (white dashed circles). This schematic was created with BioRender.com. f, Quantification of EGL-43::GFP intensity shown in e (n = 14 for both conditions). g, Line scans of FLP-on ELKS-1 in the PDE axon in the wild type and animals carrying egl-43(gof). h, Quantification of line scans of animals shown in g (n = 10 for both conditions, P = 5.45276 × 10−7). i, Line scans of FLP-on RAB-3 in the PDE axon in the wild type and animals carrying egl-43(gof). j, Quantification of line scans of animals shown in i (n = 10 for both conditions, P = 2.18919 × 10−5). For all graphs, medians are represented in thick dashed lines and quartiles are represented in thin dashed lines. P values displayed in this figure were calculated using two-tailed unpaired Student’s t tests. Scale bar for all images = 10 μm. Source data
Fig. 6
Fig. 6. A dopaminergic behavioral circuit is dependent on EGL-43 and FOS-1 expression.
a, Schematic representation of the backing assay. ChR2 was specifically expressed in dopaminergic neurons using the dat-1 promoter. Healthy, fed worms move forward, foraging on a bacterial lawn. On constant excitation by blue light, dopaminergic neurons activate and induce a backing response, followed by a reversal. The time from the onset of the blue light to a backing response was recorded. Wild-type worms perform the backing behavior in under 2 s under our conditions. b, Animals carrying a mutation to enhance FOS-1 binding upstream of the egl-43 locus exhibit a faster backing response than the wild type (n = 20 for both conditions, P = 2.60044 × 10−6). c, Auxin-induced degradation of either EGL-43 or FOS-1 results in a significantly slower backing response. n = 14 for all conditions tested; P = 0.0002 (−auxin versus +auxin for EGL-43), P = 2.52982 × 10−8 (−auxin versus +auxin for FOS-1). For all graphs, medians are represented in thick dashed lines, and quartiles are represented in thin dashed lines. P values were calculated using two-tailed unpaired Student’s t tests. Source data
Fig. 7
Fig. 7. EGL-43 regulates the expression of activity-dependent TFs and hardwired genetic pathways to promote presynaptic gene expression.
al, Left: images of L4 animals carrying endogenously tagged GFP or mNG TFs and EGL-43::TagRFP-T::AID* treated with 0 mM (A(−)) or 4 mM auxin (A(+)) for 48 h. PVD and PDE neuronal nuclei are outlined (white dashed circles). Right: quantification of TF intensity in the images shown on the left. Classification of the following factors tested with sample sizes: activity-dependent TFs JUN-1, n = 11 (A−) and n = 11 (A+) (a); CRH-1, n = 13 (A−) and n = 13 (A+) (b); EGRH-1, n = 10 (A−) and n = 10 (A+) (c); MEF-2, n = 10 (A−) and n = 11 (A+) (d). Classification of the following dopaminergic terminal selectors/associated factors: CEH-43, n = 14 (A−), n = 21 (A+), P = 8.6174 × 10−6 (e); AST-1, n = 15 (A−), n = 15 (A+) (f); CEH-20, n = 15 (A−), n = 15 (A+), P = 3.84033 × 10−11 (PDE) (g); UNC-62, n = 12 (A−), n = 14 (A+), P = 1.15877 × 10−12 (PVD), P = 2.78114 × 10−8 (PDE) (h). CUT homeobox TFs are as follows: CEH-38, n = 12 (A−), n = 10 (A+) (i); CEH-41, n = 12 (A−), n = 9 (A+), P = 4.09353 × 10−9 (PVD) (j); CEH-44 n = 8 (A−), n = 10 (A+) (k); CEH-48, n = 12 (A−), n = 10 (A+) (l). m, Line scans of PDE axons from animals expressing endogenous FLP-on RAB-3. Mutations were generated in the promoter of rab-3 corresponding to the CUT, EGL-43 or both CUT and EGL-43 motifs. n, Quantification of the line scans shown in m (n = 15 for all genotypes). For all graphs, medians are represented in thick dashed lines, and quartiles are represented in thin dashed lines. P values were calculated using ordinary one-way ANOVA except for e and f, which were calculated using two-tailed unpaired Student’s t tests. Scale bar = 5 μm for images of nuclei; scale bar = 10 μm for line scans of PDE axons. Source data
Fig. 8
Fig. 8. A model for the role of EGL-43 in dopaminergic neurons.
EGL-43 functions downstream of the initial pro-neuronal fate commitment and is a key organizer of synaptogenesis in dopaminergic neurons. Together with the activity-dependent TF FOS-1, EGL-43 functions in a positive feedback loop and binds upstream regulatory regions of synaptic targets to promote gene expression. Simultaneously, EGL-43 promotes the expression of hardwired genetic programs, such as terminal selector and pan-neuronal (CUT) TFs, that in turn also bind presynaptic loci and promote transcription through the same pathway. We hypothesize that during development, neuronal activity can modulate the strength of synaptic gene expression through EGL-43 and FOS-1 to ensure functional connectivity. This schematic was created with BioRender.com.

References

    1. Deguchi, Y., Donato, F., Galimberti, I., Cabuy, E. & Caroni, P. Temporally matched subpopulations of selectively interconnected principal neurons in the hippocampus. Nat. Neurosci.14, 495–504 (2011). - PubMed
    1. Hobert, O. & Kratsios, P. Neuronal identity control by terminal selectors in worms, flies, and chordates. Curr. Opin. Neurobiol.56, 97–105 (2019). - PubMed
    1. Leyva-Diaz, E. & Hobert, O. Robust regulatory architecture of pan-neuronal gene expression. Curr. Biol.32, 1715–1727 (2022). - PMC - PubMed
    1. Andreae, L. C. & Burrone, J. The role of neuronal activity and transmitter release on synapse formation. Curr. Opin. Neurobiol.27, 47–52 (2014). - PMC - PubMed
    1. Wiesel, T. N. & Hubel, D. H. Single-cell responses in striate cortex of kittens deprived of vision in one eye. J. Neurophysiol.26, 1003–1017 (1963). - PubMed

MeSH terms

Substances