

doi: 10.1038/s41593-024-01730-3.
Epub 2024 Aug 5.
Oligodendrocytes produce amyloid-β and contribute to plaque formation alongside neurons in Alzheimer's disease model mice
Affiliations
- PMID: 39103558
- PMCID: PMC11374705
- DOI: 10.1038/s41593-024-01730-3
Item in Clipboard
Oligodendrocytes produce amyloid-β and contribute to plaque formation alongside neurons in Alzheimer's disease model mice
Nat Neurosci.
2024 Sep.
Abstract
Amyloid-β (Aβ) is thought to be neuronally derived in Alzheimer's disease (AD). However, transcripts of amyloid precursor protein (APP) and amyloidogenic enzymes are equally abundant in oligodendrocytes (OLs). By cell-type-specific deletion of Bace1 in a humanized knock-in AD model, APPNLGF, we demonstrate that OLs and neurons contribute to Aβ plaque burden. For rapid plaque seeding, excitatory projection neurons must provide a threshold level of Aβ. Ultimately, our findings are relevant for AD prevention and therapeutic strategies.
© 2024. The Author(s).
Conflict of interest statement
The authors declare no competing interests.
Figures
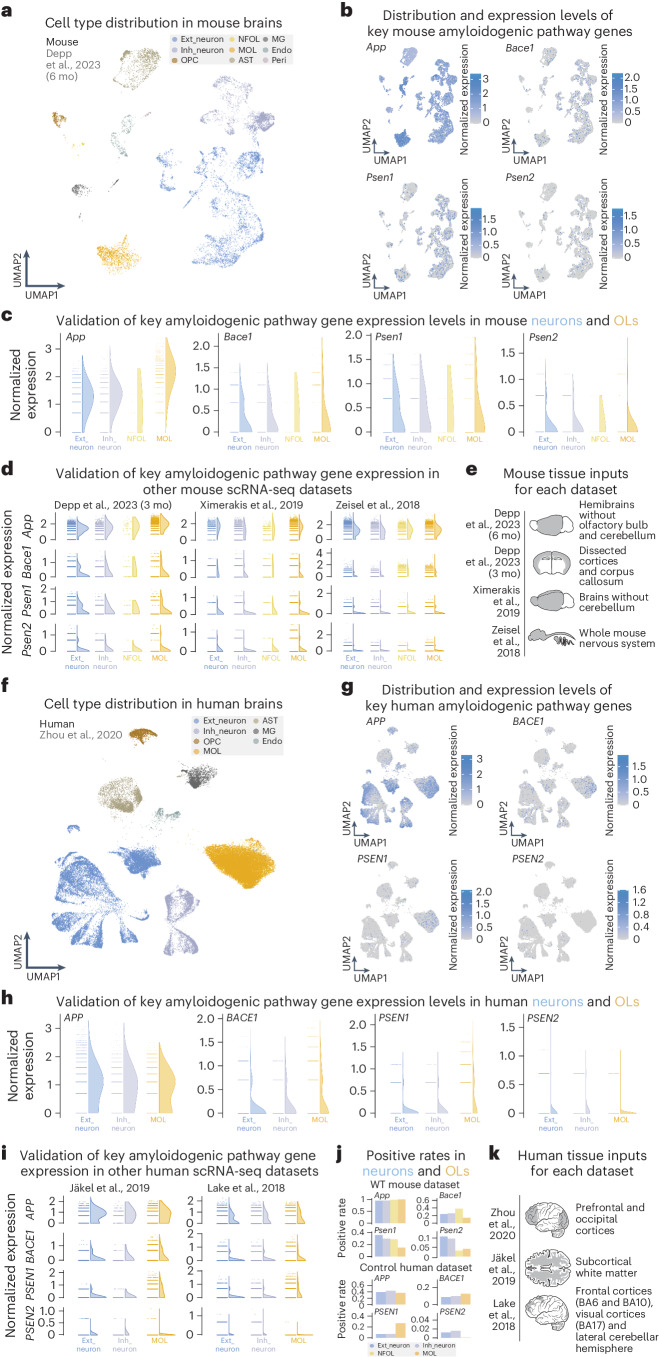
a, UMAP visualization of cell types from a 6-month-old mouse brain snRNA-seq dataset. b, Feature plots showcasing expression of key amyloidogenic genes (App, Bace1, Psen1 and Psen2) across all cell types in WT mouse brains. c, Expression level half violin plots of key amyloidogenic genes in neurons and OLs of mouse brains normalized by the SCTransform method, highlighting the similar expression of all genes between neurons and OLs. d, Expression level half violin plots of key amyloidogenic genes in neurons and OLs normalized by the SCTransform normalization method from additional mouse datasets–. e, Mouse nervous tissue inputs for sequencing from each study are shown. f, UMAP visualization of cell types from a human brain snRNA-seq dataset. g, Feature plots showcasing expression of key amyloidogenic genes (APP, BACE1, PSEN1 and PSEN2) across all cell types in control human brains. h, Expression level half violin plots of key amyloidogenic genes in neurons and OLs of human brains with the SCTransform normalization method, highlighting the similar expression of these genes between neurons and OLs. i, Expression level half violin plots of key amyloidogenic genes in neurons and OLs normalized by the SCTransform normalization method from additional human datasets,. j, Positive rate bar plots of APP processing genes in mouse and human nervous tissue inputs. k, Human nervous tissue inputs for sequencing from each study are shown. c,d,h,i, Half violins represent aggregated expression levels of respective genes from each cell type, and data points refer to individual expression levels from single cells or nuclei normalized by SCTransform. The results published here are based on data obtained from the Gene Expression Omnibus and the AD Knowledge Portal. mo, months; UMAP, uniform manifold approximation and projection.
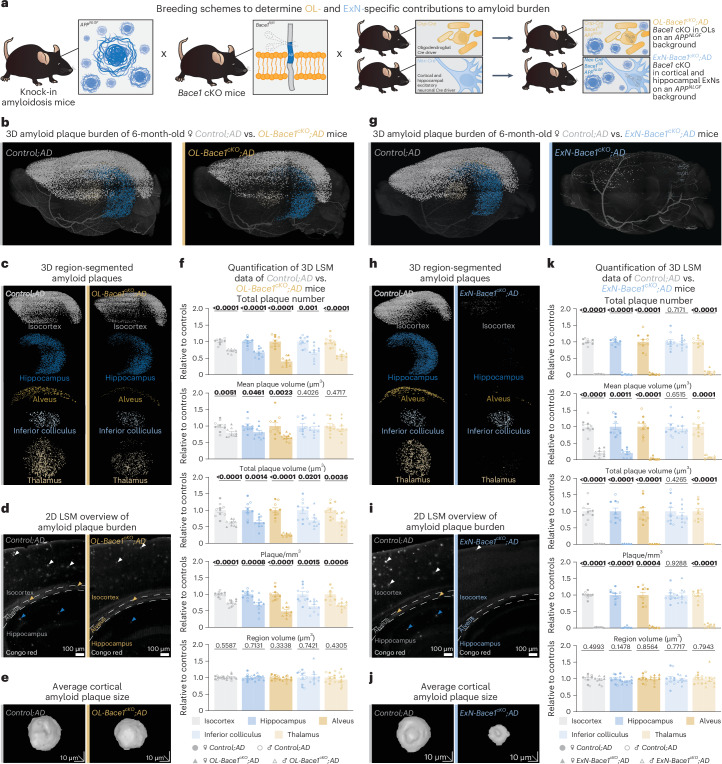
a, Mouse breeding setup to investigate the OL-specific and ExN-specific contributions to Aβ burden. b–f, LSM data of plaque burden (Congo red) comparing 6-month-old OL-Bace1cKO;AD mice to age-matched and sex-matched littermate controls. g–k, LSM data of plaque burden (Congo red) comparing 6-month-old ExN-Bace1cKO;AD mice to age-matched and sex-matched littermate controls. b–k, Color-region allocation is as follows: white, isocortex; blue, hippocampus; yellow, alveus; pastel blue, inferior colliculus; pastel yellow, thalamus. b,g, LSM 3D visualization of control and cKO hemibrains. c,h, Brain region-segmented plaques of control and cKO hemibrains. d,i, LSM 2D single plane of control and cKO hemibrains. Arrowheads point to plaques with colors indicating specific regions. e,j, LSM 3D renders of representative cortical Aβ plaques of control and cKO hemibrains. f,k, Quantification of LSM data between controls (n = 5 per sex) and cKOs (n = 5 per sex). Normalization of cKO data points to sex-matched controls was performed. Circles represent controls, and triangles represent cKOs. Filled shapes represent male mice, and hollowed shapes represent female mice. For each parameter, unpaired, two-tailed Student’s t-test was performed (P values indicated in graphs with significance highlighted in bold) comparing cKOs to controls. Bars represent means with s.e.m., and individual data points are displayed. Raw data are available in Supplementary Tables 1 and 2. Source data
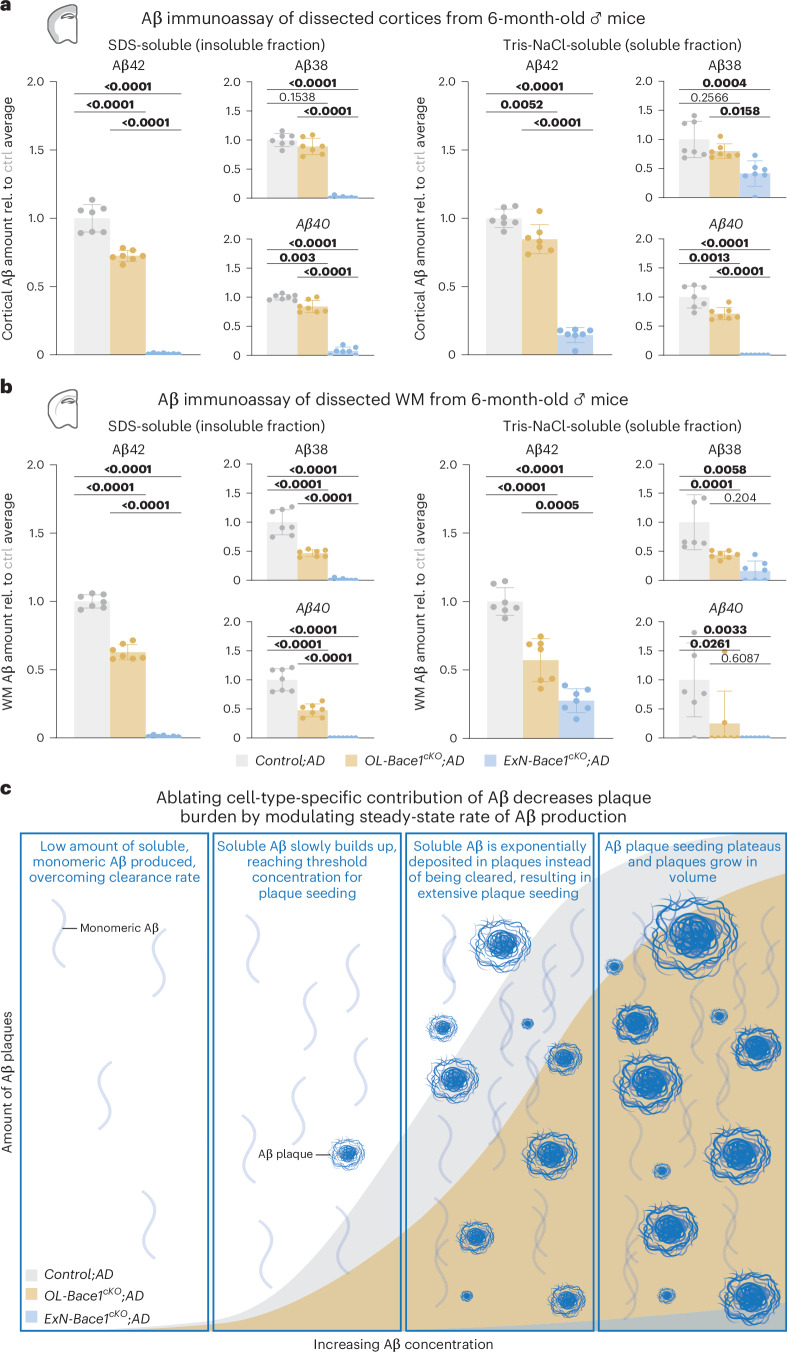
a,b, Aβ electrochemiluminescence immunoassay data of insoluble (SDS-soluble, left) and soluble (Tris-NaCl-soluble, right) lysates of microdissected cortical (a) and WM (b) tissues from control and cKO 6-month-old male mouse hemibrains (n = 7 per group). Triplex immunoassay measured Aβ38, Aβ40 and Aβ42 levels, and data points were normalized to Control;AD samples. Of note, SDS-soluble fractions from both regions mirrored LSM data, whereas Tris-NaCl-soluble fractions revealed a substantial amount of soluble Aβ still being produced, even in ExN-Bace1cKO;AD mice, signifying a residual Aβ production from other cells. Statistical analysis: one-way ANOVA with Tukey multiple comparison tests (P values indicated in graphs with significance highlighted in bold). Bars represent means with s.e.m., and individual data points are displayed. Raw unnormalized data are available in Supplementary Table 6. c, Working model of modulating cell-type-specific Aβ contributions. Selectively ablating Aβ from specific cell types results in steady-state rate change of Aβ production, causing exponentially slower plaque growth that follows a sigmoidal growth curve. ctrl, control; rel., relative. Source data
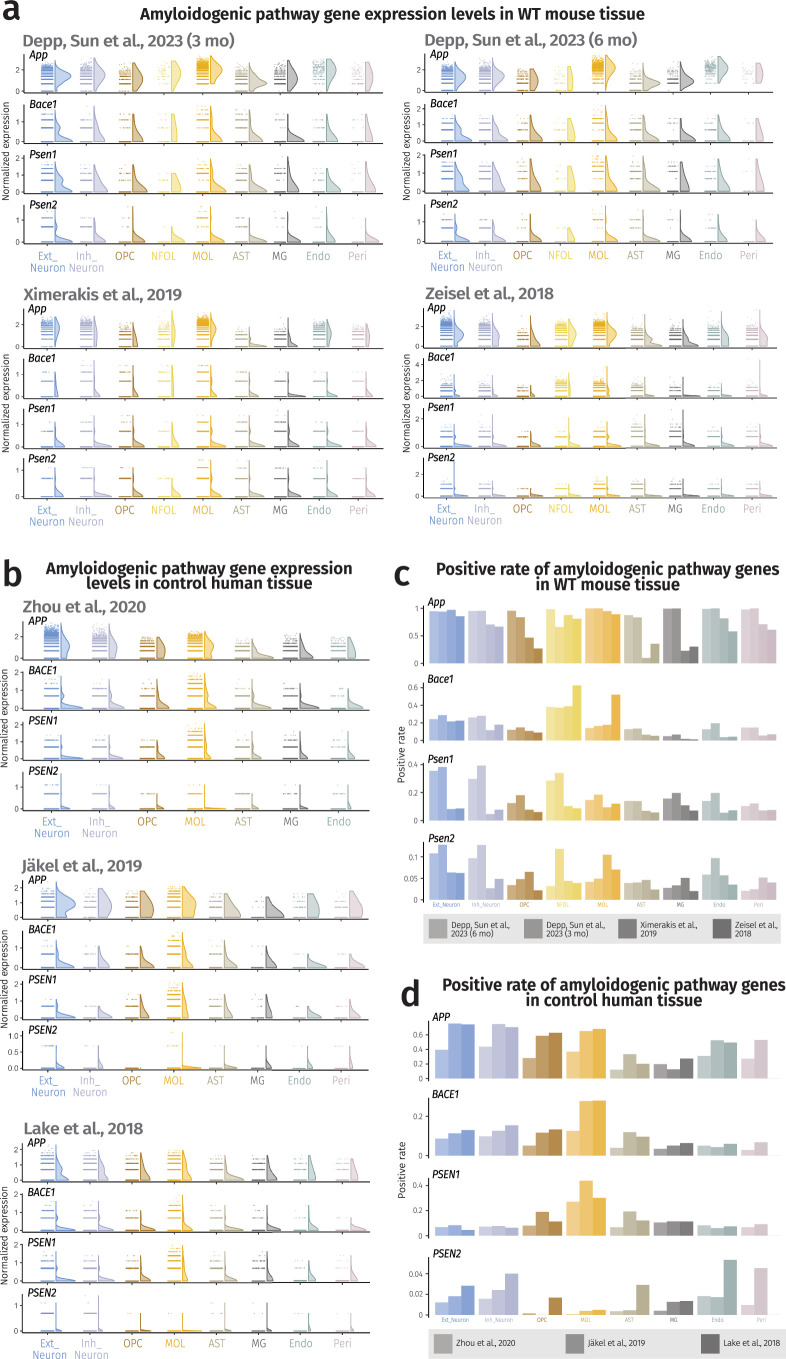
(a) Expression level half violin plots of amyloidogenic pathway genes in all cell types of mouse nervous tissue inputs with SCTransform normalization method from all chosen mouse datasets,,. (b) Expression level half violin plots of amyloidogenic pathway genes in all cell types of human nervous tissue inputs with SCTransform normalization from all chosen human datasets–. (a, b) Half violins represent aggregated expression levels of respective genes from each cell type and data points refer to individual expression levels from single cells or nuclei normalized by the SCTransform method. (c) Positive rate barplots of amyloidogenic pathway genes in all cell types of mouse nervous tissue inputs from all chosen mouse datasets,,. (d) Positive rate barplots of amyloidogenic pathway genes in all cell types of human nervous tissue inputs with SCTransform normalization method from all analyzed human datasets–. The results published here are based on data obtained from GEO and the AD Knowledge Portal. Source data
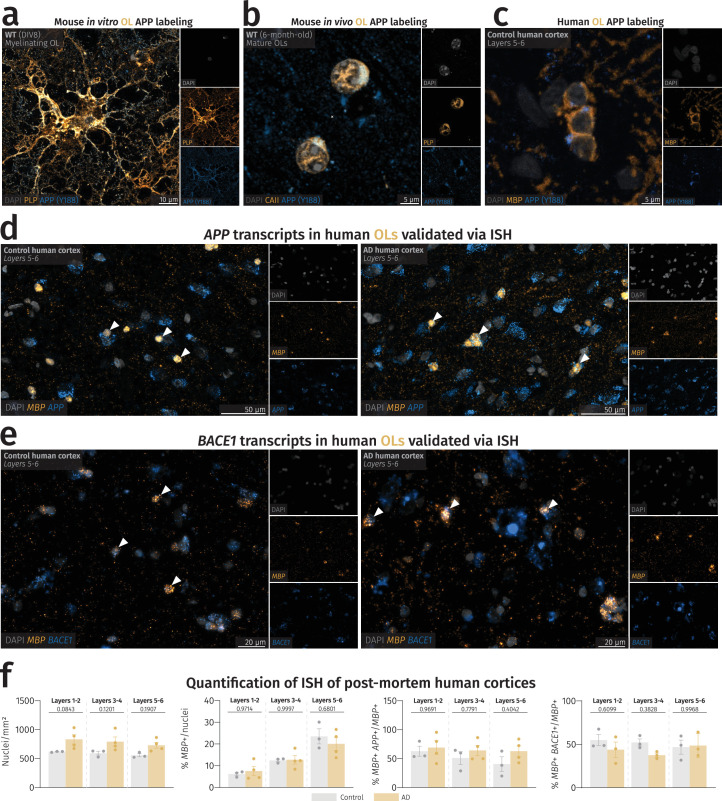
(a) A confocal image of an in vitro OL with APP present in the soma and cellular processes. Experiment was repeated thrice in separate in vitro cultures. (b) A confocal image of in vivo mouse cortical OLs with APP present in the perinuclear space. Experiment was repeated thrice in separate in vitro cultures. (c) A fluorescence microscopy image of human cortical OLs showing APP reactivity in the perinuclear space. Immunolabeling was performed once on all control human samples (n = 3). (d) ISH images of human cortical layers 5–6 with visible APP puncta in MBP+ cells of control (left) and AD (right) patients. Arrowheads point to APP-expressing OLs. (e) ISH images of human cortical layers 5-6 with visible BACE1 puncta in MBP+ cells of control (left) and AD (right) patients. Arrowheads point to BACE1-expressing OLs. (f) Quantification of nuclear count, MBP+ nuclei, MBP+ APP+ nuclei, and MBP+ BACE1+ nuclei in control (n = 3) and AD (n = 3–4) patients. One-way ANOVA was performed with Sidak multiple comparison tests (P values indicated in graphs with significance highlighted in bold) comparing AD patients to controls. Bars represent means with SEM, and individual data points are displayed. Source data
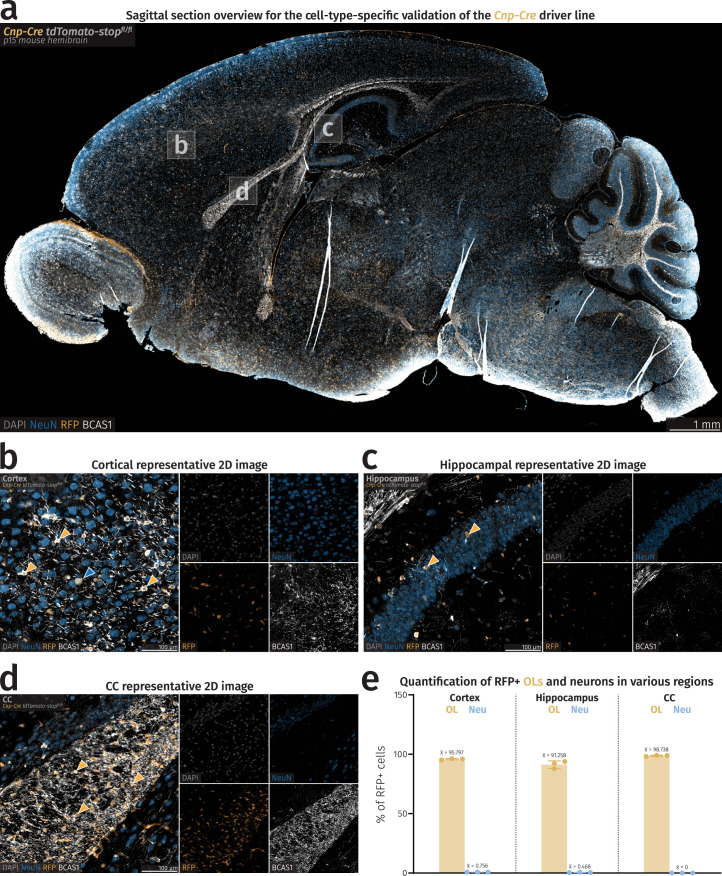
(a) Fluorescence microscopy sagittal overview of a Cnp-Cre stop-flox tdTomato mouse. (b-d) Closeup images of cortex, hippocampus, and CC of a Cnp-Cre stop-flox tdTomato mouse. Yellow arrowheads point to RFP+ OLs and the blue arrowhead points to a single RFP+ neuron in the cortex. (e) Barplots showing percentages of RFP+ OLs and neurons in specific brain regions. Mean percentage values are shown above each bar. Rounded average total number of cells considered for quantification is as follows: Cortex–OLs=283, cortex–neurons=9,232, hippocampus–OLs=66, hippocampus–neurons=3,203, CC–OLs=344, CC–neurons=1. Source data
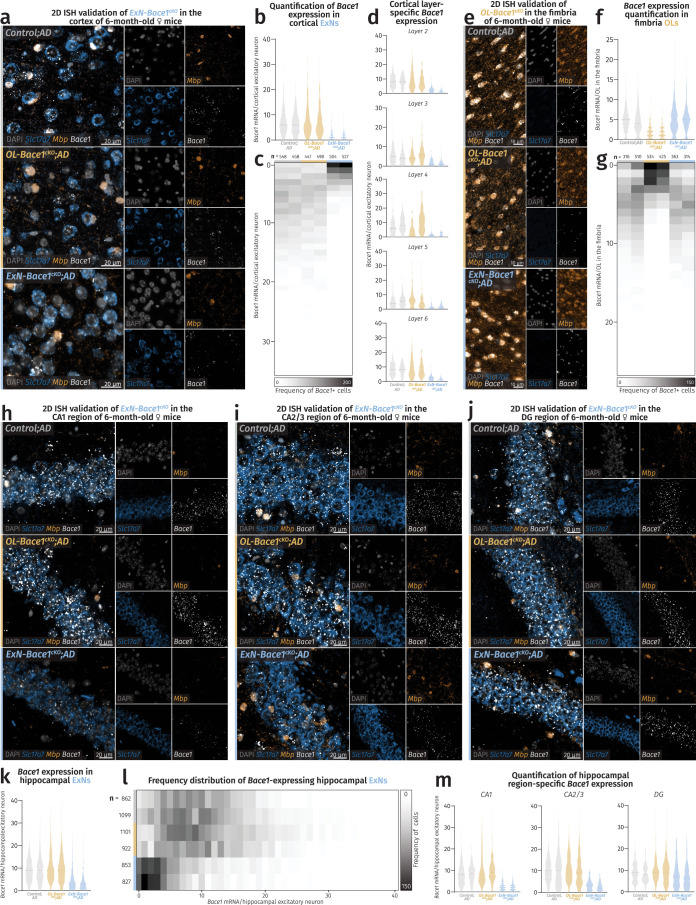
(a-d) ISH validation of Bace1 cKO in cortical ExNs. (e-g) ISH validation of Bace1 cKO in fimbria OLs. (h-m) ISH validation of Bace1 cKO in hippocampal ExNs. (a) Fluorescence microscopy images of cortices showing reductions of Bace1 transcripts in ExNs of ExN-Bace1cKO;AD samples. (b) Violin plots showing individual mouse distribution of Bace1 puncta/cortical ExN nuclei. (c) Frequency distribution heatmap of individual mouse distribution of Bace1 puncta/cortical ExN nuclei. (d) Violin plots showing cortical layer-specific individual mouse distribution of Bace1 puncta/ExN nuclei. (e) Fluorescence microscopy images of hippocampal fimbriae showing reductions of Bace1 transcripts in OLs of OL-Bace1cKO;AD samples. (f) Violin plots showing individual mouse distribution of Bace1 puncta/fimbria OL nuclei. (g) Frequency distribution heatmap of individual mouse distribution of Bace1 puncta/fimbria OL nuclei. (h-j) Fluorescence microscopy images of hippocampal CA1, CA2/3, and DG respectively showing reductions of Bace1 transcripts only in ExNs of ExN-Bace1cKO;AD samples. (k) Violin plots showing individual mouse distribution of Bace1 puncta/hippocampal ExN nuclei. (l) Frequency distribution heatmap of individual mouse distribution of Bace1 puncta/hippocampal ExN nuclei. (m) Violin plots showing hippocampal region-specific individual mouse distribution of Bace1 puncta/ExN nuclei. For (b,d,f,k,m), comparison was made between control, OL-Bace1cKO;AD, and ExN-Bace1cKO;AD mice (n = 2 per group). Solid lines represent median and faded lines represent quartiles. For (c,g,l), n-numbers refer to amount of nuclei considered for each region and cell type analysis and make up the data cloud for violin plots shown in (b,d,f,k,m). Source data
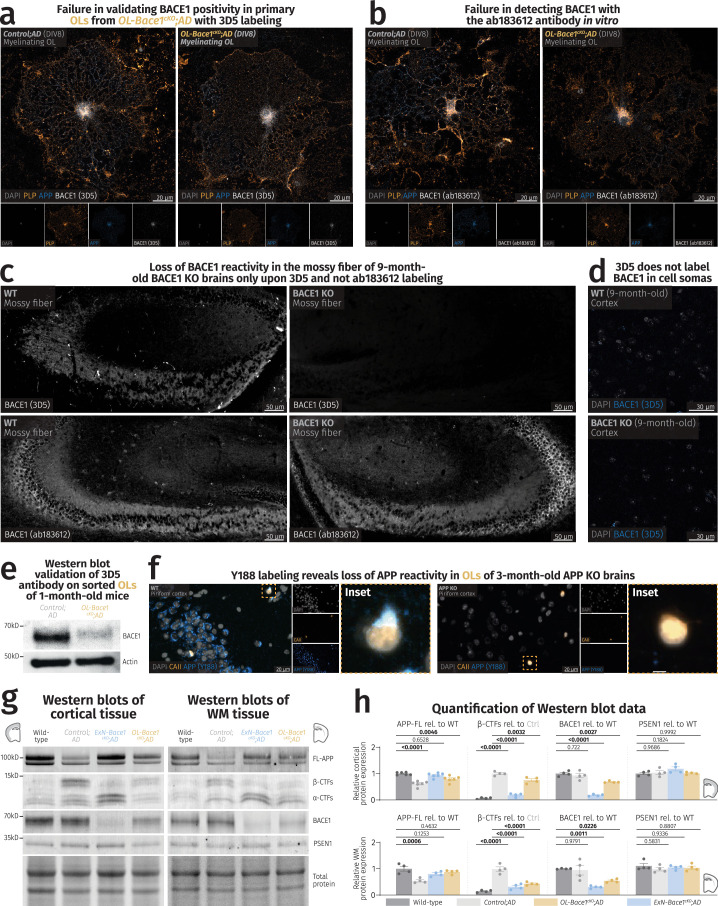
(a) Confocal images of primary OLs harvested from Control;AD and OL-Bace1cKO;AD mice labeled with PLP (yellow), APP (blue), and 3D5 for BACE1 (white). The punctate 3D5 labeling is equally present in Control;AD and OL-Bace1cKO;AD, suggesting an unspecific BACE1 staining. Experiment was repeated twice in separate in vitro cultures. (b) Confocal images of primary OLs harvested from Control;AD and OL-Bace1cKO;AD mice labeled with PLP (yellow), APP (blue), and ab183612 for BACE1 (white). No BACE1 reactivity could be detected. Experiment was repeated twice in separate in vitro cultures. (c) Fluorescence microscopy images of mossy fibers of 9-month-old WT (left) and constitutive BACE1 KO (right) animals labeled with 3D5 (top) and ab183612 (bottom) for BACE1 (white). Loss of mossy fiber staining was only detected via 3D5 labeling. Immunolabeling was performed once on brain slices from different mice (n = 2 per group). (d) Confocal images of 9-month-old WT (top) and constitutive BACE1 KO (bottom) cortices labeled with DAPI (gray) and 3D5 for BACE1 (blue). Note the absence of any intracellular staining of 3D5 in both WT and BACE1 KO animals, hinting at the inability of the 3D5 antibody to detect BACE1 in cell somas. Immunolabeling was performed once on brain slices from different mice (n = 2 per group). (e) Immunoblot representative images of BACE1 and the loading control, actin, on sorted OLs from 1-month-old Control;AD and OL-Bace1cKO;AD (n = 1 per group), showing a proof of concept ablation of BACE1 in a cell-type-specific manner. (f) Fluorescence microscopy images of piriform cortices of 3-month-old WT (left) and constitutive APP KO (right) animals labeled with CAII (yellow) and Y188 for APP (blue) for BACE1 (white). APP reactivity, including the APP labeling in OL soma (insets), is abolished in the KO tissue. Immunolabeling was performed once on brain slices from different mice (n = 2 per group). (g-h) Cell-type-specific deletion of
Bace1
alters APP processing. (g) Immunoblots and total protein content of microdissected cortical and WM tissues from 6-month-old male mice targeting key amyloidogenic proteins in lysates. (h) Immunoblot quantification showing APP processing in WT, control, ExN-Bace1cKO;AD and OL-Bace1cKO;AD (n = 4–6 per group) lysates. Top–cortical, bottom–WM. All immunoblots were normalized to WT relative protein amount except β-CTFs which were normalized to control AD relative protein amount. Data was statistically analyzed via one-way ANOVA was performed with Tukey multiple comparison tests (P values indicated in graphs with significance highlighted in bold). Bars represent means with SEM and individual data points displayed. Source data
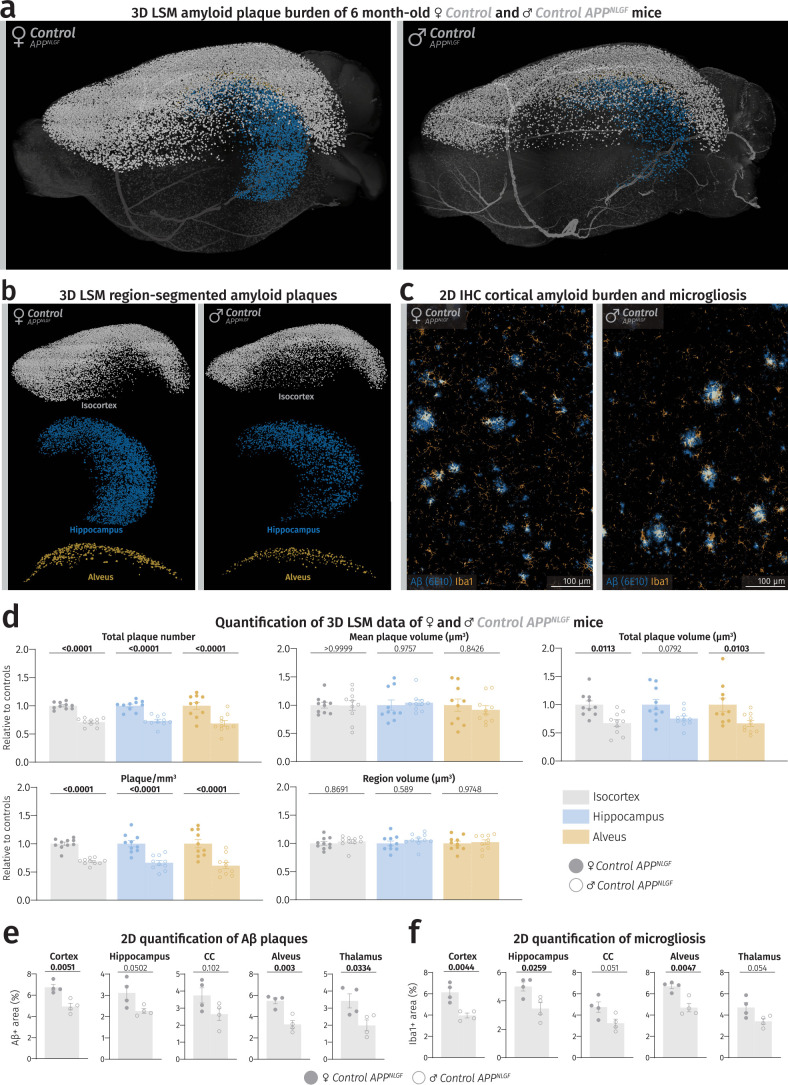
(a) LSM 3D visualization of female and male control APPNLGF hemibrains at 6 months of age. (b) Brain region-segmented plaques of female and male control APPNLGF hemibrains. Color-region allocation is as follows: White–isocortex, blue–hippocampus, yellow–alveus. (c) Fluorescence microscopy images of female and male control APPNLGF cortices. (d) Quantification of LSM data between female and male control APPNLGF hemibrains (n = 10 per sex). Male data points were normalized to female data. Filled shapes represent male and hollowed shapes represent female mice. For each parameter, unpaired, two-tailed Student’s t-test was performed (P values indicated in graphs) comparing males to females. Bars represent means with s.e.m. and individual data points are displayed. Raw unnormalized data is available in Supplementary Table 1. (e,f) Quantification of Aβ load and microgliosis in different brain regions of male and female control APPNLGF mice (n = 4 per sex). Unpaired, two-tailed Student’s t-test was performed for each regional quantification (P values indicated in graphs with significance highlighted in bold) comparing males to females. Bars represent means with SEM and individual data points displayed. Source data
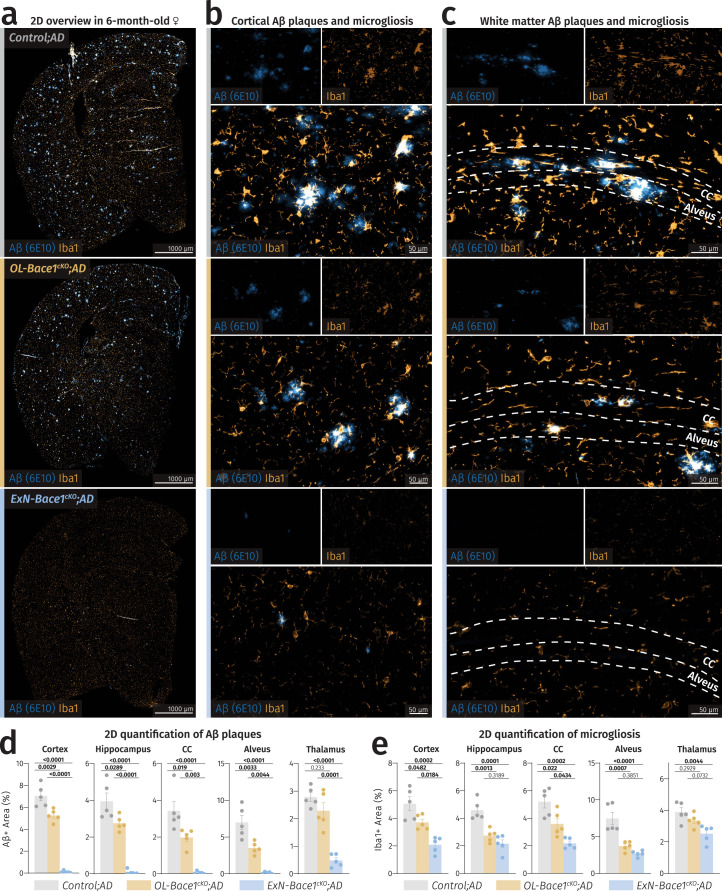
(a) Coronal sections of female control, OL-Bace1cKO;AD and ExN-Bace1cKO;AD mouse hemibrains stained for microglia (Iba1) and Aβ (6E10). (b,c) Closeup images of cortex and WM of control and cKO mice showing moderate and marked reductions of both Aβ deposits and microgliosis in OL-Bace1cKO;AD and ExN-Bace1cKO;AD samples, respectively. Inherent changes in microgliosis could thus be excluded as microglia only appear reactive to plaques and not in regions devoid of them. (d,e) Quantification of Aβ load and microgliosis between controls and cKOs (n = 5 per group) spanning different regions. Microgliosis was shown to be directly linked to plaque load. One-way ANOVA was performed with Tukey multiple comparison tests (P values indicated in graphs with significance highlighted in bold). Bars represent means with SEM and individual data points displayed. Source data
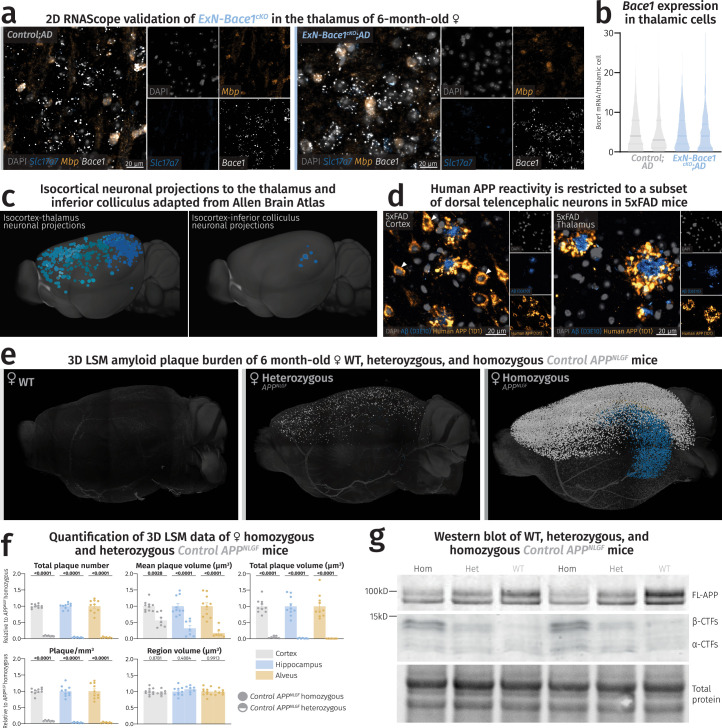
(a) Fluorescence microscopy images of thalami of control and ExN-Bace1cKO;AD samples with no apparent reduction in Bace1 transcripts in ExNs. (b) Violin plots showing individual mouse distribution of Bace1 puncta/thalamic nuclei. Solid lines represent medians and faded lines represent quartiles. (c) Isocortical regions containing neuronal projections into the thalamus (left) and the inferior colliculus (right). Inferior colliculus primarily receives cortical input from the auditory cortex. Images were adapted from the Allen Brain Atlas: Mouse Connectivity: Projection (https://connectivity.brain-map.org/ ). (d) Fluorescence microscopy images of 5xFAD mouse cortex (left) and thalamus (right) stained for Aβ42 (blue) and human-specific APP (yellow). White arrowheads point to neuronal somas in the cortex but not the thalamus of 5xFAD mice positive for human-specific APP. Immunolabeling was performed once on brain slices of 6-month-old 5xFAD mice (n = 4) (e-g) Plaque deposition is not directly proportional to
APPNLGF
gene dosage. (e) LSM 3D visualization of female WT, heterozygous, and homozygous APPNLGF hemibrains at 6 months of age. (f) Quantification of LSM data between female homozygous (n = 10) and heterozygous APPNLGF mice (n = 7). Heterozygous data points were normalized to homozygous data. Circles represent homozygous APPNLGF mice and half-filled circles represent heterozygous APPNLGF mice. For each parameter, unpaired, two-tailed Student’s t-test was performed (P values indicated in graphs) comparing the two groups. Bars represent means with SEM and individual data points displayed. Raw unnormalized data is available in Supplementary Table 3. (g) Immunoblot of 6-month-old male homozygous APPNLGF, heterozygous APPNLGF, and WT mice labeled for APP (n = 2 per group). Heterozygous mice express half of the APPNLGF gene dosage, resulting in a FL-APP level between WT and homozygous APPNLGF mice. This is accompanied by a concomitant accumulation of half β-CTFs in heterozygous lysates compared to the homozygous amount. Source data
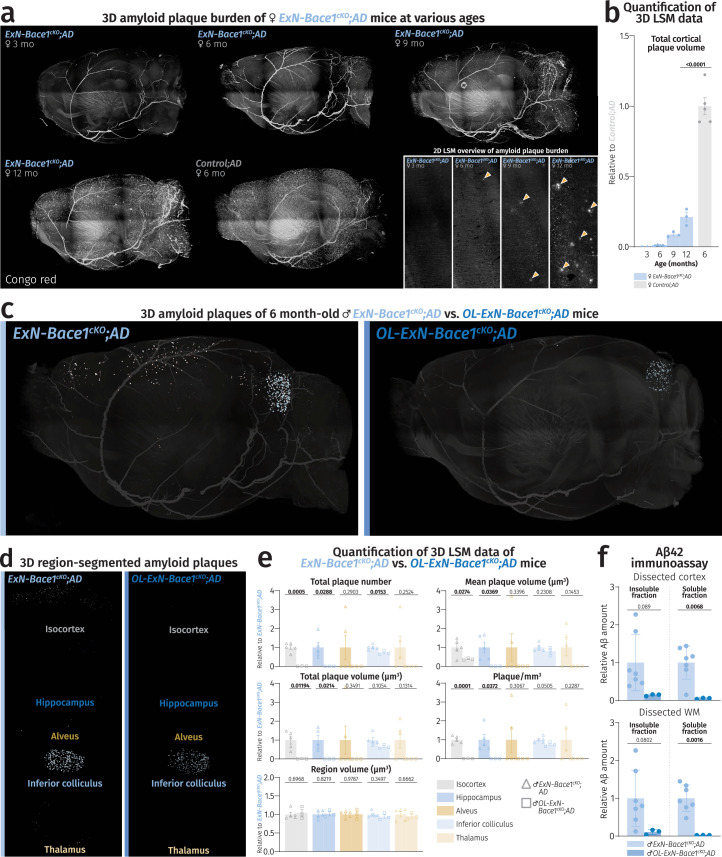
(a) LSM 3D visualization of female ExN-Bace1cKO;AD mice at 3, 6, 9, and 12 months alongside a Control;AD mouse brain at 6 months stained with Congo Red. Bottom right insets represent 2D cortical planes with yellow arrowheads pointing to plaques. (b) Quantification of LSM total cortical plaque volume between ExN-Bace1cKO;AD at various time points (n = 3–5 per group). Normalization of ExN-Bace1cKO;AD data points to Control;AD data points was performed. Blue bars represent ExN-Bace1cKO;AD data points and the gray bar represents Control;AD. An unpaired, two-tailed Student’s t-test was performed (P values indicated in the graph with significance highlighted in bold) comparing 12-month-old ExN-Bace1cKO;AD and 6-month-old Control;AD data. Bars represent means with SEM and individual data points displayed. Raw unnormalized data is available in Supplementary Table 4. (c-f) Double
Bace1
cKO in OLs and ExNs ablated cerebral Aβ burden. Light sheet microscopy data of plaque burden (Congo red) comparing 6-month-old OL-ExN-Bace1cKO;AD male mice to age- and sex-matched ExN-Bace1cKO;AD mice. Color-region allocation is as follows: White–isocortex, blue–hippocampus, yellow–alveus, pastel blue–inferior colliculus, pastel yellow–thalamus. (c) LSM 3D visualization of ExN-Bace1cKO;AD and OL-ExN-Bace1cKO;AD male mouse hemibrains. (d) Brain region-segmented plaques of ExN-Bace1cKO;AD and OL-ExN-Bace1cKO;AD male mouse hemibrains. (e) Quantification of LSM data between ExN-Bace1cKO;AD (n = 5) and OL-ExN-Bace1cKO;AD (n = 3) hemibrains. Normalization of OL-ExN-Bace1cKO;AD data points was performed to ExN-Bace1cKO;AD. Hollowed triangles represent ExN-Bace1cKO;AD and hollowed squares represent OL-ExN-Bace1cKO;AD. For each parameter, unpaired, two-tailed Student’s t-test was performed (P values indicated in graphs) comparing the two groups. Bars represent means with SEM and individual data points displayed. Raw unnormalized data is available in Supplementary Table 5. (f) Aβ42 electrochemiluminescence immunoassay data of insoluble (SDS-soluble, left) and soluble (Tris-NaCl-soluble, right) lysates of microdissected cortical (top) and WM (bottom) tissues from ExN-Bace1cKO;AD (n = 7) and OL-ExN-Bace1cKO;AD (n = 3) fractions of 6-month-old male mouse hemibrains. Data points were normalized to ExN-Bace1cKO;AD samples. The small amount of Aβ42 still produced in ExN-Bace1cKO;AD fractions is almost completely ablated in OL-ExN-Bace1cKO;AD fractions, highlighting the OL contribution to Aβ42 even in the absence of Aβ42 from ExNs. An unpaired, two-tailed Student’s t-test was performed (P values indicated in the graph with significance highlighted in bold) comparing the two groups. Bars represent means with SEM and individual data points displayed. Raw unnormalized data are available in Supplementary Table 6. Source data
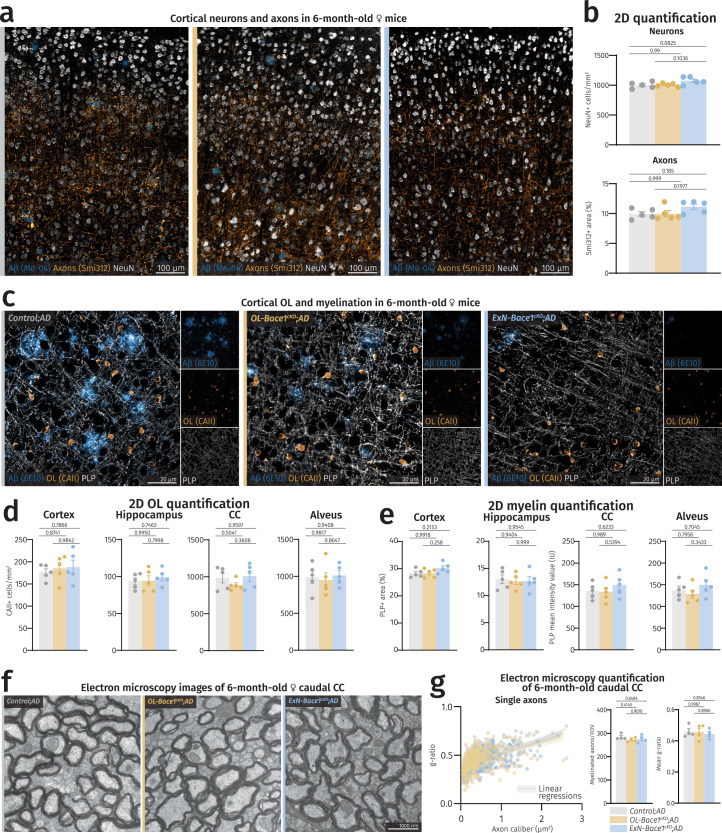
(a) Closeups of fluorescence microscopy images of cortices of controls and cKOs highlighting unchanged density of neurons and axons in both cKO lines at a gross level. (b) Quantification of neuronal and axonal densities between 6-month-old female controls and cKOs (n = 5 per group) in the isocortex. (c-g)
Bace1
cKO does not alter myelination profile. (c) Closeups of fluorescence microscopy images of cortices of controls and cKOs highlighting unchanged density of OLs and myelination in both cKO lines at a gross level. (d) Quantification of OL density between controls and cKOs (n = 5 per group) spanning different regions. (e) Quantification of myelin density between controls and cKOs (n = 5 per group) spanning different regions. As CC and alveus are densely myelinated tracts, mean intensity values were instead measured. (f) Representative electron micrographs of caudal corpus callosum (CC) of controls and cKOs at 6 months of age. (g) Analysis of myelin thickness via g-ratio measurement with single dots representing single myelinated axons quantified (Control;AD = 397, OL-Bace1cKO;AD = 417, ExN-Bace1cKO;AD = 394). Lines represent linear regressions of each group and shaded area indicates error bars. Myelinated axon counts and mean g-ratio comparisons from electron micrographs of controls and cKOs (n = 4 per group). For (b,d,e,g), one-way ANOVA was performed with Tukey multiple comparison tests (P values indicated in graphs with significance highlighted in bold). Bars represent means with SEM and individual data points displayed. Source data
References
MeSH terms
Substances
LinkOut - more resources
Full Text Sources
Medical
