. 2024 Aug;56(8):1592-1596.
doi: 10.1038/s41588-024-01844-1. Epub 2024 Aug 5.

Genetic risk factors for COVID-19 and influenza are largely distinct

Collaborators, Affiliations

Genetic risk factors for COVID-19 and influenza are largely distinct

Jack A Kosmicki et al. Nat Genet. 2024 Aug.

Abstract

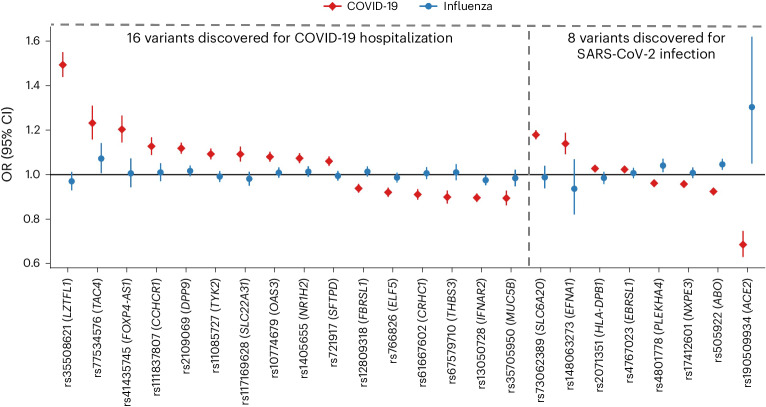
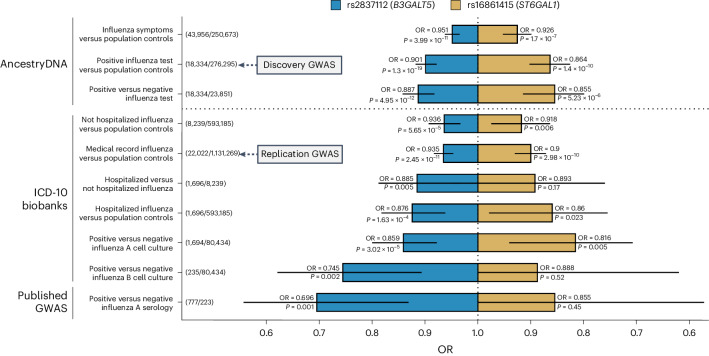
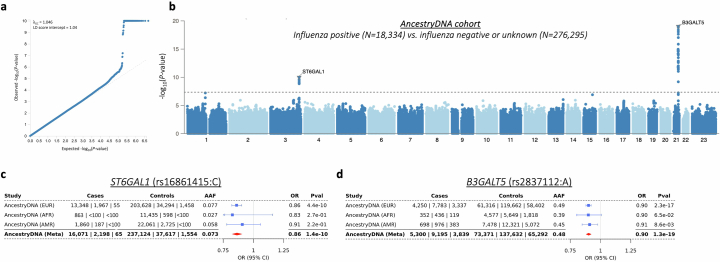
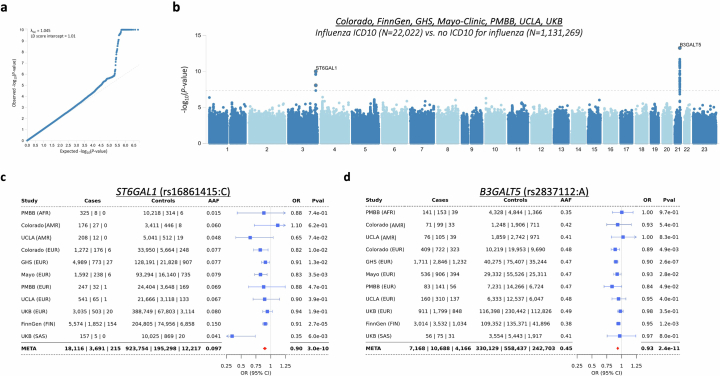
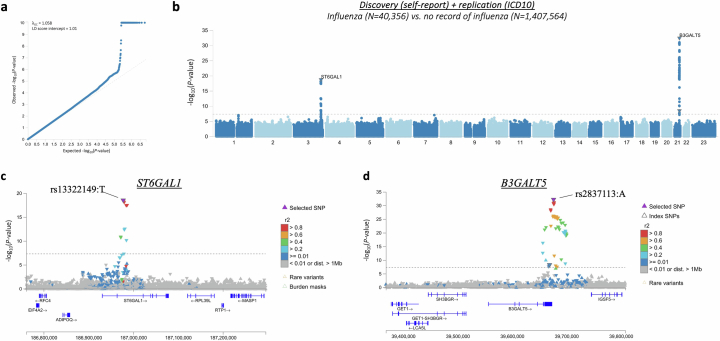
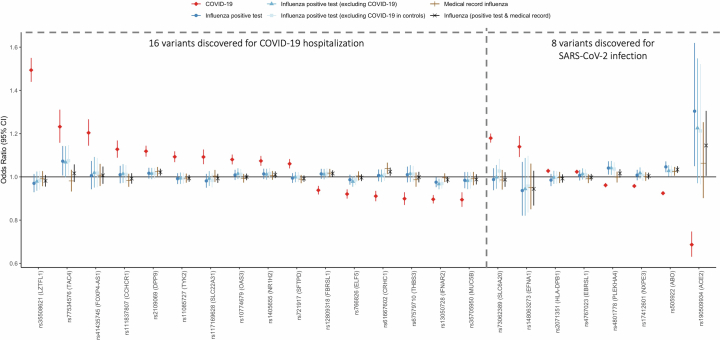
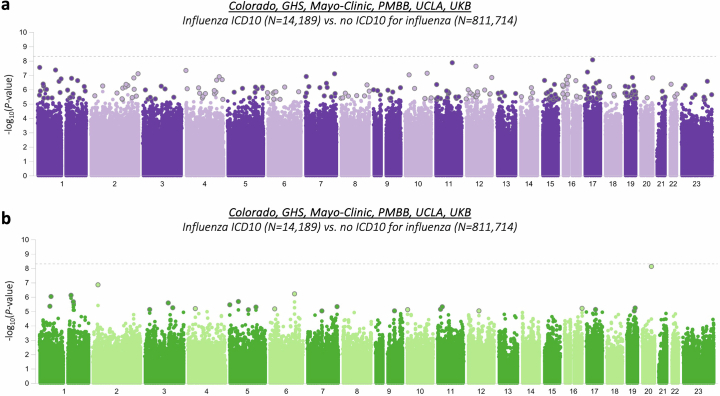
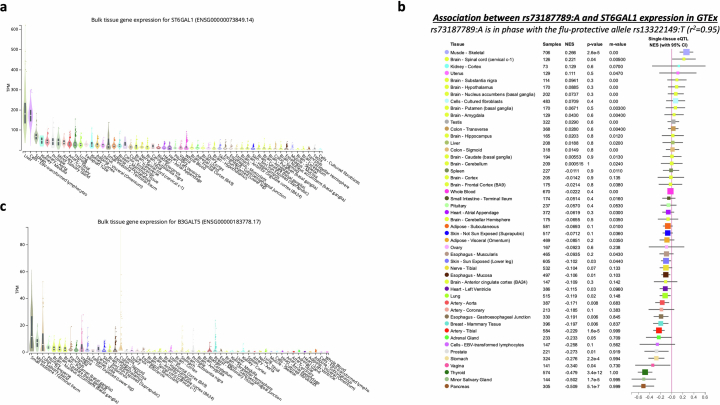
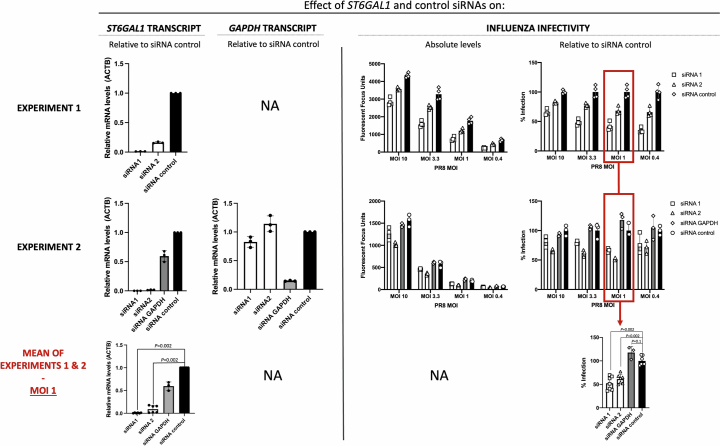
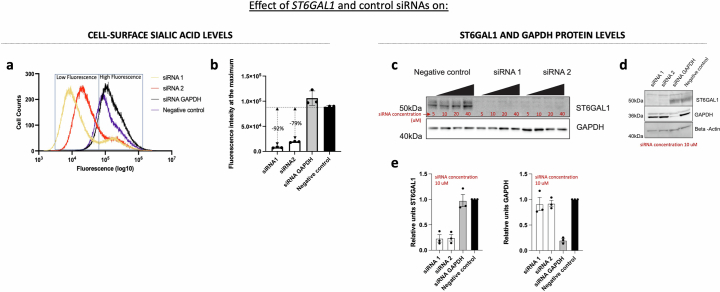
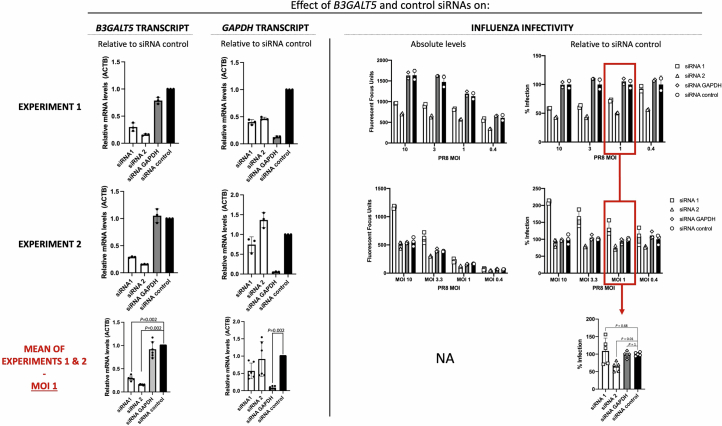
Coronavirus disease 2019 (COVID-19) and influenza are respiratory illnesses caused by the severe acute respiratory syndrome coronavirus 2 (SARS-CoV-2) and influenza viruses, respectively. Both diseases share symptoms and clinical risk factors1, but the extent to which these conditions have a common genetic etiology is unknown. This is partly because host genetic risk factors are well characterized for COVID-19 but not for influenza, with the largest published genome-wide association studies for these conditions including >2 million individuals2 and about 1,000 individuals3-6, respectively. Shared genetic risk factors could point to targets to prevent or treat both infections. Through a genetic study of 18,334 cases with a positive test for influenza and 276,295 controls, we show that published COVID-19 risk variants are not associated with influenza. Furthermore, we discovered and replicated an association between influenza infection and noncoding variants in B3GALT5 and ST6GAL1, neither of which was associated with COVID-19. In vitro small interfering RNA knockdown of ST6GAL1-an enzyme that adds sialic acid to the cell surface, which is used for viral entry-reduced influenza infectivity by 57%. These results mirror the observation that variants that downregulate ACE2, the SARS-CoV-2 receptor, protect against COVID-19 (ref. 7). Collectively, these findings highlight downregulation of key cell surface receptors used for viral entry as treatment opportunities to prevent COVID-19 and influenza.


Conflict of interest statement

J.A.K., A.M., D.S., S.A.D.G., S.B., X.-M.Y., G.T., H.M., C.S., M.D.K., J.E.H., N.B., R.L., E.M., X.B., A.J.M., J. Mbatchou, K.W., W.J.S., A.R.S., J. Marchini, J.D.O., L.H., J.G.R., A.E., C.K., K.K., A. Baum, M.N.C., K.S., A. Baras, G.R.A. and M.A.R.F. are current employees or stockholders of Regeneron Genetics Center or Regeneron Pharmaceuticals. G.H.L.R., M.V.C., D.S.P., S.C.K., H.G., A. Baltzell, A.R.G., S.R.M., R.P., D.A.T., M.Z., K.A.R., E.L.H. and C.A.B. are current or past employees of AncestryDNA and may hold equity in AncestryDNA. The other authors declare no competing interests.

Figures

Fig. 1
Fig. 1. Association between reported influenza infection in the AncestryDNA cohort and 24 variants previously reported to be associated with COVID-19 outcomes by the HGI.
Of the 24 COVID-19 risk variants, 16 were discovered in a GWAS of COVID-19 hospitalization (comparing 25,027 cases hospitalized with COVID-19 against 2,836,272 individuals with no record of SARS-CoV-2 infection), while eight were discovered in a GWAS of reported SARS-CoV-2 infection (comparing 125,415 individuals with a record of SARS-CoV-2 infection against 2,575,157 individuals with no record of SARS-CoV-2 infection). Of the 24 variants, only one (rs505922, 9:133273813:C:T, in ABO), was associated with reported influenza (18,334 cases versus 276,295 controls) after Bonferroni correction for 24 tests (P = 0.002, obtained using Firth regression, two-sided test); however, the direction of effect for influenza (blue circles) was the opposite of that reported for COVID-19 (red diamonds). The error bars represent the 95% CI for the OR estimate.
Fig. 2
Fig. 2. Association between ST6GAL1 and B3GALT5 variants and ten influenza-related phenotypes.
Variants in ST6GAL1 (rs16861415) and B3GALT5 (rs2837112) were associated with lower risk of reporting a positive test for influenza in the AncestryDNA cohort (discovery GWAS, total n = 294,629). The association between both variants and influenza infection was confirmed when analyzing medical record-based influenza status in an independent analysis of 1,153,291 individuals from seven biobank cohorts (replication GWAS; the cohorts are listed in Supplementary Table 1). Sensitivity analyses based on eight additional phenotypes showed that (1) in the AncestryDNA cohort, effect sizes for both variants were comparable after excluding controls with no available influenza test results, while they were weaker when testing a looser phenotype that considered only flu-like symptoms; (2) in two biobank cohorts with available hospitalization data (UKB, GHS), restricting the case group to individuals with influenza-related hospitalization resulted in stronger effect sizes for both variants, with the B3GALT5 variant significantly reducing the risk of hospitalization among infected cases; and (3) consistent and often stronger (by effect size) associations were observed with phenotypes that captured recent influenza infection, such as a positive cell culture or serology test for influenza A. Further details on these associations are provided in Supplementary Table 6. Unadjusted P values were derived using Firth regression (two-sided test) implemented in REGENIE. The error bars represent the 95% CI for the OR estimate.
Extended Data Fig. 1
Extended Data Fig. 1. Results from the discovery GWAS of reported influenza infection in the AncestryDNA cohort.
We tested 10 million common (alternate allele frequency [AAF] > 1%) variants, derived from array genotyping followed by HRC imputation, comparing 18,334 individuals who reported a positive test for influenza (cases) against 276,295 individuals who did not report a positive test for influenza (controls). a, Quantile-quantile plot showing observed P-values for individual variants (y-axis) against P-values expected by chance given multiple testing (x-axis). The genomic inflation factor (λGC) of this analysis was 1.05, whereas the intercept from LD-score regression was 1.04. b, Manhattan plot showing association (−log10 P-value) with imputed variants. The dotted grey line demarcates the genome-wide significance threshold of P = 5 × 10−8. c,d, Genetic ancestry-specific results for the 3q27.3/ST6GAL1 (c) and the 21q22.2/B3GALT5 (d) variants. Unadjusted P-values derived from Firth-regression (two-sided test) implemented in REGENIE. Error bars represent the 95% confidence interval around the odds ratio (data point).
Extended Data Fig. 2
Extended Data Fig. 2. Summary of results from the replication GWAS of lifetime medical record-based influenza infection performed across seven biobanks.
We tested 11 million common (AAF > 1%) variants derived from array genotyping followed by TOPMed imputation (except FinnGen, which used an imputation reference panel comprising samples from Finland), comparing 22,022 individuals with (cases) against 1,131,269 individuals without (controls) an ICD-10 code for influenza (controls). a, Quantile-quantile plot showing observed P-values for individual variants (y-axis) against P-values expected by chance given multiple testing (x-axis). The genomic inflation factor (λGC) of this analysis was 1.04, whereas the intercept from LD-score regression was 1.01. b, Manhattan plot showing association (−log10 P-value) with imputed variants. The dotted grey line demarcates the genome-wide significance threshold of P = 5 × 10−8. c,d, Cohort-specific results for the 3q27.3/ST6GAL1 (c) and the 21q22.2/B3GALT5 (d) variants. Unadjusted P-values derived from Firth-regression (two-sided test) implemented in REGENIE. Error bars represent the 95% confidence interval around the odds ratio (data point).
Extended Data Fig. 3
Extended Data Fig. 3. Meta-analysis of the discovery (reported positive test in AncestryDNA) and replication (lifetime medical record across seven biobanks) GWAS of influenza.
a, Quantile-quantile plot showing observed P-values for individual variants (y-axis) against P-values expected by chance given multiple testing (x-axis). The genomic inflation factor (λGC) of this analysis was 1.06, whereas the intercept from LD-score regression was 1.02. b, Manhattan plot showing association ( − log10 P-value) with imputed variants. The dotted grey line demarcates the genome-wide significance threshold of P = 5 × 10−8. c,d, Regional associations plots for the 3q27.3/ST6GAL1 (c) and 21q22.2/B3GALT5 (d) loci. Variants are colored based on their linkage disequilibrium (r2) with the lead variant (purple triangle). Upward facing triangles represent variants with OR > 1, and downward facing triangles represent OR < 1. Unadjusted P-values derived from Firth-regression (two-sided test) implemented in REGENIE.
Extended Data Fig. 4
Extended Data Fig. 4. Association between COVID-19 risk variants and influenza infection in AncestryDNA (18,334 cases vs. 276,295 controls), biobank cohorts (22,022 cases vs. 1,131,269 controls) or overall meta-analysis (40,356 cases vs. 1,407,564 controls).
Of the 24 COVID-19 risk variants, 16 were discovered in a GWAS of COVID-19 hospitalization (comparing COVID-19 hospitalized cases against individuals with no record of SARS-CoV-2 infection), and 8 were discovered in a GWAS of reported SARS-CoV-2 infection (comparing all individuals with a record of SARS-CoV-2 infection against individuals with no record of SARS-CoV-2 infection). The association observed between the 24 variants and influenza infection was comparable between AncestryDNA, biobank cohorts and overall meta-analysis GWAS. Error bars represent the 95% confidence interval around the odds ratio (data point).
Extended Data Fig. 5
Extended Data Fig. 5. Summary of association results between lifetime medical record-based influenza and rare coding variants from exome sequencing in six biobanks (Colorado, DiscovEHR, Mayo-Clinic, UCLA, UKB, UPENN-PMBB).
We tested 23 million rare (AAF < 1%) variants derived from exome sequencing, comparing 14,189 individuals with (cases) against 811,714 individuals without (controls) an ICD10 code for influenza. a,b, Manhattan plots of (a) individual coding variants (each point represents a single variant) and (b) coding variants tested on aggregate through gene burden tests (each point represents a burden test for a gene, with up to 40 different burden tests performed per gene; Methods). The dotted grey line demarcates P = 2.1 × 10−9 (corresponding to a Bonferroni correction for the number of individual variant and gene-based burden tests performed). Unadjusted P-values derived from Firth-regression (two-sided test) implemented in REGENIE.
Extended Data Fig. 6
Extended Data Fig. 6. Expression of ST6GAL1 and B3GALT5 across human tissues measured by the GTEx consortium.
a, Expression levels expressed as transcripts per million (TPM) per tissue in GTEx for ST6GAL1. Box plots show the interquartile range (ICR) and the median. Sample sizes for each tissue can be found on the GTEx website (see Data Availability). b, Association between rs73187789:A and expression levels of ST6GAL1 across tissues. Variant rs73187789 was a lead independent eQTL for ST6GAL1 in thyroid tissue and was in high LD (r2 = 0.95) with the lead variant associated with risk of influenza in ST6GAL1. Error bars represent the 95% confidence interval around the normalized effect size (NES) from linear regression. c, Expression levels expressed as TPM per tissue in GTEx for B3GALT5. Box plots show the ICR and the median. Sample sizes for each tissue can be found on the GTEx website (see Data Availability).
Extended Data Fig. 7
Extended Data Fig. 7. Impact of siRNA knockdown of ST6GAL1 in A549 cells on influenza infectivity.
In each plot, bars represent the averages across replicates from each experiment (n = 2), points represent the values from the individual replicates (n = 4 for experiment 1; n = 3 for experiment 2), and lines show the width of the distribution of the data points. The first column shows mRNA levels of ST6GAL1 relative to ACTB transcript in cells treated with four different siRNAs: two targeting ST6GAL1 (siRNA1 and siRNA2) and two negative controls (one targeting GAPDH [experiment 2 only] and a scrambled siRNA). The second and third columns show results from infection assay with PR8-GFP (H1N1, multiplicity of infection [MOI] of 0.4 to 10), with the latter column showing infectivity relative to the scrambled siRNA control. The GAPDH siRNA (but not the two siRNAs against ST6GAL1) significantly reduced GAPDH expression relative to the scrambled siRNA ( ~ 80% reduction). P-values derived from a two-sided Wilcoxon Rank Sum Test and asterisks (*) mark those experiments with P < 0.05.
Extended Data Fig. 8
Extended Data Fig. 8. Impact of ST6GAL1 siRNA knockdown on sialic acid abundance.
a, Flow cytometry histograms (geometric mean across three replicates) of siRNA-transfected cells stained with FITC-conjugated S. Nigra (SNA) Lectin 72 hours post-transfection to measure membrane-level sialic acid. A small proportion of cells treated with ST6GAL1 siRNAs displayed high fluorescence levels, consistent with incomplete transfection. b, Bar graph showing mean fluorescence intensity at the maximum from histogram in a. Bars represent the average across replicates from three experiments, points represent values from the individual replicates, and lines show the width of the distribution of individual experiments. In comparison to the negative control, membrane-level sialic acid dropped by 79–92% after ST6GAL1 knockdown. c,d, Representative images of ST6GAL1 and GAPDH protein levels measured in A549 cells 72 hours after treatment with siRNAs at concentration 5 to 40 μM (c) and at the final selected concentration of 10 μM (d). e, Quantification of ST6GAL1 and GAPDH protein levels in A549 cells treated with 10 μM of ST6GAL1 siRNA, based on three individual replicates. Protein levels are normalized to beta-actin and shown relative to the negative control siRNA. Uncropped gels are provided as Source Data. P-values derived from a two-sided Wilcoxon Rank Sum Test and asterisks (*) mark those experiments with P < 0.05. Source data
Extended Data Fig. 9
Extended Data Fig. 9. Impact of B3GALT5 siRNA knockdown on influenza infectivity in Calu-3 cells.
In each plot, bars represent the averages across replicates from each experiment (n = 2), points represent the values from the individual replicates (n = 3), and lines show the width of the distribution of the data points. The first column shows mRNA levels of B3GALT5 relative to ACTB transcript in cells treated with four different siRNAs: two targeting B3GALT5 (siRNA1 and siRNA2) and two negative controls (one targeting GAPDH and a scrambled siRNA). The second and third columns show results from infection assay with PR8-GFP (H1N1, multiplicity of infection [MOI] of 0.4 to 10), with the latter column showing infectivity relative to the scrambled siRNA control. The GAPDH siRNA (but not the two siRNAs against B3GALT5) significantly reduced GAPDH expression relative to the scrambled siRNA (~90% reduction). P-values derived from a two-sided Wilcoxon Rank Sum Test and asterisks (*) mark those experiments with P < 0.05.

Similar articles

Cited by

References

    1. Guan, W.-J. et al. Clinical characteristics of coronavirus disease 2019 in China. N. Engl. J. Med.382, 1708–1720 (2020). 10.1056/NEJMoa2002032 - DOI - PMC - PubMed
    1. Pathak, G. A. et al. A first update on mapping the human genetic architecture of COVID-19. Nature608, E1–E10 (2022). 10.1038/s41586-022-04826-7 - DOI - PMC - PubMed
    1. Garcia-Etxebarria, K. et al. No major host genetic risk factor contributed to A(H1N1)2009 influenza severity. PLoS ONE10, e0135983 (2015). 10.1371/journal.pone.0135983 - DOI - PMC - PubMed
    1. Zhou, J. et al. A functional variation in CD55 increases the severity of 2009 pandemic H1N1 influenza A virus infection. J. Infect. Dis.206, 495–503 (2012). 10.1093/infdis/jis378 - DOI - PubMed
    1. Zhou, J. et al. Identification and characterization of GLDC as host susceptibility gene to severe influenza. EMBO Mol. Med.11, e9528 (2019). 10.15252/emmm.201809528 - DOI - PMC - PubMed