

The influence of air masses on human mortality in the contiguous United States
- PMID: 39103651
- PMCID: PMC11519110
- DOI: 10.1007/s00484-024-02745-y
The influence of air masses on human mortality in the contiguous United States
Abstract
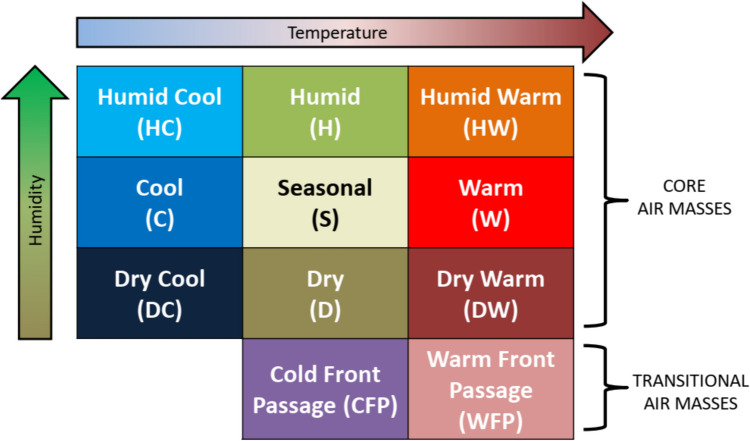
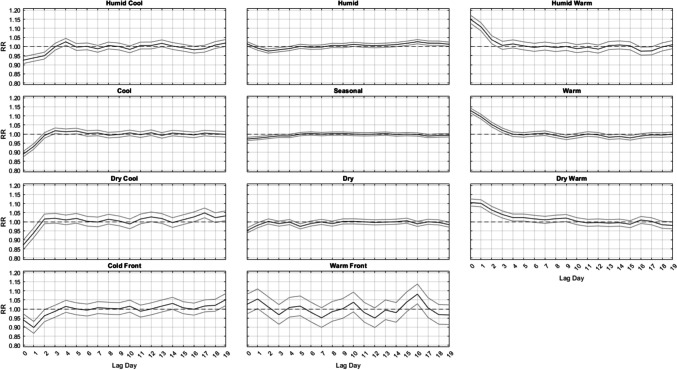
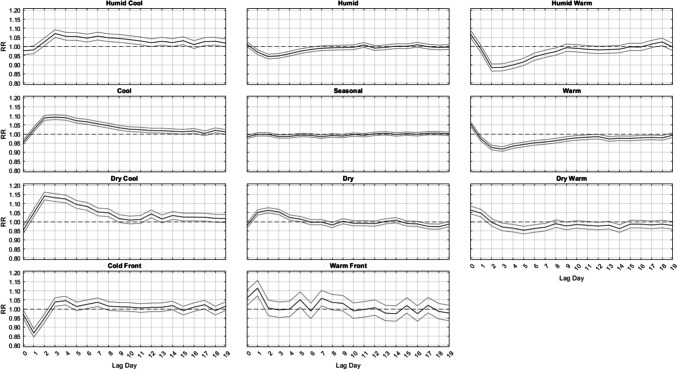
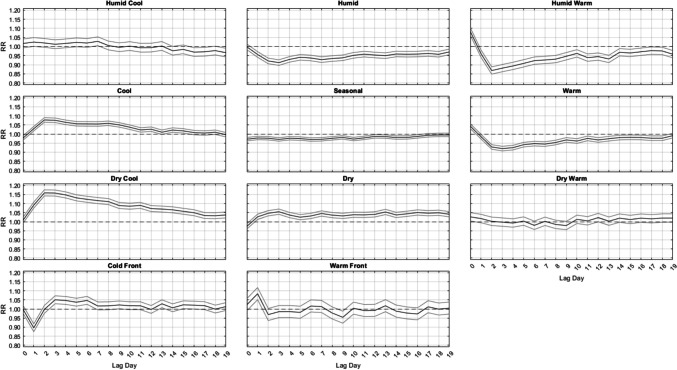
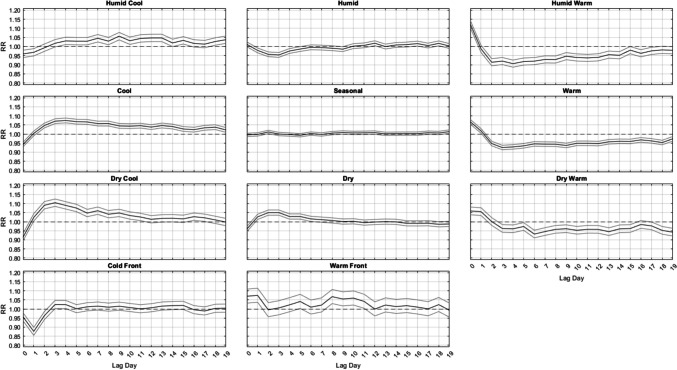
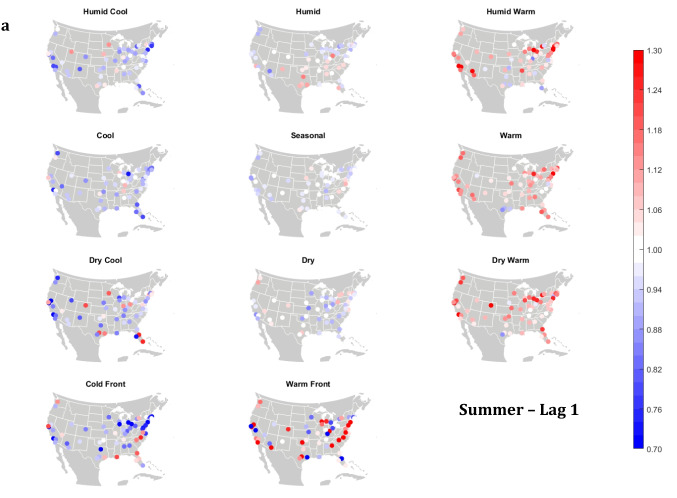
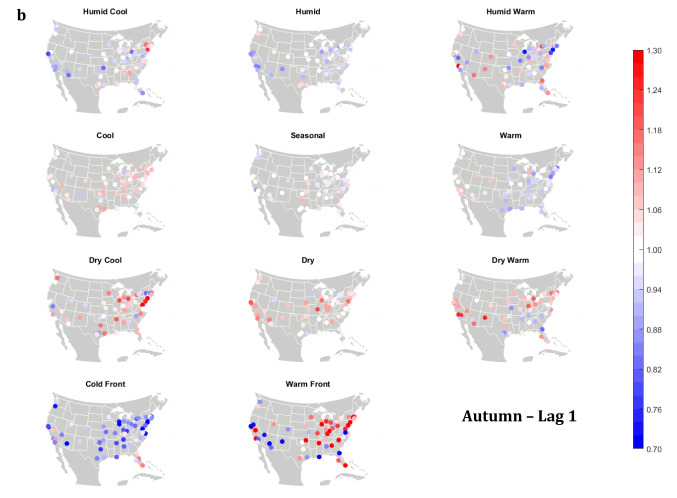
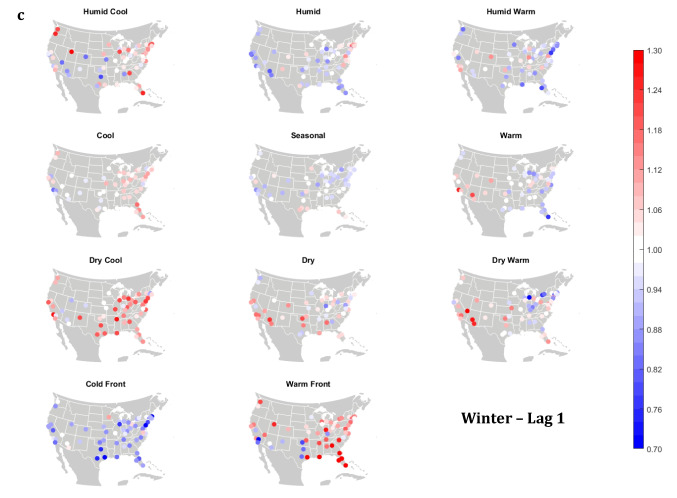
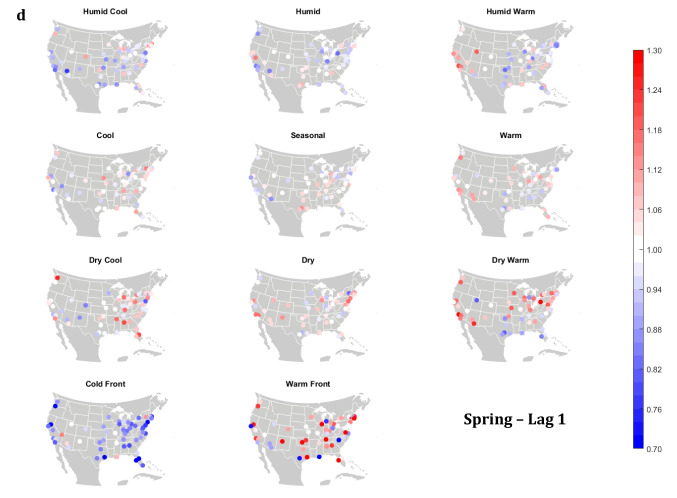
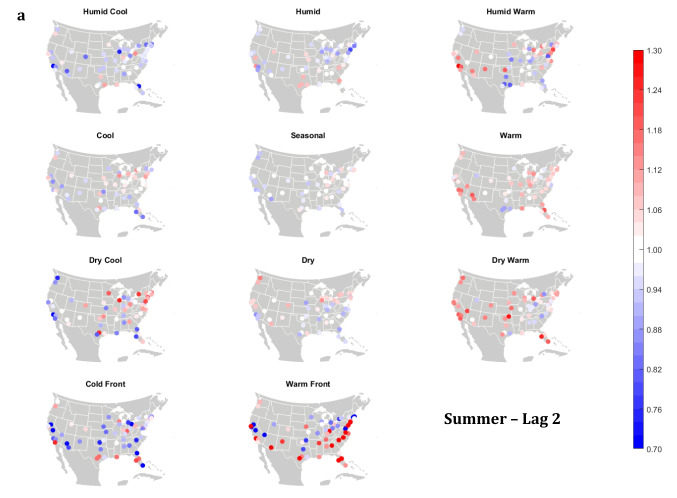
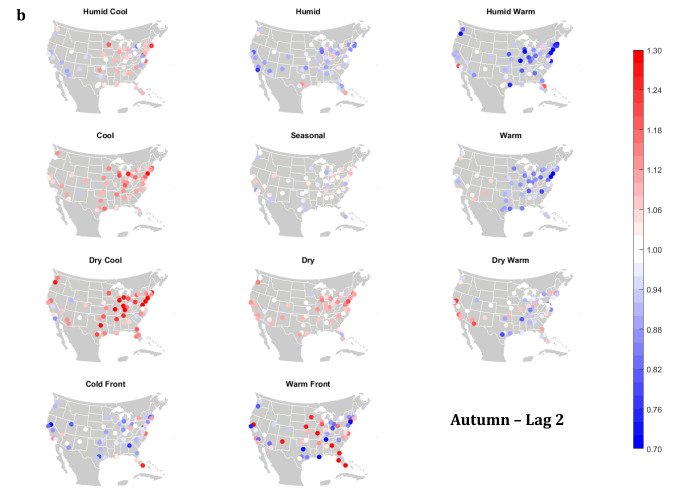
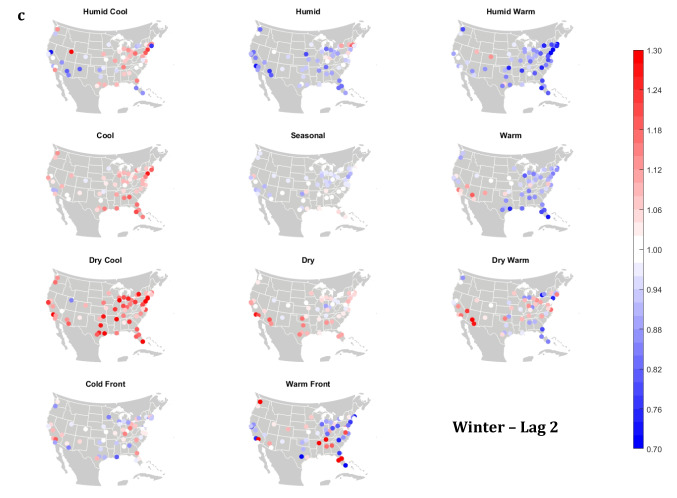
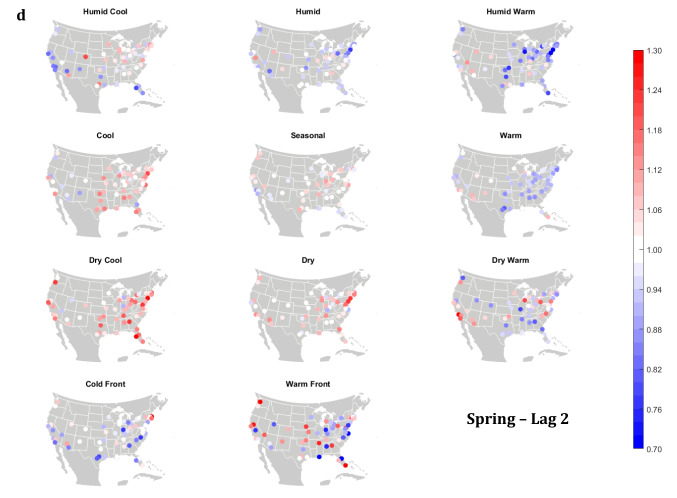
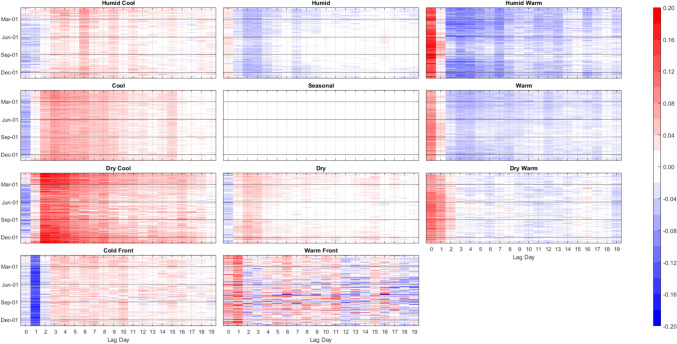
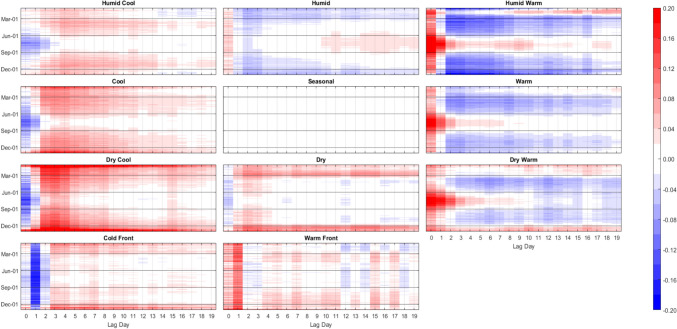
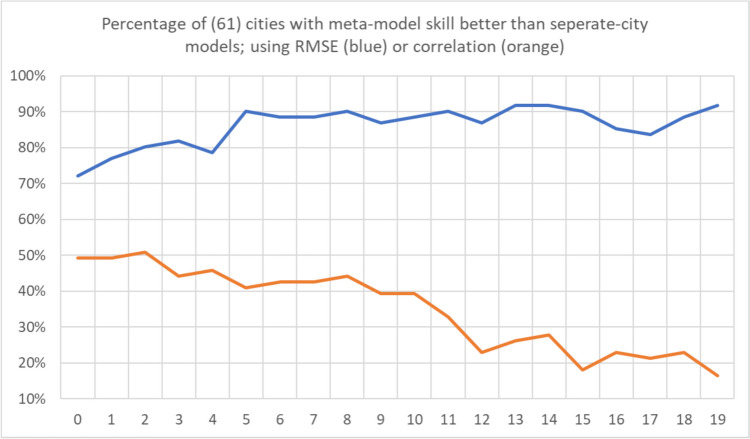
Temperature-related mortality is the leading cause of weather-related deaths in the United States. Herein, we explore the effect of air masses (AMs) - a relatively novel and holistic measure of environmental conditions - on human mortality across 61 cities in the United States. Geographic and seasonal differences in the effects of each AM on deseasonalized and detrended anomalous lagged mortality are examined using simple descriptive statistics, one-way analyses of variance, relative risks of excess mortality, and regression-based artificial neural network (ANN) models. Results show that AMs are significantly related to anomalous mortality in most US cities, and in most seasons. Of note, two of the three cool AMs (Cool and Dry-Cool) each show a strong, but delayed mortality response in all seasons, with peak mortality 2 to 4 days after they occur, with the Dry-Cool AM having nearly a 15% increased risk of excess mortality. Humid-Warm (HW) air masses are associated with increases in deaths in all seasons 0 to 1 days after they occur. In most seasons, these near-term mortality increases are offset by reduced mortality for 1-2 weeks afterwards; however, in summer, no such reduction is noted. The Warm and Dry-Warm AMs show slightly longer periods of increased mortality, albeit slightly less intensely as compared with HW, but with a similar lag structure by season. Meanwhile, the most seasonally consistent results are with transitional weather, whereby passing cold fronts are associated with a significant decrease in mortality 1 day after they occur, while warm fronts are associated with significant increases in mortality at that same lag time. Finally, ANN modeling reveals that AM-mortality relationships gleaned from a combined meta-analysis can actually lead to more skillful modeling of these relationships than models trained on some individual cities, especially in the cities where such relationships might be masked due to low average daily mortality.
Keywords: Artificial Neural Networks; Human Mortality; Synoptic Climatology.
© 2024. The Author(s).
Figures
Similar articles
-
A systematic evaluation of the lagged effects of spatiotemporally relative surface weather types on wintertime cardiovascular-related mortality across 19 US cities.Int J Biometeorol. 2015 Nov;59(11):1633-45. doi: 10.1007/s00484-015-0970-5. Epub 2015 Feb 25. Int J Biometeorol. 2015. PMID: 25711484
-
Multicity study of air pollution and mortality in Latin America (the ESCALA study).Res Rep Health Eff Inst. 2012 Oct;(171):5-86. Res Rep Health Eff Inst. 2012. PMID: 23311234
-
[Meta-analysis of the Italian studies on short-term effects of air pollution].Epidemiol Prev. 2001 Mar-Apr;25(2 Suppl):1-71. Epidemiol Prev. 2001. PMID: 11515188 Italian.
-
Effects of short-term exposure to air pollution on hospital admissions of young children for acute lower respiratory infections in Ho Chi Minh City, Vietnam.Res Rep Health Eff Inst. 2012 Jun;(169):5-72; discussion 73-83. Res Rep Health Eff Inst. 2012. PMID: 22849236
-
Cool and dry weather enhances the effects of air pollution on emergency IHD hospital admissions.Int J Cardiol. 2013 Sep 20;168(1):500-5. doi: 10.1016/j.ijcard.2012.09.199. Epub 2012 Oct 15. Int J Cardiol. 2013. PMID: 23079091
References
-
- Allan RP, Hawkins Ed, Bellouin N, Collins B (2021) IPCC, 2021: summary for Policymakers. 3–32
-
- Allen MJ, Lee CC (2014) Investigating high mortality during the cold season: mapping mean weather patterns of temperature and pressure. Theoret Appl Climatol 118:419–428
MeSH terms
LinkOut - more resources
Full Text Sources
