

Evaluating tissue hypoxia and the response to fluid administration in septic shock patients: a metabolic cluster analysis
- PMID: 39103769
- PMCID: PMC11299339
- DOI: 10.1186/s12871-024-02662-y
Evaluating tissue hypoxia and the response to fluid administration in septic shock patients: a metabolic cluster analysis
Abstract
Background: The selection of adequate indicators of tissue hypoxia for guiding the resuscitation process of septic patients is a highly relevant issue. Current guidelines advocate for the use of lactate as sole metabolic marker, which may be markedly limited, and the integration of different variables seems more adequate. In this study, we explored the metabolic profile and its implications in the response to the administration of a fluid challenge in early septic shock patients.
Methods: Observational study including septic shock patients within 24 h of ICU admission, monitored with a cardiac output estimation system, with ongoing resuscitation. Hemodynamic and metabolic variables were measured before and after a fluid challenge (FC). A two-step cluster analysis was used to define the baseline metabolic profile, including lactate, central venous oxygen saturation (ScvO2), central venous-to-arterial carbon dioxide difference (PcvaCO2), and PcvaCO2 corrected by the difference in arterial-to-venous oxygen content (PcvaCO2/CavO2).
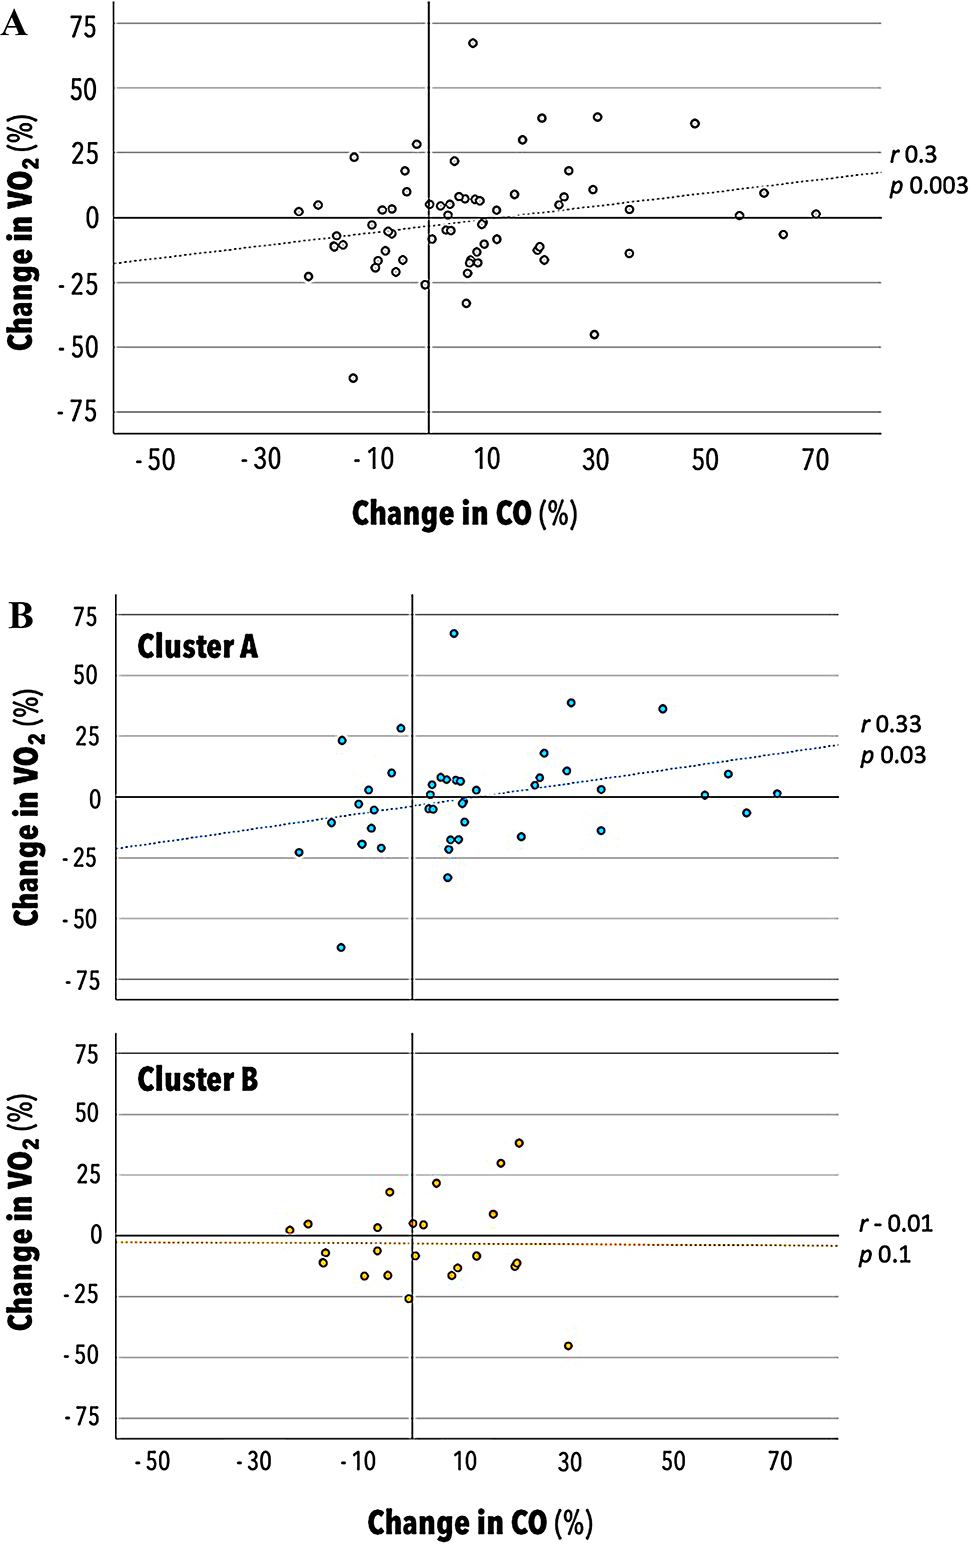
Results: Seventy-seven fluid challenges were analyzed. Cluster analysis revealed two distinct metabolic profiles at baseline. Cluster A exhibited lower ScvO2, higher PcvaCO2, and lower PcvaCO2/CavO2. Increases in cardiac output (CO) were associated with increases in VO2 exclusively in cluster A. Baseline isolated metabolic variables did not correlate with VO2 response, and changes in ScvO2 and PcvaCO2 were associated to VO2 increase only in cluster A.
Conclusions: In a population of early septic shock patients, two distinct metabolic profiles were identified, suggesting tissue hypoxia or dysoxia. Integrating metabolic variables enhances the ability to detect those patients whose VO2 might increase as results of fluid administration.
Keywords: Circulatory shock; Fluid responsiveness; Hemodynamic monitoring; Lactate; Venous oxygen saturation; Venous-to-arterial carbon dioxide difference.
© 2024. The Author(s).
Conflict of interest statement
Competing interests. The authors declare no competing interests.
Figures


References
-
- Haupt MT, Gilbert EM, Carlson RW. Fluid loading increases oxygen consumption in septic patients with lactic acidosis. Am Rev Respir Dis. 1985;131(6):912–6. - PubMed
Publication types
MeSH terms
Substances
LinkOut - more resources
Full Text Sources
