Observational Study
. 2024 Aug 5;28(1):263.
doi: 10.1186/s13054-024-05046-3.

Phenotyping COVID-19 respiratory failure in spontaneously breathing patients with AI on lung CT-scan

Collaborators, Affiliations
Observational Study

Phenotyping COVID-19 respiratory failure in spontaneously breathing patients with AI on lung CT-scan

Emanuele Rezoagli et al. Crit Care. .

Abstract

Background: Automated analysis of lung computed tomography (CT) scans may help characterize subphenotypes of acute respiratory illness. We integrated lung CT features measured via deep learning with clinical and laboratory data in spontaneously breathing subjects to enhance the identification of COVID-19 subphenotypes.

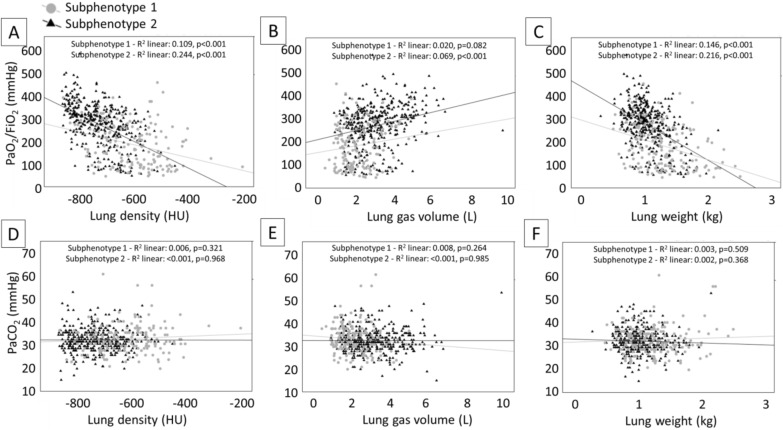
Methods: This is a multicenter observational cohort study in spontaneously breathing patients with COVID-19 respiratory failure exposed to early lung CT within 7 days of admission. We explored lung CT images using deep learning approaches to quantitative and qualitative analyses; latent class analysis (LCA) by using clinical, laboratory and lung CT variables; regional differences between subphenotypes following 3D spatial trajectories.

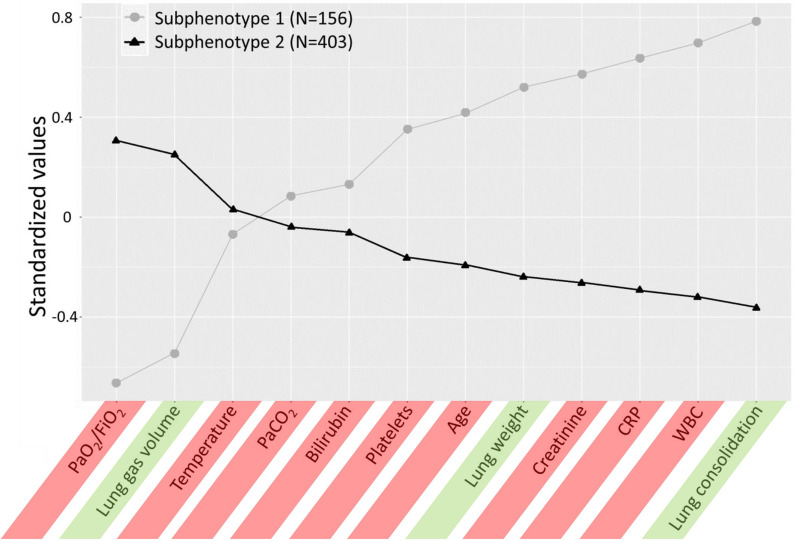
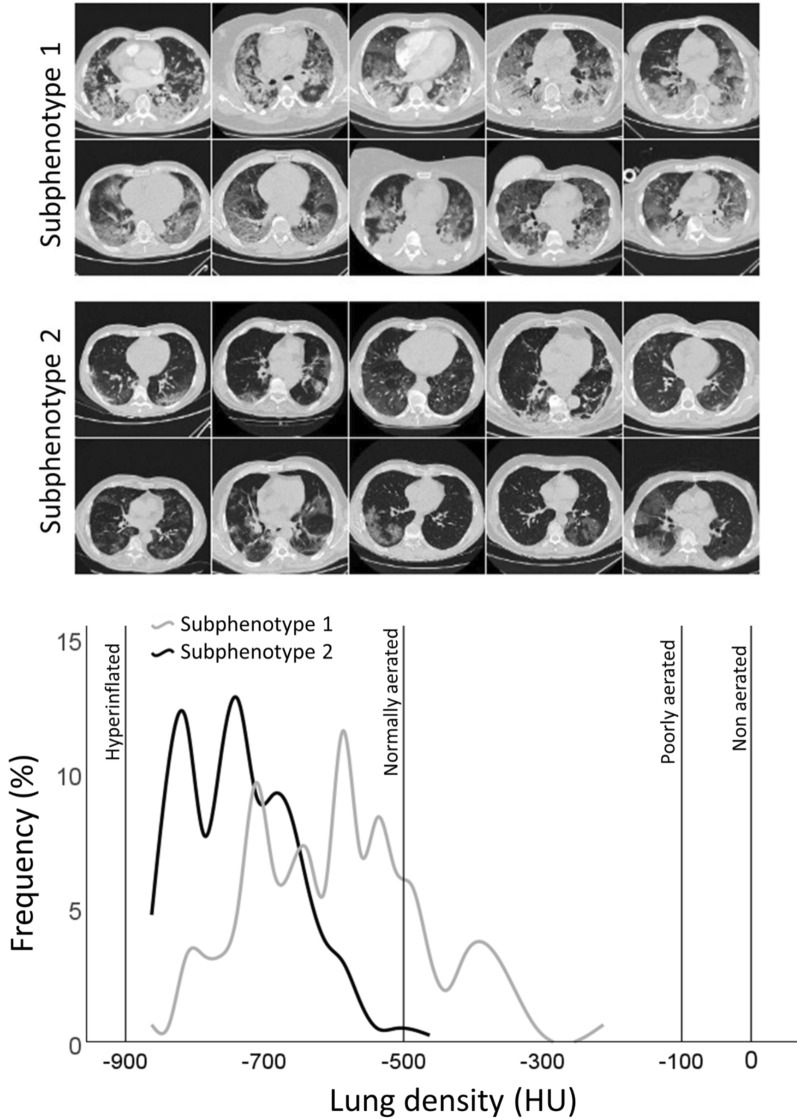
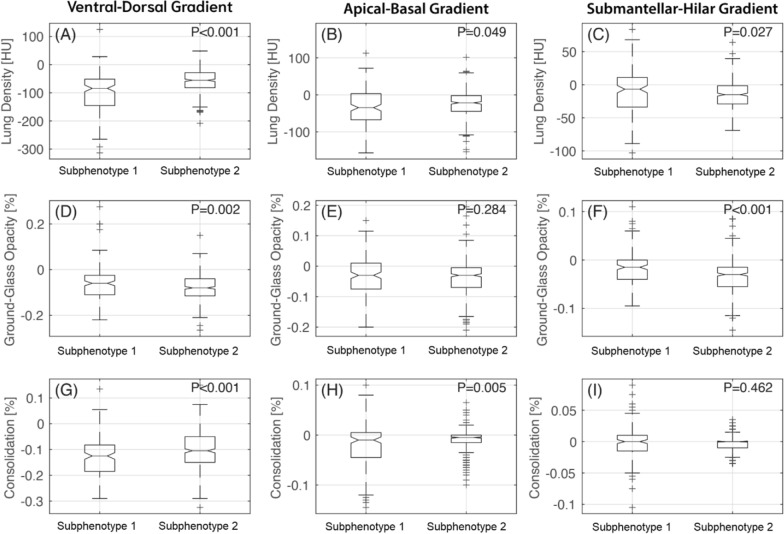
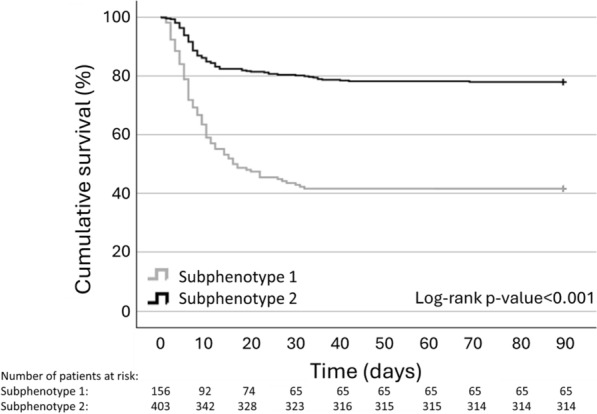
Results: Complete datasets were available in 559 patients. LCA identified two subphenotypes (subphenotype 1 and 2). As compared with subphenotype 2 (n = 403), subphenotype 1 patients (n = 156) were older, had higher inflammatory biomarkers, and were more hypoxemic. Lungs in subphenotype 1 had a higher density gravitational gradient with a greater proportion of consolidated lungs as compared with subphenotype 2. In contrast, subphenotype 2 had a higher density submantellar-hilar gradient with a greater proportion of ground glass opacities as compared with subphenotype 1. Subphenotype 1 showed higher prevalence of comorbidities associated with endothelial dysfunction and higher 90-day mortality than subphenotype 2, even after adjustment for clinically meaningful variables.

Conclusions: Integrating lung-CT data in a LCA allowed us to identify two subphenotypes of COVID-19, with different clinical trajectories. These exploratory findings suggest a role of automated imaging characterization guided by machine learning in subphenotyping patients with respiratory failure.

Trial registration: ClinicalTrials.gov Identifier: NCT04395482. Registration date: 19/05/2020.

Keywords: Artificial intelligence; COVID-19; Computed tomography; Latent class analysis; Respiratory failure; Subphenotypes.


Conflict of interest statement

The authors declare no competing interests.

Figures

Fig. 1
Fig. 1
Differences in standardized values of each continuous variable by LCA derived subphenotypes. The variables are sorted based on the degree of separation between the subphenotypes, from maximum positive separation on the left (i.e., subphenotype 2 higher than subphenotype 1) to maximum negative separation on the right (i.e., subphenotype 2 lower than subphenotype 1). The y-axis describes the standardized variable values, in which all means are scaled to zero and standard deviations (SDs) to one. A value of + 1 for the investigated standardized variable means that the mean value for a given subphenotype was one SD higher than the mean value in the cohort as a whole. Mean values are joined by lines to facilitate displaying subphenotype profiles. Variables included to investigate LCA derived subphenotypes are highlighted in green (CT-derived features) and red (clinical and laboratory parameters). WBC white blood cells, CRP C-reactive protein, PaCO2 arterial carbon dioxide partial pressure, PaO2/FiO2 ratio of arterial oxygen partial pressure to fractional inspired oxygen
Fig. 2
Fig. 2
Ten representative images of lung CT scan images in the subphenotype 1 (upper panel) and subphenotype 2 (middle panel). In the lower panel, different lung cumulative density distribution measured with CT X-rays attenuation of the whole lung between the two subphenotypes. Interpolation lines are displayed to reduce frequency oscillation. Mean lung density < − 900 HU: Hyperinflated; − 900 HU ≤ Mean lung density < − 500 HU: normally aerated; − 500 HU ≤ Mean lung density < − 100 HU: poorly aerated; Mean lung density ≥ − 100 HU ≤ 0 HU: non aerated. HU hounsfield units
Fig. 3
Fig. 3
Box and whisker plots of mean lung density, ground glass opacities, and consolidation distribution in subphenotype 1 and subphenotype 2 across 3 different gradients of lung injury. Ventro-dorsal gradient (panel A, D and G); apical–basal gradient (panel B, E and H); and submantellar–hilar gradient (panel C, F and I)
Fig. 4
Fig. 4
Correlation between CT derived parameters and gas exchange. Panel A: correlation between mean lung density and PaO2/FiO2; panel B: correlation between lung gas volume and PaO2/FiO2; panel C: correlation between lung weight and PaO2/FiO2; panel D: correlation between mean lung density and PaCO2; panel E: correlation between lung gas volume and PaCO2; panel F: correlation between lung weight and PaCO2. HU hounsfield units, PaO2/FiO2 ratio of arterial oxygen partial pressure to fractional inspired oxygen, PaCO2 arterial carbon dioxide partial pressure
Fig. 5
Fig. 5
Survival at 90-day follow-up by Kaplan–Meier curves in the 2 different classes of subphenotypes

References

    1. Seymour CW, Kennedy JN, Wang S, Chang C-CH, Elliott CF, Xu Z, et al. Derivation, validation, and potential treatment implications of novel clinical phenotypes for sepsis. JAMA. 2019;321(20):2003–17. 10.1001/jama.2019.5791 - DOI - PMC - PubMed
    1. Shah FA, Meyer NJ, Angus DC, Awdish R, Azoulay É, Calfee CS, et al. A research agenda for precision medicine in sepsis and acute respiratory distress syndrome: an official American Thoracic Society Research statement. Am J Respir Crit Care Med. 2021;204(8):891–901. 10.1164/rccm.202108-1908ST - DOI - PMC - PubMed
    1. Vaara ST, Bhatraju PK, Stanski NL, McMahon BA, Liu K, Joannidis M, et al. Subphenotypes in acute kidney injury: a narrative review. Crit Care. 2022;26(1):251. 10.1186/s13054-022-04121-x - DOI - PMC - PubMed
    1. Reilly JP, Calfee CS, Christie JD. Acute respiratory distress syndrome phenotypes. Semin Respir Crit Care Med. 2019;40(1):19–30. 10.1055/s-0039-1684049 - DOI - PMC - PubMed
    1. Famous KR, Delucchi K, Ware LB, Kangelaris KN, Liu KD, Thompson BT, et al. Acute respiratory distress syndrome subphenotypes respond differently to randomized fluid management strategy. Am J Respir Crit Care Med. 2017;195(3):331–8. 10.1164/rccm.201603-0645OC - DOI - PMC - PubMed

Publication types

Associated data