. 2025 Jun 1;20(6):1776-1788.
doi: 10.4103/NRR.NRR-D-23-01051. Epub 2024 Jan 31.

Hydrogen sulfide reduces oxidative stress in Huntington's disease via Nrf2

Affiliations

Hydrogen sulfide reduces oxidative stress in Huntington's disease via Nrf2

Zige Jiang et al. Neural Regen Res. .

Abstract

JOURNAL/nrgr/04.03/01300535-202506000-00028/figure1/v/2024-08-05T133530Z/r/image-tiff The pathophysiology of Huntington's disease involves high levels of the neurotoxin quinolinic acid. Quinolinic acid accumulation results in oxidative stress, which leads to neurotoxicity. However, the molecular and cellular mechanisms by which quinolinic acid contributes to Huntington's disease pathology remain unknown. In this study, we established in vitro and in vivo models of Huntington's disease by administering quinolinic acid to the PC12 neuronal cell line and the striatum of mice, respectively. We observed a decrease in the levels of hydrogen sulfide in both PC12 cells and mouse serum, which was accompanied by down-regulation of cystathionine β-synthase, an enzyme responsible for hydrogen sulfide production. However, treatment with NaHS (a hydrogen sulfide donor) increased hydrogen sulfide levels in the neurons and in mouse serum, as well as cystathionine β-synthase expression in the neurons and the mouse striatum, while also improving oxidative imbalance and mitochondrial dysfunction in PC12 cells and the mouse striatum. These beneficial effects correlated with upregulation of nuclear factor erythroid 2-related factor 2 expression. Finally, treatment with the nuclear factor erythroid 2-related factor 2 inhibitor ML385 reversed the beneficial impact of exogenous hydrogen sulfide on quinolinic acid-induced oxidative stress. Taken together, our findings show that hydrogen sulfide reduces oxidative stress in Huntington's disease by activating nuclear factor erythroid 2-related factor 2, suggesting that hydrogen sulfide is a novel neuroprotective drug candidate for treating patients with Huntington's disease.


Conflict of interest statement

Conflicts of interest: There are no competing financial interests.

Figures

Figure 1
Figure 1
Enhanced expression of H2S-producing enzymes and elevated hydrogen sulfide levels in response to NaHS treatment. (A) A CCK8 kit was used to detect the viability of PC12 cells treated with varying doses of Quin (n = 10 per group). (B) PC12 cell viability was detected utilizing the CCK8 kit following treatment with Quin for 6, 12, or 24 hours (n = 10 per group). (C) The viability of PC12 cells stimulated by Quin was evaluated using a CCK8 kit following treatment with different concentrations of NaHS (n = 10 per group). (D) The viability of PC12 cells stimulated by Quin and NaHS following treatment with varying doses of ML385 was assessed using a CCK8 kit (n = 10 per group). (E) An endogenous H2S assay kit was employed to determine the H2S content of PC12 cells (n = 6 per group). (F) PC12 cells were treated with Quin for 24 hours, and CBS, 3-MST, and DAO expression levels were determined by western blot (n = 3 per group). (G) The serum H2S content was determined using an endogenous H2S assay kit (n = 6 per group). (H) Six days after administration of Quin into the striatum, western blot analysis was employed to quantify CBS, 3-MST, and DAO levels in the mouse striatum (n = 3 per group). (I) Western blot detection of CBS expression levels in PC12 cells. Quantification of CBS expression level (n = 3 per group). (J) Western blot detection of striatum CBS levels in each group. Quantification of CBS expression level (n = 3 per group). The values are reported as mean ± SD. *P < 0.05, **P < 0.01, ***P < 0.001 (one-way analysis of variance followed with Dunnett’s correction (A, C, D), two-tailed Student’s t-test (B) or one-way analysis of variance followed by Bonferroni post hoc test (E–J). 3-MST: 3-Mercaptopyruvate sulfurtransferase; CBS: cystathionine-β-synthase; CCK8: cell counting kit 8; DAO: D-amino acid oxidase; H2S: hydrogen sulfide; Quin: quinolinic acid.
Figure 2
Figure 2
NaHS improves Quin-induced neurobehavioral impairment. (A) In vivo experimental design and timeline. (B) Successful injection of Quin into the striatum of mice was demonstrated using FITC dye. Scale bar: 200 μm. Created with BioRender.com. (C) Effects of NaHS and ML385 on mouse survival after Quin injection into the striatum. (D, E) Behavioral outcomes were assessed by forelimb suspension (D) and geotaxis reflex (E) tests at 2 and 6 days after striatal injection (2 days: n = 12 per group; 6 days: n = 10 per group). (F) The total distance traveled in the open field test was measured 6 days following administration of Quin (n = 13 per group). (G) The crossing number in the open field test was determined 6 days following administration of Quin (n = 13 per group). The values are reported as mean ± SD. *P < 0.05, ***P < 0.001 (one-way analysis of variance followed by Bonferroni post hoc test). (H) Representative paths of mice in the OFT. FITC: Fluorescein isothiocyanate; OFT: open filed test; Quin: quinolinic acid.
Figure 3
Figure 3
NaHS improves Quin-induced histological impairment. (A) Representative Nissl staining results for each experimental group. The Quin + NaHS group exhibited significantly less striatal tissue damage compared with the Quin group. Compared with the Quin + NaHS group, the Quin + NaHS + ML385 group exhibited a significant reduction in the number of Nissl+ cells and increased damage in the striatum. Scale bars: 500 μm. (A1, A2) Enlarged views of the red-outlined boxes in A. Scale bar: 50 μm. (B) The extent of striatal tissue loss in each group was quantitatively analyzed. The values are reported as mean ± SD from nine coronal sections in three mice per group. ***P < 0.001 (one-way analysis of variance followed by Bonferroni post hoc test). Quin: Quinolinic acid.
Figure 4
Figure 4
NaHS inhibits Quin-induced cell apoptosis. (A) In vitro experimental design and timeline. (B) Representative TUNEL staining images of Quin-stimulated PC12 cells from each group at 24 hours. Compared with the Sham group, the Quin group exhibited more apoptotic (TUNEL+) cells. Compared with the Quin group, the Quin + NaHS group exhibited a smaller number of apoptotic cells, and this effect was reversed by the addition of ML385. Scale bar: 50 μm. (C) Quantification of TUNEL+ cells from 15 fields of view from five slides per group. (D) TUNEL staining of mouse striatum tissue. The number of apoptotic (TUNEL+) cells in the striatum of mice in the Quin group was higher compared with the Sham group. The Quin + NaHS group exhibited a smaller number of apoptotic cells than the Quin group, and this effect was reversed by the addition of ML385. Scale bar: 500 μm. (E) Quantification of TUNEL+ cells from nine coronal sections in three mice per group. The values are reported as mean ± SD. ***P < 0.001 (one-way analysis of variance followed by Bonferroni post hoc test). DAPI: 4,6-Diamidino-2-phenylindole; Quin: quinolinic acid; TUNEL: eoxynucleotidyl transferase (TdT)-mediated deoxyuridine triphosphate (dUTP) nick-end labeling.
Figure 5
Figure 5
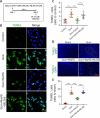
Treatment with NaHS inhibits the dysregulation of neuroplasticity induced by Quin. (A, B) Immunofluorescence images showing colocalization of PSD95 (red, CoraLite594 fluorescent dye) and NeuN (green, CoraLite488 fluorescent dye) in nine coronal sections from three mice per group. PSD95 expression was significantly upregulated in neuronal cells in the Quin + NaHS group compared with the Quin group, and this effect was reversed by the addition of ML385. Scale bar: 20 μm. (C) Western blot was used to measure PSD95, SYT1, and Syn expression levels 6 days after Quin striatal injection. Quantification of PSD95, SYT1, and Syn expression levels (n = 3 per group). The values are reported as mean ± SD. ***P < 0.001 (one-way analysis of variance followed by Bonferroni post hoc test). NeuN: Neuronal nuclei; PSD95: postsynaptic density protein 95; Quin: quinolinic acid; Syn: synaptophysin; SYT1: synaptotagmin 1.
Figure 6
Figure 6
NaHS reduces oxidative stress by suppressing Nrf2. (A) Representative images of DCFHDA staining in PC12 cells treated with Quin for 24 hours. The Quin group exhibited greater DCFH-DA (green) fluorescence than the Sham group. The Quin + NaHS group exhibited a decrease in DCFHDA (green) fluorescence compared with the Quin group, while an increase was observed in the Quin + NaHS + ML385 group. Scale bar: 50 μm. (B) DHE staining of PC12 cells following 24-hour Quin stimulation. Stronger DHE (red) fluorescence was observed in the Quin group compared with the Sham group. DHE (red) fluorescence was decreased in the Quin + NaHS group and increased in the Quin + NaHS + ML385 group compared with the Quin group. Scale bar: 50 μm. (C) DCFH-DA fluorescence intensity in PC12 cells was quantified using a fluorescence microplate reader (n = 5 per group). (D) DHE fluorescence intensity in PC12 cells was quantified using a fluorescence microplate reader (n = 5 per group). (E) DCFHDA fluorescence intensity in the striatum was quantified using a fluorescence microplate reader (n = 5 per group). (F) Western blot detection of Nrf2 and HO-1 expression levels in PC12 cells in each group. Quantification of Nrf2 and HO-1 expression levels (n = 3 per group). (G) Western blot detection of Nrf2 and HO-1 expression levels in the striatum of mice in each group. Quantification of Nrf2 and HO-1 expression levels (n = 3 per group). The values are reported as mean ± SD. *P < 0.05, **P < 0.01, ***P < 0.001 (one-way analysis of variance followed by Bonferroni post hoc test). DCFHDA: 2′,7′-Dichlorodihydrofluorescein diacetate; DHE: dihydroethidium; HO-1: heme oxygenase-1; Nrf2: nuclear factor erythroid 2-related factor 2; Quin: quinolinic acid.
Figure 7
Figure 7
NaHS regulates mitochondrial function in Quin-stimulated PC12 cells by suppressing Nrf2. (A) Mitochondria stained with MitoTracker (red) in Quin-stimulated PC12 cells treated with NaHS and ML385. The Quin group exhibited severe mitochondrial fragmentation and a decrease in mitochondrial fluorescence intensity compared with the Sham group, whereas the addition of NaHS resulted in an increase in mitochondrial fluorescence intensity. However, this effect was reversed by the addition of ML385. Scale bar: 10 μm. (B) Quantification of mitochondrial fluorescence intensity (n = 10 per group). (C) Representative micrographs of MMP in Quin-stimulated PC12 cells, as detected via JC-1. The transition from green to red fluorescence indicates mitochondrial polarization, which was restored to normal levels by NaHS treatment. In contrast, ML385 treatment induced a shift from green to red fluorescence, indicating substantial mitochondrial depolarization. Scale bar: 50 μm. (D) Quantification of mitochondrial MMP (n = 15 per group). (E) Quantification of mitochondrial DNA (mtDNA, NADH5) versus nuclear DNA (GAPDH) as detected by real-time polymerase chain reaction in Quin-stimulated PC12 cells treated with NaHS and ML385. (F) Western blot detection of TOMM20 expression levels in PC12 cells. Quantification of TOMM20 expression (n = 3 per group). The values are reported as mean ± SD. **P < 0.01, ***P < 0.001 (one-way analysis of variance followed by Bonferroni post hoc test). GAPDH: Glyceraldehyde-3-phosphate dehydrogenase; MMP: mitochondrial membrane potential; Quin: quinolinic acid; TOMM20: translocase of outer mitochondrial membrane 20.

References

    1. Bains M, Kaur J, Akhtar A, Kuhad A, Sah SP. Anti-inflammatory effects of ellagic acid and vanillic acid against quinolinic acid-induced rat model of Huntington’s disease by targeting IKK-NF-κB pathway. Eur J Pharmacol. 2022;934:175316. - PubMed
    1. Bansal Y, Singh R, Parhar I, Kuhad A, Soga T. Quinolinic acid and nuclear factor erythroid 2-related factor 2 in depression: role in neuroprogression. Front Pharmacol. 2019;10:452. - PMC - PubMed
    1. Bełtowski J. Hypoxia in the renal medulla: implications for hydrogen sulfide signaling. J Pharmacol Exp Ther. 2010;334:358–363. - PubMed
    1. Bhat A, Tan V, Heng B, Chow S, Basappa S, Essa MM, Chidambaram SB, Guillemin GJ. Papaverine, a phosphodiesterase 10A inhibitor, ameliorates quinolinic acid-induced synaptotoxicity in human cortical neurons. Neurotox Res. 2021;39:1238–1250. - PubMed
    1. Blomgren K, Hagberg H. Free radicals, mitochondria, and hypoxia-ischemia in the developing brain. Free Radic Biol Med. 2006;40:388–397. - PubMed

LinkOut - more resources