. 2024 Oct 1;327(4):L439-L451.
doi: 10.1152/ajplung.00083.2024. Epub 2024 Aug 6.

Enhanced glycolysis causes extracellular acidification and activates acid-sensing ion channel 1a in hypoxic pulmonary hypertension

Affiliations

Enhanced glycolysis causes extracellular acidification and activates acid-sensing ion channel 1a in hypoxic pulmonary hypertension

Megan N Tuineau et al. Am J Physiol Lung Cell Mol Physiol. .

Abstract

In pulmonary hypertension (PHTN), a metabolic shift to aerobic glycolysis promotes a hyperproliferative, apoptosis-resistant phenotype in pulmonary arterial smooth muscle cells (PASMCs). Enhanced glycolysis induces extracellular acidosis, which can activate proton-sensing membrane receptors and ion channels. We previously reported that activation of the proton-gated cation channel acid-sensing ion channel 1a (ASIC1a) contributes to the development of hypoxic PHTN. Therefore, we hypothesize that enhanced glycolysis and subsequent acidification of the PASMC extracellular microenvironment activate ASIC1a in hypoxic PHTN. We observed decreased oxygen consumption rate and increased extracellular acidification rate in PASMCs from chronic hypoxia (CH)-induced PHTN rats, indicating a shift to aerobic glycolysis. In addition, we found that intracellular alkalization and extracellular acidification occur in PASMCs following CH and in vitro hypoxia, which were prevented by the inhibition of glycolysis with 2-deoxy-d-glucose (2-DG). Inhibiting H+ transport/secretion through carbonic anhydrases, Na+/H+ exchanger 1, or vacuolar-type H+-ATPase did not prevent this pH shift following hypoxia. Although the putative monocarboxylate transporter 1 (MCT1) and -4 (MCT4) inhibitor syrosingopine prevented the pH shift, the specific MCT1 inhibitor AZD3965 and/or the MCT4 inhibitor VB124 were without effect, suggesting that syrosingopine targets the glycolytic pathway independent of H+ export. Furthermore, 2-DG and syrosingopine prevented enhanced ASIC1a-mediated store-operated Ca2+ entry in PASMCs from CH rats. These data suggest that multiple H+ transport mechanisms contribute to extracellular acidosis and that inhibiting glycolysis-rather than specific H+ transporters-more effectively prevents extracellular acidification and ASIC1a activation. Together, these data reveal a novel pathological relationship between glycolysis and ASIC1a activation in hypoxic PHTN.NEW & NOTEWORTHY In pulmonary hypertension, a metabolic shift to aerobic glycolysis drives a hyperproliferative, apoptosis-resistant phenotype in pulmonary arterial smooth muscle cells. We demonstrate that this enhanced glycolysis induces extracellular acidosis and activates the proton-gated ion channel, acid-sensing ion channel 1a (ASIC1a). Although multiple H+ transport/secretion mechanisms are upregulated in PHTN and likely contribute to extracellular acidosis, inhibiting glycolysis with 2-deoxy-d-glucose or syrosingopine effectively prevents extracellular acidification and ASIC1a activation, revealing a promising therapeutic avenue.

Keywords: VB124; Warburg effect; monocarboxylic acid transporters; pH regulation; vascular smooth muscle.


Conflict of interest statement

No conflicts of interest, financial or otherwise, are declared by the authors.

Figures

None
Graphical abstract
Figure 1.
Figure 1.
Reduced oxidative phosphorylation and increased extracellular acidification in PASMCs from hypoxic pulmonary hypertensive rats. A: Seahorse XF Cell Mito Stress Test was used to measure OCR (pMol/min/µg protein) over time under basal conditions and after the addition of mitochondrial inhibitors (1 µM oligomycin, 1 µM FCCP and 0.5 µM rotenone/antimycin) in PASMCs from control (Con, gray circles) and CH (blue squares) rats. B: assessment of basal respiration, maximal respiration, and spare respiratory capacity. C: ATP production. D: proton leak. E: mitochondrial-ATP coupling efficiency (%). F: ECAR (mpH/min/µg protein). G: Seahorse XF Cell Energy Phenotype Test was used to measure OCR and ECAR under basal conditions (open symbols) and stressed conditions (closed symbols) in PASMCs from control and CH rats. Values are means ± SD; data points indicate n as the number of animals/group; analyzed by unpaired t test (Supplemental Table S1). CH, chronic hypoxia; ECAR, extracellular acidification rate; FCCP, carbonyl cyanide 4-trifluoromethoxyphenylhydrazone; OCR, oxygen consumption rate; PASMCs, pulmonary arterial smooth muscle cells.
Figure 2.
Figure 2.
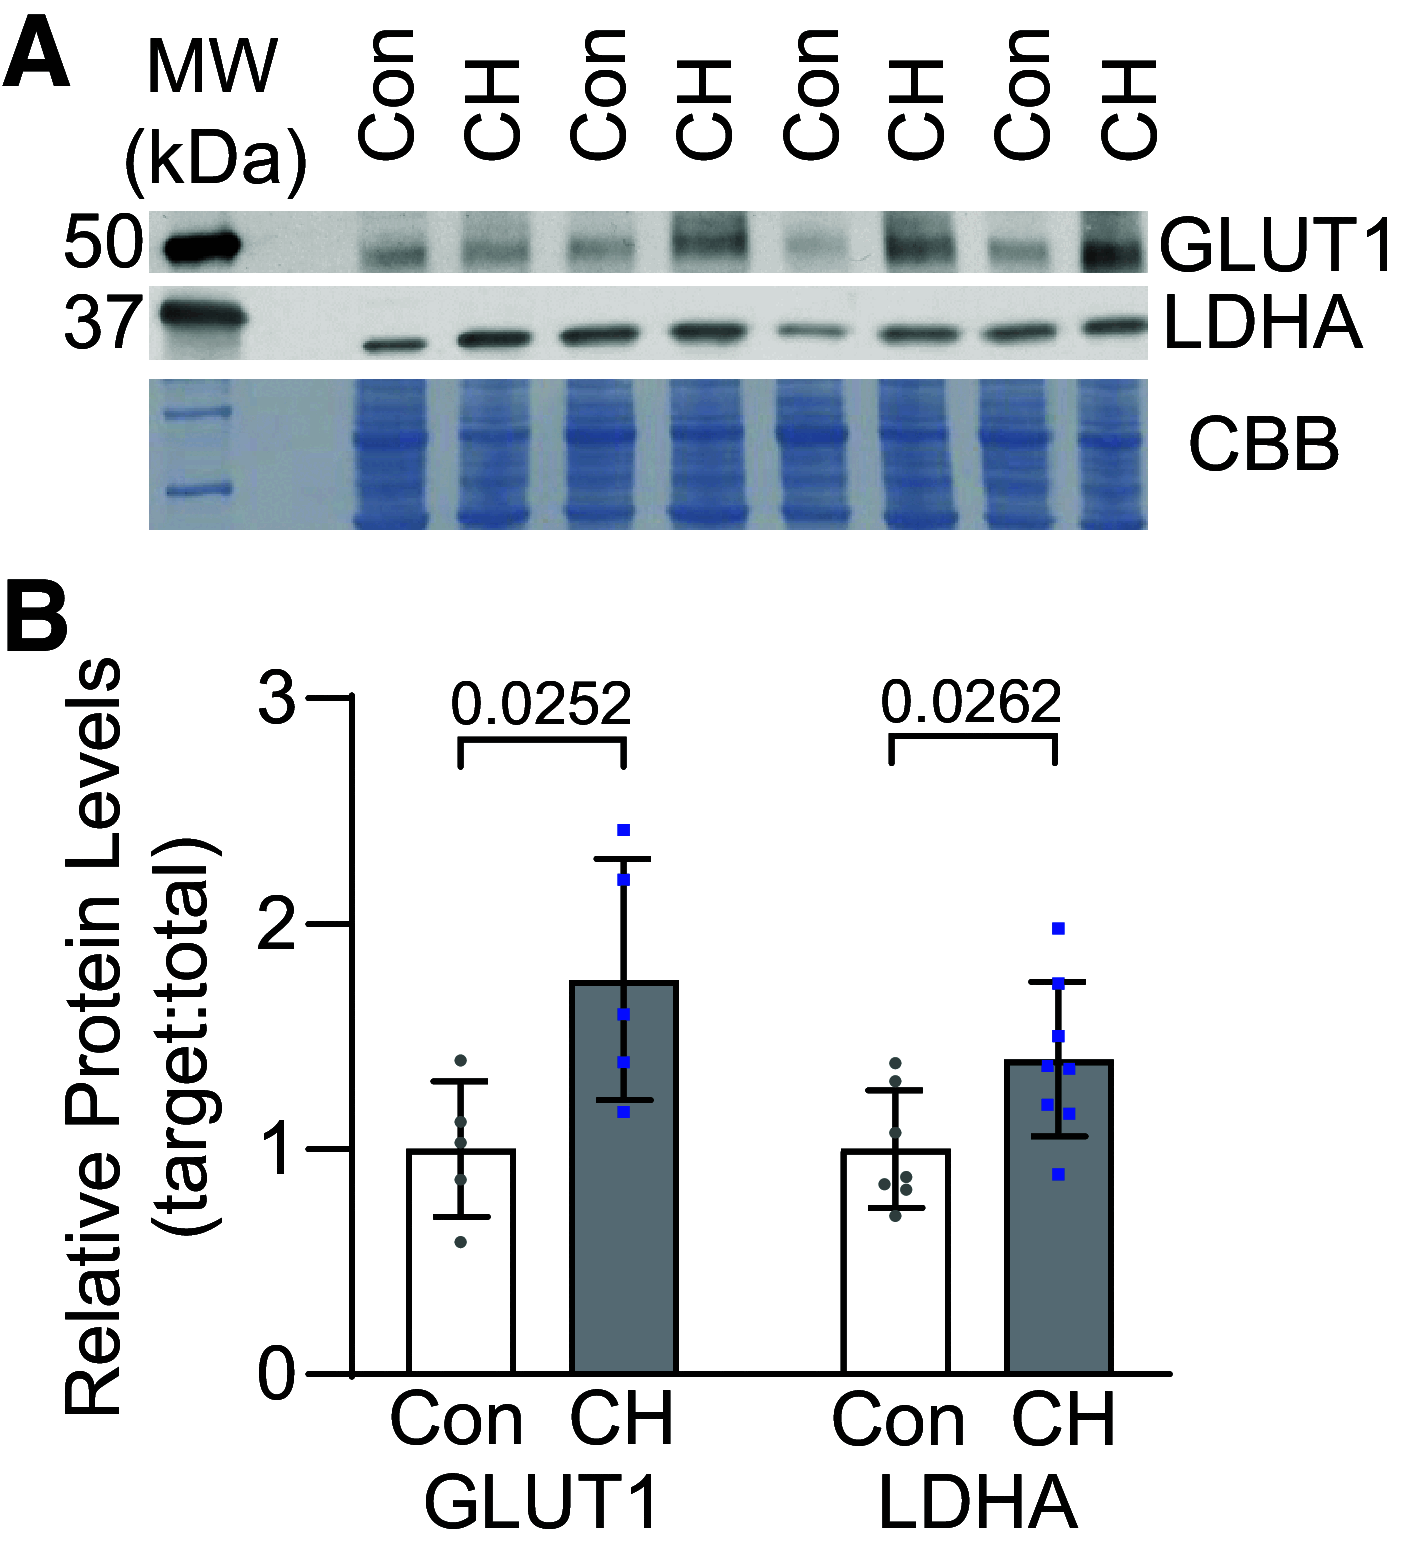
CH increases levels of glycolytic proteins in PASMCs. Representative Western blots (A) and summary data (B) showing protein expression of GLUT1 (∼50 kDa) and LDHA (∼35 kDa) in PASMCs from control (Con, gray circles) and CH (blue squares) rats. Protein expression was normalized to total lane protein determined by CBB staining and quantified as relative protein levels compared with the average of the control group. Values are means ± SD; data points indicate n as the number of animals/group; analyzed by unpaired t test (Supplemental Table S2). CBB, Coomassie brilliant blue; CH, chronic hypoxia; GLUT1, glucose transporter 1; LDHA, lactate dehydrogenase; PASMCs, pulmonary arterial smooth muscle cells.
Figure 3.
Figure 3.
Inhibition of glycolysis prevents extracellular acidification in PASMCs following CH. Calibration images of intracellular (pHi = 7) SNARF-5F, AM (A) and extracellular (pHe = 7) SNARF-5F fluorescence (B). Summary data for pHi (left) and pHe (right) in PASMCs from control (Con, gray circles) and CH (blue squares) rats (C) and pHe in PASMCs from control and CH rats following 30-min treatment with vehicle or 50 mM 2-DG (D). Values are means ± SD; data points indicate n as the number of animals/group; analyzed by unpaired t test (C) or two-way ANOVA (D); significant interactions between the individual groups (P = 0.0008) were compared using Šídák’s multiple comparisons test (Supplemental Tables S3 and S4). 2-DG, 2-deoxy-d-glucose; CH, chronic hypoxia; PASMCs, pulmonary arterial smooth muscle cells.
Figure 4.
Figure 4.
CH and in vitro hypoxia upregulate MCT4 protein expression in PASMCs. Representative Western blots and summary data showing protein expression of CA IX (∼70 kDa), NHE1 (∼90 kDA), MCT1 (∼54 kDa), and MCT4 (∼45 kDa) in PASMCs from control (Con, gray circles) or CH (blue squares) rats (A and B) or following exposure to normoxia (Nor, gray circles) or 72 h in vitro hypoxia (Hyp, red diamonds) (C and D). Protein expression was normalized to total lane protein determined by CBB staining and quantified as relative protein levels compared with the average of the control group. Values are means ± SD; data points indicate n as the number of animals/group; analyzed by unpaired t test (Supplemental Tables S5 and S6). CAIX, carbonic anhydrase IX; CBB, Coomassie brilliant blue; CH, chronic hypoxia; MCT1, monocarboxylate transporter 1; MCT4, monocarboxylate transporter 4; NHE1, Na+/H+ exchanger 1; PASMCs, pulmonary arterial smooth muscle cells.
Figure 5.
Figure 5.
Syrosingopine prevents intracellular alkalization and extracellular acidification following in vitro hypoxia exposure in PASMCs. Summary data for pHi (A) and pHe (B) in PASMCs exposed to normoxia (Nor, gray circles) or 72 h in vitro hypoxia (Hx, red diamonds). PASMCs were treated 24 h before experiments with vehicle (Veh; DMSO) or acetazolamide (Ace, 10 μM), bafilomycin A1 (Baf, 10 μM), syrosingopine (Syro, 10 μM), or zoniporide (Zon, 10 μM). Dotted lines show average response in Nor and Hx. Values are means ± SD; data points indicate n as number of individual experiments from 3 to 4 animals/group; analyzed by two-way ANOVA. There was not a significant interaction [P = 0.5740 (A) and 0.2504 (B)]; main group effects were analyzed using Šídák’s multiple comparisons test (Supplemental Tables S7 and S8). pHe, extracellular pH; pHi, intracellular pH; PASMCs, pulmonary arterial smooth muscle cells.
Figure 6.
Figure 6.
Inhibition of MCT1/4 does not alter pHe. Summary data showing pHe in PASMCs exposed to normoxia (Nor, gray circles) or 72 h in vitro hypoxia (Hx, red diamonds). PASMCs were treated 24 h before experiments with vehicle (Veh; DMSO) or AZD3965 (AZD; 10–100 μM) (A), VB124 (VB; 10–100 μM) (B), or combined AZD3965/VB124 (AZD/VB; 10–80 μM each) (C). Values are means ± SD; data points indicate n as the number of individual experiments from 3 to 4 animals/group; analyzed by two-way ANOVA; interaction P values are reported in Supplemental Tables S9–S11; significant interactions were analyzed using Šídák’s multiple comparisons test; as indicated in each figure, the column factor (Hx exposure) had a significant effect on pHe for each drug at all concentrations. MCT1/4, monocarboxylate transporter 1/4; pHe, extracellular pH; PASMCs, pulmonary arterial smooth muscle cells.
Figure 7.
Figure 7.
MCT1 and MCT4 inhibition prevents lactate efflux and causes intracellular lactate accumulation. A: extracellular lactate concentration ([lactate]e; µM) in PASMCs from control (Con, gray circles) or 4 wk CH (blue squares) rats. PASMCs were treated 24 h before experiments with vehicle (Veh; DMSO), AZD3965 (AZD; 30 μM), VB124 (VB; 30 μM), combined AZD3965/VB124 (AZD/VB; 10 μM each), syrosingopine (syro; 10 μM), or GSK2837808A (GSK; 10 μM). B: intracellular lactate concentration ([lactate]i; µM) in PASMCs from control (Con; gray circles) or CH (blue squares) rats treated 24 h before experiments with Veh, combined AZD/VB (10 μM each), Syro (10 μM), or GSK (10 μM). Values are means ± SD; dotted lines are means for vehicle group for Con and CH as indicated; data points indicate n as the number of individual experiments from 3 to 4 animals/group. Data were analyzed by two-way ANOVA; interactions and main effects between the individual groups were compared using Šídák’s multiple comparisons test (Supplemental Tables S12 and S13). CH, chronic hypoxia; MCT1, monocarboxylate transporter 1; MCT4, monocarboxylate transporter 4; PASMCs, pulmonary arterial smooth muscle cells.
Figure 8.
Figure 8.
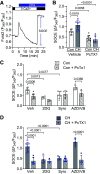
Inhibition of glycolysis, but not MCT1/MCT4, prevents enhanced ASIC1a-mediated SOCE following CH. A: representative trace showing SOCE. B: summary data for SOCE (ΔF340/F380) determined in PASMCs from control (Con, gray circles) and CH (blue squares) rats in the absence (open symbols) or presence of 20 nM PcTx1 (closed symbols). C and D: PASMCs from control (C) and CH (D) rats were treated 24 h before experiments with appropriate vehicle (Veh; DMSO), 2-DG (50 mM), syrosingopine (Syro; 10 μM), or combined AZD3965/VB124 (AZD/VB; 10 μM each) in the absence (open symbols) or presence of 20 nM PcTx1 (closed symbols). Values are means ± SD; data points indicate n as the number of individual experiments from 3 to 4 animals/group; analyzed by two-way ANOVA; significant interactions between the individual groups [P = 0.0016 (B), 0.0216 (C), <0.0001 (D)] and individual groups compared using Šídák’s multiple comparisons test (Supplemental Tables S14–S16). 2-DG, 2-deoxy-d-glucose; ASIC1a, acid-sensing ion channel 1a; CH, chronic hypoxia; MCT1, monocarboxylate transporter 1; MCT4, monocarboxylate transporter 4; PASMCs, pulmonary arterial smooth muscle cells; PcTx1, psalmotoxin 1; SOCE, store-operated Ca2+ entry.
Figure 9.
Figure 9.
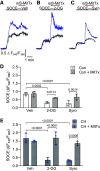
Pharmacological activation of ASIC1a following inhibition of glycolysis restores SOCE. Representative traces showing SOCE (ΔF340/F380) in PASMCs from control (Con; gray) and CH rats (blue) following 24-h treatment with vehicle (DMSO) (A), 2-DG (50 mM) (B), or syrosingopine (Syro; 10 μM) (C) and following the subsequent addition of the ASIC1a agonist, α/β-MitTx (100 nM). D and E: summary data for SOCE determined in PASMCs from Con (gray circles) (D) and CH (blue squares) (E) rats in the absence (open symbols) or presence of α/β-MitTx (closed symbols). Values are means ± SD; data points indicate n as the number of individual experiments from 3 to 4 animals/group; analyzed by two-way ANOVA; significant interactions between the individual groups [P = 0.0280 (D), 0.0001 (E)] were compared using Šídák’s multiple comparisons test (Supplemental Tables S17 and S18). 2-DG, 2-deoxy-d-glucose; ASIC1a, acid-sensing ion channel 1a; CH, chronic hypoxia; PASMCs, pulmonary arterial smooth muscle cells; SOCE, store-operated Ca2+ entry.

References

    1. Liang S, Yegambaram M, Wang T, Wang J, Black SM, Tang H. Mitochondrial metabolism, redox, and calcium homeostasis in pulmonary arterial hypertension. Biomedicines 10: 341, 2022. doi: 10.3390/biomedicines10020341. - DOI - PMC - PubMed
    1. Parks SK, Cormerais Y, Pouysségur J. Hypoxia and cellular metabolism in tumour pathophysiology: hypoxia and tumour pathophysiology. J Physiol 595: 2439–2450, 2017. doi: 10.1113/JP273309. - DOI - PMC - PubMed
    1. Koltai T. Targeting the pH paradigm at the bedside: a practical approach. Int J Mol Sci 21: 9221, 2020. doi: 10.3390/ijms21239221. - DOI - PMC - PubMed
    1. Pamarthy S, Kulshrestha A, Katara GK, Beaman KD. The curious case of vacuolar ATPase: regulation of signaling pathways. Mol Cancer 17: 41, 2018. doi: 10.1186/s12943-018-0811-3. - DOI - PMC - PubMed
    1. Estrella V, Chen T, Lloyd M, Wojtkowiak J, Cornnell HH, Ibrahim-Hashim A, Bailey K, Balagurunathan Y, Rothberg JM, Sloane BF, Johnson J, Gatenby RA, Gillies RJ. Acidity generated by the tumor microenvironment drives local invasion. Cancer Res 73: 1524–1535, 2013. doi: 10.1158/0008-5472.CAN-12-2796. - DOI - PMC - PubMed

MeSH terms

LinkOut - more resources