. 2024 Jul 2;27(8):110441.
doi: 10.1016/j.isci.2024.110441. eCollection 2024 Aug 16.

Cytokine profile of anti-spike CD4+T cells predicts humoral and CD8+T cell responses after anti-SARS-CoV-2 mRNA vaccination

Affiliations

Cytokine profile of anti-spike CD4+T cells predicts humoral and CD8+T cell responses after anti-SARS-CoV-2 mRNA vaccination

Nadine Benhamouda et al. iScience. .

Abstract

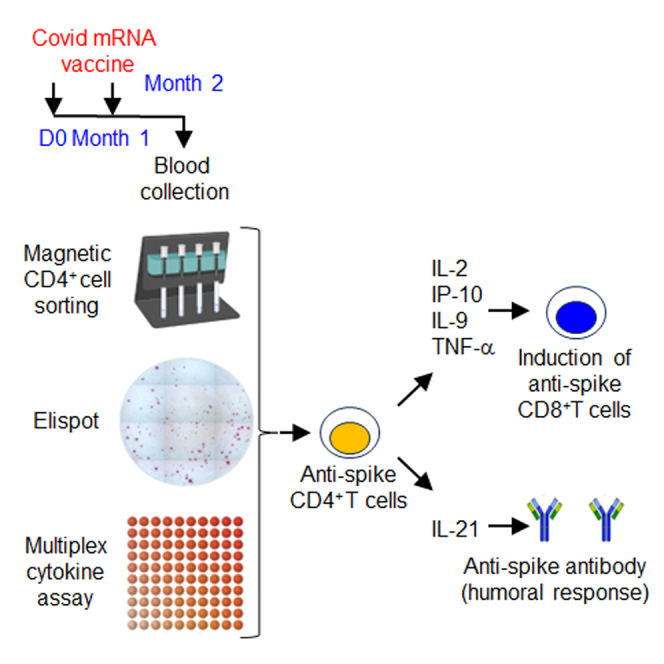
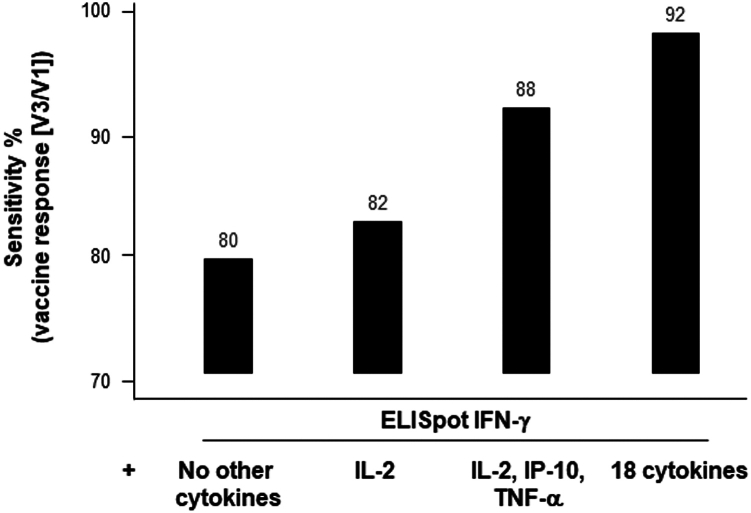
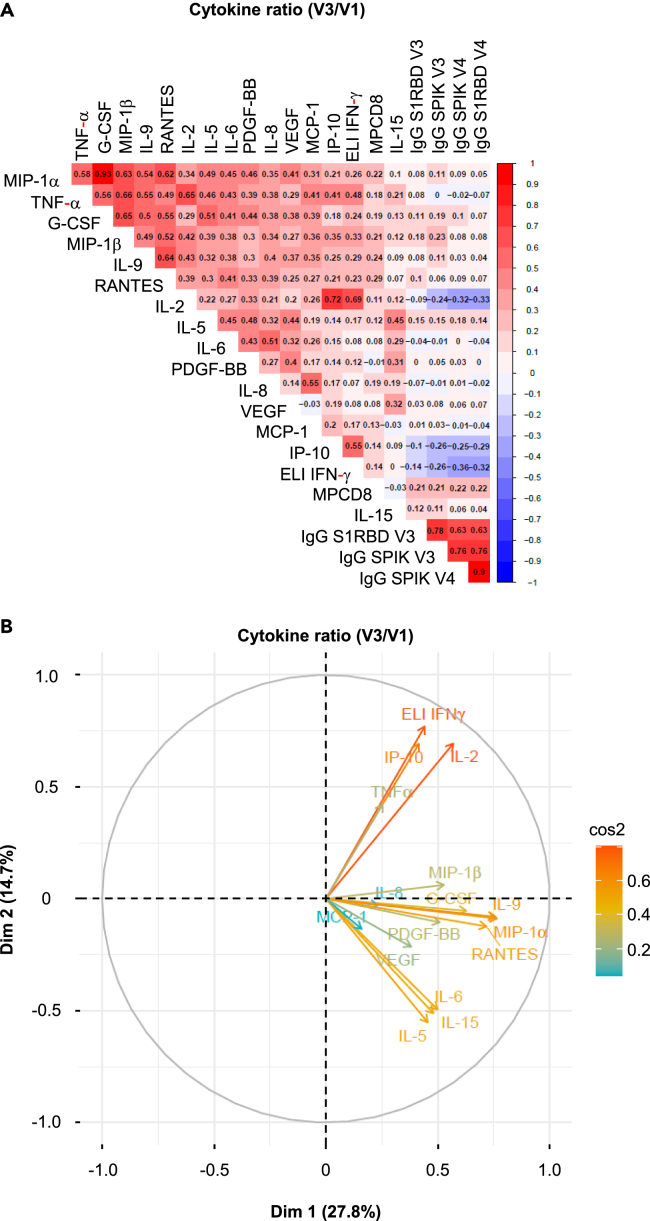
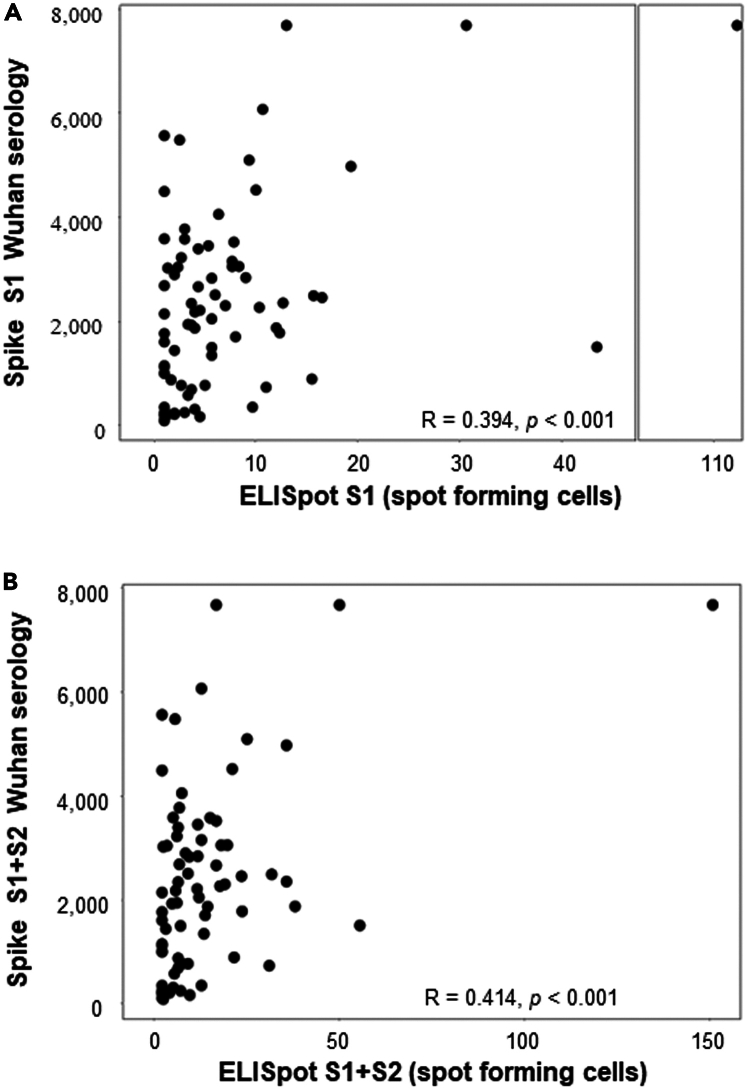
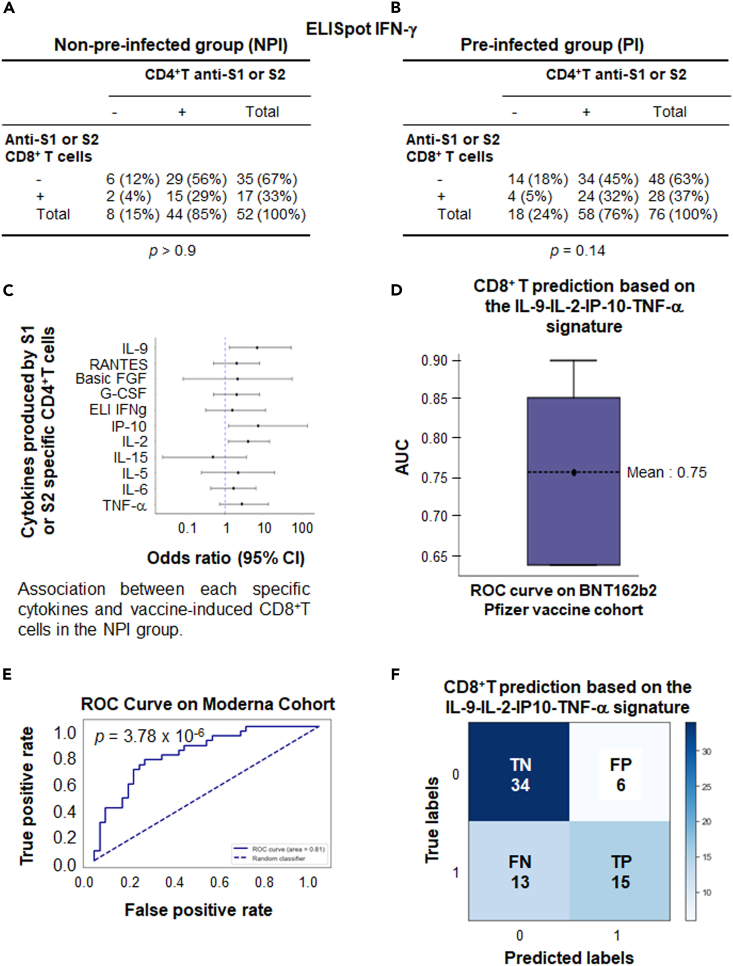
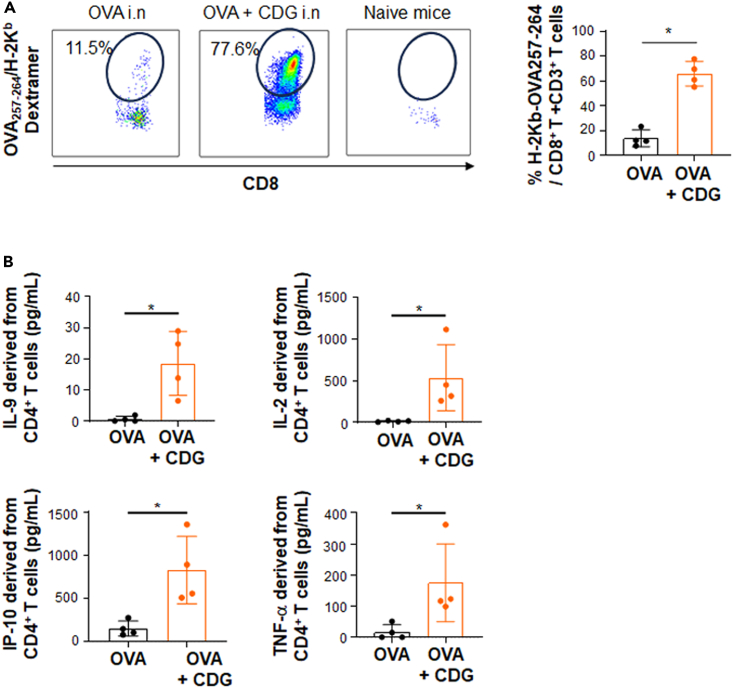
Coordinating immune responses - humoral and cellular - is vital for protection against severe Covid-19. Our study evaluates a multicytokine CD4+T cell signature's predictive for post-vaccinal serological and CD8+T cell responses. A cytokine signature composed of four cytokines (IL-2, TNF-α, IP10, IL-9) excluding IFN-γ, and generated through machine learning, effectively predicted the CD8+T cell response following mRNA-1273 or BNT162b2 vaccine administration. Its applicability extends to murine vaccination models, encompassing diverse immunization routes (such as intranasal) and vaccine platforms (including adjuvanted proteins). Notably, we found correlation between CD4+T lymphocyte-produced IL-21 and the humoral response. Consequently, we propose a test that offers a rapid overview of integrated immune responses. This approach holds particular relevance for scenarios involving immunocompromised patients because they often have low cell counts (lymphopenia) or pandemics. This study also underscores the pivotal role of CD4+T cells during a vaccine response and highlights their value in vaccine immunomonitoring.

Keywords: Health sciences; Immunity; Machine learning; Mathematical biosciences; Virology.


Conflict of interest statement

DW is a consultant for Moderna. AS is a consultant for Gritstone Bio, Flow Pharma, Moderna, AstraZeneca, Qiagen, Fortress, Gilead, Sanofi, Merck, RiverVest, MedaCorp, Turnstone, NA Vaccine Institute, Emervax, Gerson Lehrman Group and Guggenheim. LJI has filed for patent protection for various aspects of T cell epitope and vaccine design work. OL participated in boards for Pfizer and Moderna. ET is consultant for Moderna and speakers for MSD and BMS.

Figures

None
Graphical abstract
Figure 1
Figure 1
Percentage of vaccine-generated anti-spike CD4+T cell response depending on the cytokine measured A total of 128 patients, including 76 who were pre-infected and 52 who were uninfected, received vaccination. Non-pre-infected volunteers received BNT162b2 vaccine (30 μg) at V1 (D0) and V2 (D29), while pre-infected volunteers received only one dose of vaccine at V1. At V3, which is one month after the second vaccination or 2 months after the only 1st vaccination depending on their infection status, the patients' CD4+T cells were sorted and sensitized in vitro with a megapool of overlapping peptides covering the S1 protein and another pool for the S2 protein. An ELIspot (ELI) IFNγ assay and a 27-cytokine Luminex assay, were then performed after 24 or 48 h of incubation, respectively. The Luminex assay was used with supernatants of ELIspot IFNγ not coated with anti-IFNγ antibodies. The frequency of vaccine response for each cytokine, as determined by the V3/V1 ratio ≥2, and a concentration of the cytokine ≥10 pg/mL (after background subtraction when cells were sensitized with medium) is shown. The threshold for vaccine response detection for a given cytokine is indicated by the dotted line at 10% frequency.
Figure 2
Figure 2
Difference in the induction of CD4+T cell vaccine response and the detection of T cell responses based on cytokine assays (A) Anti-spike multicytokine CD4+T cell responses were measured prior to vaccination (V1) in pre-infected (PI) (n = 76) and non-pre-infected (NPI) (n = 52) volunteers. (B) The absolute value of ELISpot IFNγ and cytokines assay were measured one month after the second BNT162b2 vaccination (V3) for non-pre-infected volunteers and after only one dose of vaccination for pre-infected participants at the same time. (C) The vaccine response based on CD4+T cell cytokines profile and the V3/V1 ratio was calculated for the same set of volunteers. (D) The ratio between V3 and V1 is shown regardless of infection status. Statistical differences, determined using the Wilcoxon test with FDR correction, are shown between the pre-infected and non-infected groups for each cytokine. Data are represented as mean ± SEM ∗: p ≤ 0.05; ∗∗: p ≤ 0.01; ∗∗∗: p ≤ 0.001.
Figure 3
Figure 3
Enhancement in sensitivity of the anti-spike CD4+T cell assay through multiple cytokines detection A comparison of the CD4+T cell vaccine responses (V3/V1) was performed using either a positive ELISpot IFNγ assay alone (without cytokine) or in combination with the detection of IL-2 or 3 cytokines (IL-2, IP-10, TNFα), or 18 cytokines via Luminex (n = 128). The respective sensitivity of the different tests is shown on the histograms.
Figure 4
Figure 4
Correlation among various cytokines defining the vaccine response to CD4+T cell cellular and humoral responses (A) Non-parametric Spearman test for the analysis of the correlation matrix illustrates the strength of the correlation between each cytokine produced by CD4+T cells following the vaccine response, as defined by the V3/V1 ratio, and the serological response. The concentration of anti-spike or RBD IgG antibodies at 3 and 6 months is incorporated into this correlation matrix as a surrogate marker of serology. The scale for the correlation is shown on the right side of the matrix. Negative correlations are depicted in blue, while positive correlations are shown in red (n = 128). (B) Principal Component Analysis (PCA) biplots for the pattern of multicytokine secretion by CD4+T cells in response to the vaccine (V3/V1). In each biplot, the lengths of arrows correspond to the magnitude of the variable (approximating its variance). The angles between arrows (cosine) approximate their correlation. All arrows are labeled with the respective variables they represent.
Figure 5
Figure 5
Correlation between IL-21 produced by anti-spike CD4+T cell and spike serology IL-21 ELISpot assay against S1 (A), or S1+S2 (B) peptide MP on sorted CD4+T cells was performed in a cohort of patients vaccinated with the BNT162b2 vaccine (n = 108). The ELISpot results are expressed as the number of spots/105 cells. These results were correlated with spike serology performed at the same time point as the IL-21 ELISpot results.
Figure 6
Figure 6
Profile of cytokines produced by CD4+T cells could predict the vaccine induced CD8+T cell response using a machine learning approach Correlation via Pearson’s Chi-Squared test was sought between the positivity of the ELISpot IFNγ performed on CD4+T cells against S1 or S2 after vaccination (D57) in non-pre-infected (n = 108) (A) or pre-infected (n = 104) (B) volunteers and the parallel induction of CD8+T cells against S1 or S2. (C) Correlation was sought between the positivity for the V3/V1 ratio criteria of each cytokine produced by CD4+T cells sensitized by S1 and S2 after vaccination (D57) in non-pre-infected volunteers and the parallel induction of CD8+T cells against S1 or S2 (detected by ELISpot IFNγ) using the statistical Cox test. (D) An algorithm was established using machine learning by training 80% of the Pfizer cohort with a Gradient Boosting algorithm (XGB). The model was validated on 20% of volunteers from the unused Pfizer cohort using 5-fold cross-validation to demonstrate the stability of the model. Boxplots representing the resulting AUC for the resulting models are shown. (E) ROC curve calculated on the mRNA-vaccinated Moderna cohort dataset (n = 68). The dashed diagonal line represents random classification. AUC and p-values are shown. (F) The confusion matrix generated by the model summarizes the model’s performance. The matrix’s diagonal elements represent the number of corrected predictions (True Negative [TN] and True Positive [TP]), while the off-diagonal elements represent incorrect predictions (False positive [FP] and False negative [FN]). The Fisher exact test was used to determine the p value.
Figure 7
Figure 7
Value of the CD4+T cells derived cytokine signature in predicting CD8+T cell response in mice Mice (n = 4) were immunized by the nasal route with ovalbumin (OVA; 100 mg), either alone or combined with the adjuvant C-di-GMP (10 mg), on D0 and D14. On D21, BAL was recovered and the frequency of CD8+T cells was quantified using an OVA257-264 H-2Kb dextramer. After perfusion, lungs were harvested, and purified CD4+T cells (105 cells) were plated in 96-well plates with splenocytes derived from naive mice that were either sensitized or not with the long OVA peptide (TEWTSSNVMEERKIKV [OVA265–280]). After 36 h, supernatants were collected and tested for the presence of IL-9, IL-2, TNFα, and IP-10. (A) Induction of anti-OVA257-264 CD8+T cells in mice vaccinated with OVA alone or in combination with the adjuvant C-di-GMP. (B) Cytokine concentrations in CD4+T cells supernatants derived from lung, sensitized with the long OVA peptide. The Mann Whitney statistical test was used for the analysis; Data are represented as mean ± SEM. ∗: p ≤ 0.05; ∗∗: p ≤ 0.01; ∗∗∗: p ≤ 0.001.

References

    1. Sette A., Sidney J., Crotty S. T Cell Responses to SARS-CoV-2. Annu. Rev. Immunol. 2023;41:343–373. doi: 10.1146/annurev-immunol-101721-061120. - DOI - PubMed
    1. Rydyznski Moderbacher C., Ramirez S.I., Dan J.M., Grifoni A., Hastie K.M., Weiskopf D., Belanger S., Abbott R.K., Kim C., Choi J., et al. Antigen-Specific Adaptive Immunity to SARS-CoV-2 in Acute COVID-19 and Associations with Age and Disease Severity. Cell. 2020;183:996–1012.e19. doi: 10.1016/j.cell.2020.09.038. - DOI - PMC - PubMed
    1. Oja A.E., Saris A., Ghandour C.A., Kragten N.A.M., Hogema B.M., Nossent E.J., Heunks L.M.A., Cuvalay S., Slot E., Linty F., et al. Divergent SARS-CoV-2-specific T- and B-cell responses in severe but not mild COVID-19 patients. Eur. J. Immunol. 2020;50:1998–2012. doi: 10.1002/eji.202048908. - DOI - PubMed
    1. Tarke A., Potesta M., Varchetta S., Fenoglio D., Iannetta M., Sarmati L., Mele D., Dentone C., Bassetti M., Montesano C., et al. Early and Polyantigenic CD4 T Cell Responses Correlate with Mild Disease in Acute COVID-19 Donors. Int. J. Mol. Sci. 2022;23:7155. doi: 10.3390/ijms23137155. - DOI - PMC - PubMed
    1. Tan A.T., Linster M., Tan C.W., Le Bert N., Chia W.N., Kunasegaran K., Zhuang Y., Tham C.Y.L., Chia A., Smith G.J.D., et al. Early induction of functional SARS-CoV-2-specific T cells associates with rapid viral clearance and mild disease in COVID-19 patients. Cell Rep. 2021;34 doi: 10.1016/j.celrep.2021.108728. - DOI - PMC - PubMed

LinkOut - more resources